Estimation methods and correction factors for body weight in Mangalarga
Marchador horses
Felipe Amorim Caetano de Souza1*, Joel Augusto Muniz2, Tales Jesus Fernandes2, Fabiana Oliveira Cunha1, Sarah Laguna Conceição Meirelles3, José Camisão de Souza3, Raquel Silva
de Moura3
1 Universidade Federal de Lavras, Programa de Pós-graduação em Zootecnia, Lavras, MG, Brazil. 2 Universidade Federal de Lavras, Departamento de Estatística, Lavras, MG, Brazil.
3 Universidade Federal de Lavras, Departamento de Zootecnia, Lavras, MG, Brazil.
ABSTRACT - The objective was to evaluate the accuracy of six body weight (BW) estimating methods in Mangalarga Marchador horses (MM) (n = 318): method A - tape placements at three different positions around the thoracic girth; B - Crevat and Quetelec’s formula; C - Hall’s formula; D - Hintz and Griffiths’ table; E - Santos’ table; and F - Cintra’s formula. For additional analyses, gender, age, and gestational stage were considered. Estimated average BW was compared to the actual scale weight by the paired T test, mean predicted error, and determination coefficient. In the general population, methods A (position 3), B, and C estimated BW that were different from that of the scale. Method A, at positions 1 and 2, was more accurate in predicting the scale weight results compared with all other methods. For pregnant mares, the tape in positions 1 and 2 in method A did not differ from those of the scale. Method A in positions 1 and 2 and the table (method E) may be used to estimate the BW of males and females of different ages and/or gestational stages. To use Methods B and C, correction factors are necessary to precisely estimate the body weights in this breed.
Key Words: animal production, equine, foal, nutrition, pregnancy
© 2017 Sociedade Brasileira de Zootecnia ISSN 1806-9290
www.sbz.org.br
R. Bras. Zootec., 46(12):903-909, 2017
Received: April 27, 2017 Accepted: August 7, 2017
*Corresponding author: felipeufl[email protected] http://dx.doi.org/10.1590/S1806-92902017001200005
How to cite: Souza, F. A. C.; Muniz, J. A.; Fernandes, T. J.; Cunha, F. O.; Meirelles, S. L. C.; Souza, J. C. and Moura, R. S. 2017. Estimation methods and correction factors for body weight in Mangalarga Marchador horses. Revista Brasileira de Zootecnia 46(12):903-909.
Copyright © 2017 Sociedade Brasileira de Zootecnia. This is an Open Access article distributed under the terms of the Creative Commons Attribution License (http://creativecommons.org/licenses/by/4.0/), which permits unrestricted use, distribution, and reproduction in any medium, provided the original work is properly cited.
Introduction
The Brazilian equine herd has over five million animals, considering working horses, those registered in breed associations, leisure, and competition. The horse agribusiness complex is worth R$ 16.15 billion (approximately 4.6 billion dollars), generating 610 thousand direct and 2.4 million indirect jobs, totaling over three million work positions (Lima and Cintra, 2015).
The Mangalarga Marchador breed, originated in the south region of Minas Gerais, is the largest native riding horse breed in Brazil. Morphologically, they are characterized as light saddle type horses, with withers height between 140 and 154 cm and 147 to 157 cm for females and males, respectively; have triangular head and
neck of a pyramid shape, strong and well-proportioned structure, and a smooth four-beat gait called “marcha” (Cabral et al., 2004; Pinto et al., 2005; Santiago et al., 2013, 2014, 2016).
Despite the intense recent development of the Brazilian equine industry, several key points related to the evaluation of the nutritional and health condition of the horses need to be addressed. In this context, body weight is a very basic management tool and it is strategic for the nutritional programs, the correct administration of drugs, and in monitoring the body growth of foals (Santos et al., 2007).
The most accurate way to measure BW is by scale weighing, but often its high implementation cost limits its availability for use in most Brazilian farms. Thus, the methods for estimating BW, such as weighing tapes, tables, and mathematical formulas are practical, cheaper, and more appropriate alternatives (Ellis and Holand, 2002; Wagner et al., 2009; Hoffmann et al., 2013). However, the efficiency of these methods may be affected by some horse characteristics (gender, age, pregnancy stage, body score, and breed), as well as features independent of the animals, such as food availability, health status, and environmental conditions (García Neder et al., 2009).
posing more specific questions such as what is the correct position in which the weighing tape must be placed? Therefore, studies are necessary to answer these questions. The objective was to evaluate and compare the effectiveness of six methods of body weight estimation in young (males and females) and adult (male, barren females, pregnant females) Mangalarga Marchador horses.
Material and Methods
Three hundred and eighteen Mangalarga Marchador horses of distinct gender and ages and adult mares in various gestational stages were evaluated (Table 1). Data were collected in 2012 from a ring show event (Belo Horizonte, MG, Brazil) and from a private stud farm (Lavras, MG, Brazil), after obtaining the approval of the Research Ethics Committee, under case no. 039/12. Each horse was first weighed, to the nearest kg, on either a fixed or a portable scale made available by the owners after calibration. Next, the body weights were estimated by the following methods:
Method A – a commercial horse weighing tape (Companhia do Sertão Agroveterinaria, Belo Horizonte, MG, Brazil), placed at three distinct positions around the thorax: at the withers midpoint and immediately caudal to the elbow (Position 1); immediately caudal to the withers and to the elbow (Position 2); and immediately caudal to the withers and at the caudal limit of the xyphoid cartilage (Position 3).
Method B – Crevat and Quetelet’s mathematical formula (Cintra, 2013):
BW (kg) = CG³ × 80,
in which CG³ is the thoracic perimeter or chest girth in meters – tape positioned immediately caudal to the withers
and at the caudal limit of the xyphoid cartilage, after respiratory expiration – and 80 is a constant.
Method C – Hall (1971) formula modified by Carroll and Huntington (1988):
BW (kg) = [(HG2 × BL) /11900],
in which HG2 is the thoracic perimeter or heart girth in
centimeters – tape positioned as in position 1 in method A, after expiration; BL is the body length in cm, checked with a horse measuring stick positioned cranially to the scapule-umeral joint and tip of the shoulder caudally to the tuber ischia (tip of the buttock); and 11900 is a constant.
Method D – table proposed by Hintz and Griffiths (1984); the only method in which a correction factor for pregnant mares is considered.
Method E – table proposed by Santos et al. (2008); the only method developed for a native Brazilian horse breed (Pantaneiro).
Method F – Cintra’s (2013) formula, specifically for weaned foals up to 12 months old:
BW (kg) = (HG – 25) / 0.7
in which HG is the thoracic perimeter or heart girth in cm – tape positioned at position 1 as in method A, after respiratory expiration; and 25 and 0.7 are constants.
Body condition score (BCS) was assessed according to a scale proposed by Carroll and Huntington (1988): 0 – thin and 5 – very obese. To characterize conformation, the following measurements were considered according to Cabral et al. (2004): withers height, body length, cannon and thoracic perimeter, and body and dactyl-thoracic indices. Body index (BI) = body length × 100/chest girth, if greater than 90, the animal is classified as a sport- or hunter-type horse; between 86 and 88, as saddle- or riding-type horse; and less than 85, as a draft-type horse. Dactyl thorax index
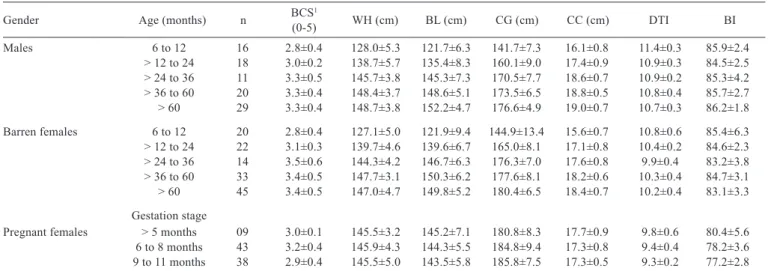
Table 1 - General characterization of the Mangalarga Marchador sample studied
Gender Age (months) n BCS(0-5)1 WH (cm) BL (cm) CG (cm) CC (cm) DTI BI
Males 6 to 12 16 2.8±0.4 128.0±5.3 121.7±6.3 141.7±7.3 16.1±0.8 11.4±0.3 85.9±2.4
> 12 to 24 18 3.0±0.2 138.7±5.7 135.4±8.3 160.1±9.0 17.4±0.9 10.9±0.3 84.5±2.5 > 24 to 36 11 3.3±0.5 145.7±3.8 145.3±7.3 170.5±7.7 18.6±0.7 10.9±0.2 85.3±4.2 > 36 to 60 20 3.3±0.4 148.4±3.7 148.6±5.1 173.5±6.5 18.8±0.5 10.8±0.4 85.7±2.7 > 60 29 3.3±0.4 148.7±3.8 152.2±4.7 176.6±4.9 19.0±0.7 10.7±0.3 86.2±1.8 Barren females 6 to 12 20 2.8±0.4 127.1±5.0 121.9±9.4 144.9±13.4 15.6±0.7 10.8±0.6 85.4±6.3 > 12 to 24 22 3.1±0.3 139.7±4.6 139.6±6.7 165.0±8.1 17.1±0.8 10.4±0.2 84.6±2.3 > 24 to 36 14 3.5±0.6 144.3±4.2 146.7±6.3 176.3±7.0 17.6±0.8 9.9±0.4 83.2±3.8 > 36 to 60 33 3.4±0.5 147.7±3.1 150.3±6.2 177.6±8.1 18.2±0.6 10.3±0.4 84.7±3.1 > 60 45 3.4±0.5 147.0±4.7 149.8±5.2 180.4±6.5 18.4±0.7 10.2±0.4 83.1±3.3
Gestation stage
Pregnant females > 5 months 09 3.0±0.1 145.5±3.2 145.2±7.1 180.8±8.3 17.7±0.9 9.8±0.6 80.4±5.6 6 to 8 months 43 3.2±0.4 145.9±4.3 144.3±5.5 184.8±9.4 17.3±0.8 9.4±0.4 78.2±3.6 9 to 11 months 38 2.9±0.4 145.5±5.0 143.5±5.8 185.8±7.5 17.3±0.5 9.3±0.2 77.2±2.8
(DTI) = cannon circumference × 100/chest girth; if less than 10.5, horses are considered saddle horses with poor structure; if equal to 10.5 and up to 10.8, as saddle horses; if equal to or greater than 10.8 and up to 11.0, as light-draft horses; and equal to and above 11.5, as heavy-draft horses (Cabral et al., 2004).
All statistical analyses were performed using the R statistical program (R Development Core Team, 2013). The model included reproductive status (intact males, n = 94; barren females, n = 134; and pregnant females, n = 90), age class (6-12, n = 36; >12-24, n = 40, >24-36, n = 25, >36-60, n= 53; and > 60 months, n = 74), and gestational stage (up to six months, n = 9; 6-8 months, n = 43; and >8-11 months, n = 38).
The means were compared with the real BW (scale) by the paired t test (P<0.05), mean predicted error (MPE),
and coefficient of determination (R2). The coefficient of
determination was calculated as the square of the simple linear correlation coefficient between the estimated and observed values; the closer to 1, the better. The MPE was obtained through the means of the deviations between the actual weight and the weight estimated by the alternative methods, in which negative values indicate overestimation of the actual weight and positive values underestimation; the closer to zero, the better MPE value of the method. Whenever the means between the estimating methods and the real weights were similar, according to the paired t test,
the MPE and the R2 were used as a complement to choose
the most reliable method.
The specific correction factors were also calculated for methods B and C in this breed. For method B, the correction factor was calculated by dividing the actual weights by the
weights obtained by this method and then the value found was multiplied by the constant (80) of the method B. For method C, the correction factor was calculated by dividing the actual weights by the weights obtained by this method and, afterwards, the method C constant (11.900) was divided by the value found. The correction factors were tested by paired t test (P<0.05) to verify its effectiveness.
Results
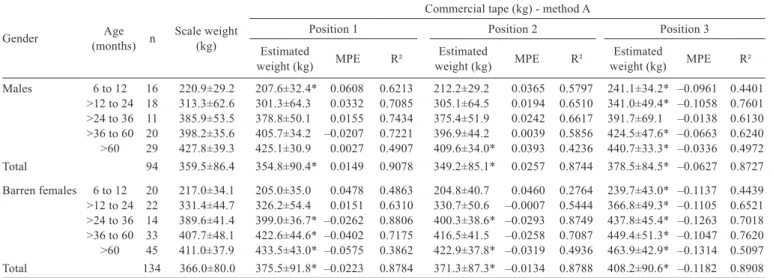
For 6-12 month-old males, tape position 1 underestimated the scale weight, but was similar to the remaining age classes (Table 2); tape position 2 underestimated the scale weight only in age class >60 months old; and position 3 overestimated the scale weight in all age classes, except for the > 24-36-month-old class. Therefore, for 6-12-month-old males, position 2 was a better method than positions 1 and 3; for >12-60-month-old males, positions 1 and 2 were equivalent because their means were similar to those of the scale; and for the > 60-month-old class, position 1 was the most precise.
Males were classified as of average size saddle-type horses (BI > 85). Barren females were also classified as saddle type, but with a lighter structure (BI < 85), as they approached adult age (Table 1).
For 6-12- and > 12-24-month-old females, positions 1 and 2 means were similar to the scale weight as well and the >36-60 month-old class in position 2 (Table 2). In the remaining classes, positions 1, 2, and 3 means were lower than the scale weight.
For mares with ≤ 5 and > 8-11 months of gestation, positions 1 and 2 estimates were similar to scale weights in all gestation stages (Table 4).
Table 2 - Scale and tape-estimated body weights of Mangalarga Marchador equines
Gender (months) nAge Scale weight(kg)
Commercial tape (kg) - method A
Position 1 Position 2 Position 3
Estimated
weight (kg) MPE R² weight (kg)Estimated MPE R² weight (kg)Estimated MPE R² Males 6 to 12 16 220.9±29.2 207.6±32.4* 0.0608 0.6213 212.2±29.2 0.0365 0.5797 241.1±34.2* –0.0961 0.4401
>12 to 24 18 313.3±62.6 301.3±64.3 0.0332 0.7085 305.1±64.5 0.0194 0.6510 341.0±49.4* –0.1058 0.7601 >24 to 36 11 385.9±53.5 378.8±50.1 0.0155 0.7434 375.4±51.9 0.0242 0.6617 391.7±69.1 –0.0138 0.6130 >36 to 60 20 398.2±35.6 405.7±34.2 –0.0207 0.7221 396.9±44.2 0.0039 0.5856 424.5±47.6* –0.0663 0.6240 >60 29 427.8±39.3 425.1±30.9 0.0027 0.4907 409.6±34.0* 0.0393 0.4236 440.7±33.3* –0.0336 0.4972 Total 94 359.5±86.4 354.8±90.4* 0.0149 0.9078 349.2±85.1* 0.0257 0.8744 378.5±84.5* –0.0627 0.8727 Barren females 6 to 12 20 217.0±34.1 205.0±35.0 0.0478 0.4863 204.8±40.7 0.0460 0.2764 239.7±43.0* –0.1137 0.4439 >12 to 24 22 331.4±44.7 326.2±54.4 0.0151 0.6310 330.7±50.6 –0.0007 0.5444 366.8±49.3* –0.1105 0.6521 >24 to 36 14 389.6±41.4 399.0±36.7* –0.0262 0.8806 400.3±38.6* –0.0293 0.8749 437.8±45.4* –0.1263 0.7018 >36 to 60 33 407.7±48.1 422.6±44.6* –0.0402 0.7175 416.5±41.5 –0.0258 0.7087 449.4±51.3* –0.1047 0.7620 >60 45 411.0±37.9 433.5±43.0* –0.0575 0.3862 422.9±37.8* –0.0319 0.4936 463.9±42.9* –0.1314 0.5097 Total 134 366.0±80.0 375.5±91.8* –0.0223 0.8784 371.3±87.3* –0.0134 0.8788 408.2±90.6* –0.1182 0.8908
Except for 6-12- and 24-36-month-old males in method B, the estimated weights were different from the scale weights for the remaining age classes for males and females with the two other formulas tested (Table 3).
Methods B and C estimates were different from the scale weights in all gestation stages (Table 5), probably because pregnant mares were classified as short-framed with a smaller body structure for saddle horses, in which BI and DTI values of <85 and <10.5, respectively, decreased as gestation progressed (Table 1). This classification may also be related to genetic selection, since most of the mares
were embryo recipients, which tend to be less uniform and, therefore, promoting the differences observed in body weight estimates.
Based on the differences between the scale and the estimated weights by methods B and C, new correction factors were calculated. Appropriate corrections were carried out on the constants of these methods and new equations used. Methods were adapted to males and non-pregnant females, as follows:
For males:
Adapted method B – BW (kg) = CG³ × 77;
Adapted method C – BW (kg) = [(HG2 × BL) /10635].
Table 3 - Scale and formula-estimated body weights of Mangalarga Marchador equines
Gender
Mathematical formula
Age
(months) n Scale weight (kg)
Crevat and Quetelet1 - method B Hall2 - method C Estimated weight
(kg) MPE R² Estimated weight (kg) MPE R²
Males 6 to 12 16 220.9±29.2 229.52±33.54 –0.0422 0.4740 186.06±28.95* 0.1575 0.5998
>12 to 24 18 313.3±62.6 331.65±55.11* –0.0715 0.7588 273.04±49.55* 0.1223 0.8487 >24 to 36 11 385.9±53.5 399.06±54.24 –0.0384 0.6091 342.82±45.72* 0.1089 0.6951 >36 to 60 20 398.2±35.6 419.89±48.28* –0.0536 0.7617 366.58±32.95* 0.0780 0.6658 >60 29 427.8±39.3 442.04±37.12* –0.0360 0.5239 389.68±31.73* 0.0864 0.5302
Total 94 359.5±86.4 374.99±88.61* 0.0774 0.8992 322.29±82.96* 0.1062 0.9194
Barren females 6 to 12 20 217.0±34.1 249.64±80.33* –0.1479 0.2971 187.86±33.84* 0.1319 0.7062 >12 to 24 22 331.4±44.7 362.18±54.39* –0.0945 0.684 295.38±47.62* 0.1080 0.6455 >24 to 36 14 389.6±41.4 440.74±53.43* –0.1321 0.7043 358.13±35.68* 0.0787 0.6969 >36 to 60 33 407.7±48.1 451.41±61.61* –0.1074 0.7215 383.96±41.77* 0.0549 0.6616 >60 45 411.0±37.9 471.84±50.96* –0.1493 0.5438 387.574±36.25* 0.0544 0.4557
Total 134 366.0±80.0 412.39±97.46* –0.1280 0.8307 338.66±81.17* –0.0479 0.8885
n - number of animals; MPE - mean predicted error; R² - coefficient of determination. * Significant difference under the paired test (P<0.05).
1 Formula proposed by Crevat and Quetelec (Cintra, 2013; Santos, 1981; Torres and Jardim, 1987; Marcenac and Aublet, 1964). 2 Formula proposed by Hall (Cintra, 2013; Wagner and Tyler, 2011; Carroll and Huntington, 1988; Ellis and Hollands, 1998).
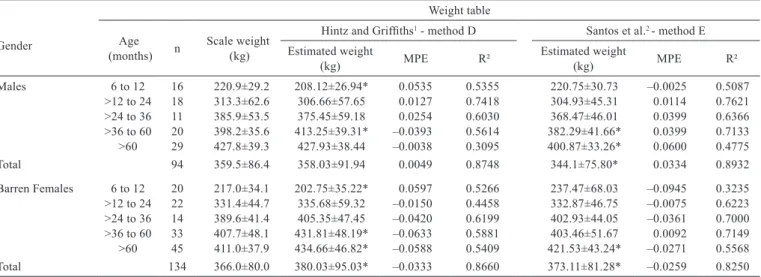
Table 4 - Scale and table-estimated body weights of Mangalarga Marchador equines
Gender
Weight table
Age
(months) n Scale weight (kg)
Hintz and Griffiths1 - method D Santos et al.2 - method E Estimated weight
(kg) MPE R² Estimated weight (kg) MPE R²
Males 6 to 12 16 220.9±29.2 208.12±26.94* 0.0535 0.5355 220.75±30.73 –0.0025 0.5087
>12 to 24 18 313.3±62.6 306.66±57.65 0.0127 0.7418 304.93±45.31 0.0114 0.7621 >24 to 36 11 385.9±53.5 375.45±59.18 0.0254 0.6030 368.47±46.01 0.0399 0.6366 >36 to 60 20 398.2±35.6 413.25±39.31* –0.0393 0.5614 382.29±41.66* 0.0399 0.7133 >60 29 427.8±39.3 427.93±38.44 –0.0038 0.3095 400.87±33.26* 0.0600 0.4775
Total 94 359.5±86.4 358.03±91.94 0.0049 0.8748 344.1±75.80* 0.0334 0.8932
Barren Females 6 to 12 20 217.0±34.1 202.75±35.22* 0.0597 0.5266 237.47±68.03 –0.0945 0.3235 >12 to 24 22 331.4±44.7 335.68±59.32 –0.0150 0.4458 332.87±46.75 –0.0075 0.6223 >24 to 36 14 389.6±41.4 405.35±47.45 –0.0420 0.6199 402.93±44.05 –0.0361 0.7000 >36 to 60 33 407.7±48.1 431.81±48.19* –0.0633 0.5881 403.46±51.67 0.0092 0.7149 >60 45 411.0±37.9 434.66±46.82* –0.0588 0.5409 421.53±43.24* –0.0271 0.5568
Total 134 366.0±80.0 380.03±95.03* –0.0333 0.8660 373.11±81.28* –0.0259 0.8250
n - number of animals; MPE - mean predicted error; R² - coefficient of determination. * Significant difference under the paired test (P<0.05).
For non-pregnant females:
Adapted method B – BW (kg) = CG³ × 72;
Adapted method C – BW (kg) = [(HG2 × BL) /10978].
For pregnant mares:
Adapted method B – BW (kg) = CG³ × 63;
Adapted method C – BW (kg) = [(HG2 × BL) /10658].
The weights estimated by method E were different from the scale weights for the whole sample studied (Table 4). On the other hand, within sex class and age, method E estimated weights similarly to the scale weight, demonstrating a good estimating capacity for 6-36-month-old males and females between six and 60 months 6-36-month-old. Weights estimated by method D were similar to the scale weights for all male classes. Amongst age classes, method D estimations were different from the scale weights only in 6-12- and <36-60-month-old males (Table 4).
For pregnant mares, method D was accurate only in the initial third of gestation (Table 5).
Discussion
The results observed with the different tape positions indicate that method A is more precise in males than in
females, a possible effect of sexual dimorphism. Ellis and Hollands (2002) also reported that the tapes may over- or underestimate horse weights, but were able to improve their method by developing a specific tape which considered the different equine sizes (withers height above or below 152 cm).
In the whole sample, all three tape positions underestimated the scale weights for males and super estimated it for females. Compared with the scale weights, the estimated overall weight means in positions 1 and 2 differed in −7.5 kg for males and 7.4 kg for females. Working with 20 breeds, Wagner and Tyler (2011) observed a greater difference (65.81 kg) between position 1 estimates and the overall scale weight means. Thus, for 6-12-month-old females, positions 1 and 2 efficiently estimated body weights.
A similar pattern to that of saddle-type classification was observed for DTI, which decreased in males and females in relation to the scale weight. These results are different from those reported by Cabral et al. (2004), studying 98 MM horses, and concluded that females were lighter as fillies, but became average size with age, as observed in males. This variation in animal frame may have altered Table 5 - Mean scale, tape-, formula- and table-estimated weights, and standard deviations of pregnant Mangalarga Marchador mares
Pregnancy
stage (months) n Scale weight (kg)
Commercial tape (kg) - method A
Position 1 Position 2 Position 3
Estimated weight
(kg) MPE R² Estimated weight (kg) MPE R² Estimated weight (kg) MPE R² ≤ 5 9 381.00±31.30 400.55±31.46 –0.0539 0.3875 394.88±32.10 –0.0383 0.5090 472.66±57.20* –0.2419 0.3164 > 5 to 8 43 393.72±41.01 404.74±43.51* –0.0294 0.7289 406.32±41.43* –0.0341 0.6941 489.52±52.76* –0.2516 0.0254 > 8 to 11 38 398.47±40.63 402.28±45.11 –0.0100 0.7529 404.42±45.18 –0.0153 0.7730 505.55±51.11* –0.2705 0.7271 Total 90 394.45±39.92 403.28±42.78* –0.0237 0.7076 404.37±41.98* –0.0266 0.7138 494.66±52.97* –0.2587 0.1543
Mathematical formula
Crevat and Quetelet1 - method B Hall2 - method C
Estimated weight
(kg) MPE R² Estimated weight (kg) MPE R²
≤ 5 9 381.00±31.30 476.17±65.81* –0.2505 0.2943 354.35±33.46* 0.0681 0.3455
> 5 to 8 43 393.72±41.01 508.93±81.98* –0.2905 0.5661 354.67±37.60* 0.0983 0.8071
> 8 to 11 38 398.47±40.63 516.35±61.69* –0.2956 0.7434 350.74±40.57* 0.1198 0.7757
Total 90 394.45±39.92 508.79±72.63* –0.2886 0.6022 352.98±38.15* 0.1043 0.7356
Weight table
Hintz and Griffiths3 - method D Santos et al.4 - method E Estimated weight
(kg) MPE R² Estimated weight (kg) MPE R²
≤ 5 9 381.00±31.30 388.33±32.50 –0.1257 0.5281 428.67±56.96* –0.0208 0.3260
> 5 to 8 43 393.72±41.01 417.64±49.40* –0.1397 0.6312 445.93±51.62* –0.0619 0.0279
> 8 to 11 38 398.47±40.63 447.31±50.72* –0.1547 0.6087 459.90±51.38* –0.1241 0.7445
Total 90 394.45±39.92 427.24±51.82* –0.0840 0.5872 450.15±52.37* –0.1447 0.172
n - number of animals; MPE - mean predicted error; R² - coefficient of determination. * Significant difference under the paired test (P<0.05).
1 Formula proposed by Crevat and Quetelec (Cintra, 2013; Santos, 1981; Torres and Jardim, 1987; Marcenac and Aublet, 1964). 2 Formula proposed by Hall (Cintra, 2013; Wagner and Tyler, 2011; Carroll and Huntington, 1988; Ellis and Hollands, 1998). 3 Table proposed by Hintz and Griffiths (1984).
their live weight, since the morphological conformation of the animals used in the elaboration of this weighing tape was probably different from that of the animals studied in this experiment. However, there are no scientific data describing how these tapes were really conceived.
The way the tape was placed throughout the different ages, gestational stages, and genders affected the accuracy
of the method. These effects were also observed by
García Neder et al. (2009), in which body weight was influenced by internal and external factors such as gender, age, gestation, body condition, breed, and environmental conditions.
Mean body weights were underestimated by Hall’s formula and overestimated by Crevat and Quetelet’s formula. Therefore, these formulas resulted in estimations deviating more than 15% from the actual weights, which is not acceptable, according to Milner and Helwitt (1969). These authors observed mean deviations of up to 10% from the actual scale weights by Crevat and Quetelet’s estimations, suggesting that this deviation may be related to the fact that only the thoracic perimeter was used as the basis for the calculations. Thus, these methods should not be recommended to be used in the MM breed.
Similarly, Wagner and Tyler (2011), testing Hall’s formula (1971), also observed differences (17.25 kg) between the estimated and the scale weights, suggesting that the denominator currently used in this equation needs further studies to evaluate its repeatability and precision. Contrastingly, Ellis and Hollands (2002) and García Neder et al. (2009) reported that the Hall’s formula was the most efficient and precise (98.6% accurate in relation to the scale weight) among the methods studied. These divergences between the current study and other publications demonstrate that it is necessary to establish, with more details, the factors that directly or indirectly affect the accuracy of the current equine weight estimation methods.
The differences in the values between males and females observed in the corrected formulas are related to the species sexual dimorphism. As for non-pregnant and pregnant mares, the corrected formula value differences were due to the fact that the latter were embryo recipients and the former were ring show mares subjected to very distinct overall management.
Aiming to improve the accuracy in weaned foals, a specific formula for foals up to 12 months old, proposed by Cintra (2013), was tested. Body weight was underestimated by this formula, which is not indicated for weaned foals of the MM breed (Table 6). Nutrition, sanitary conditions, and post-weaning stress may explain the variations in the method proposed by Cintra (2013).
Additionally, as before, the differences observed between the mathematical formula estimations and scale weights may be explained by differences between the conformation of exotic breeds, for which they were developed originally, and the MM breed.
The values calculated for the mean predicted error (MPE) by the two weight tables exhibited the same estimating pattern as the tape on positions 1 and 2, when the estimated weights for males underestimated the real weight and overestimated the actual weight in females. However, the error values in method E are much lower than those observed in the literature, suggesting that both tables showed good precision for MM equines.
In pregnant mares, method D was accurate only in the initial third of gestation, when the effect of the growing fetus does not yet affect the conformation of mares significantly. Such differences may also be related to the fact that Hintz and Griffiths’ table is not adjusted for the breed tested.
The table by Santos et al. (2008) was developed for Pantaneiro horses (a native breed from central Brazil) and, according to McManus et al. (2008), has its origin in the Lusitano, Celtic, Barbo, and Andaluz breeds, similar to the MM breed. Perhaps, for this reason, this estimation method is efficient for this breed and because, according to Silva et al. (2012), there is a significant genetic proximity between the breed originally used to elaborate this method and the MM breed.
Conclusions
Tape positions 1 and 2 in method A and method E may be used to estimate the body weight of males and
females of the Mangalarga Marchador breed.For pregnant
mares, tape positions 1 and 2 in method A may be used in the initial and final third of gestation. For foals and weaned fillies, tape position 2 in method A is the most accurate. Of the alternative methods, tape position 2 in method A is the
Gender n Scale weight (kg)
Estimated weight (kg) Mathematical formula Cintra1 - method F MPE R² Males 16 220.9±29.2 156.16±11.83* 0.2864 0.5927 Females 20 217.0±34.1 156.71±11.59* 0.2643 0.7492 Table 6 - Mean (standard deviations) scale and Cintra’s
formula-estimated live body weights of weaned Mangalarga Marchador foals and fillies
n - number of animals; MPE - mean predicted error; R² - coefficient of determination.
most accurate for all age classes and gestational periods in both genetic groups. To use methods B and C, correction factors are necessary to precisely estimate the body weights in the Mangalarga Marchador breed.
Acknowlegments
The authors thank the veterinarian José Carlos Magalhães of the Associação Brasileira dos Criadores do Cavalo Pampa; animal Scientist Hans Norremose and Stud Haras El Far (Lavras, Minas Gerais, Brazil); Núcleo de Estudos em Equideocultura da Universidade Federal de Lavras (www.nequi.com.br); Fundação de Amparo à Pesquisa do Estado de Minas Gerais (FAPEMIG); and Conselho Nacional de Desenvolvimento Científico e Tecnológico (CNPq).
References
Cabral, G. C.; Almeida, F. Q.; Quirino, C. R.; Azevedo, P. C. N.; Pinto, L. F. B. and Santos, E. M. 2004. Avaliação morfométrica de equinos da raça Mangalarga Marchador: Índices de conformação e proporções corporais. Revista Brasileira de Zootecnia 33:1798-1805.
Carroll, C. L. and Huntington, P. J. 1988. Body condition scoring and weight estimation of horses. Equine Veterinary Journal 20:41-45. Cintra, A. G. C. 2013. O cavalo: características, manejo e alimentação.
Roca, São Paulo.
Ellis, J. M. and Hollands, T. 1998. Accuracy of different methods of estimating the weight of horses. Veterinary Record 143:335-336. Ellis, J. M. and Hollands, T. 2002. Use of height-specific weigh
tapes to estimate the bodyweight of horses. The Veterinary Record 150:632-634.
García Neder, A.; Perez, A. and Perrone, G. 2009. Estimación del peso corporal del caballo Criollo mediante medidas morfométricas: validación de ecuaciones publicadas para otras razas Y desarrollo de nueva formula. Revista Electrónica de Veterinaria 10:1-8. Hall, L. W. 1971. Wright’s veterinary anaesthesia and analgesia.
Baillière Tindall, London.
Hintz, H. F. and Griffiths, C. 1984. Estimates of body weight. Morgan Horse Journal 44:120.
Hoffmann, G.; Bentke, A.; Meierhöfer, S. R.; Ammon, C.; Mazetti, P. and Hardarson, G. H. 2013. Estimation of the body weight of Icelandic horses. Journal of Equine Veterinary Science 33:893-895.
Lima, R. A. S. and Cintra, A. G. 2015. Revisão do Estudo do complexo agronegócio do cavalo. Câmara de equideocultura do Ministério da Agricultura Pecuária e Abastecimento. Available at: <http://www. agricultura.gov.br/Equideocultura/revisao-estudo-agronegocio-cavalos%20(1).pdf>. Accessed on: May 5, 2016.
Marcenac, L. N. and Aublet, H. 1964. Encyclopedie du cheval. Maloine, Paris.
Milner, J. and Hewitt, D. 1969. Weight of horses: improved estimates based on girth and length. Canadian Veterinary Journal 10:314-316. McManus, C. M.; Santos, S. A.; Silva, J. A.; Louvandini, H.; Abreu,
U. G. P.; Sereno, J. R. B. and Mariante, A. S. 2008. Body indices of the pantaneiro horses. Brazilian Journal of Veterinary Research and Animal Science 45:362-370.
Pinto, L. F. B.; Almeida, F. Q.; Quirino, C. R.; Cabral, G. C.; Azevedo, P. C. N. and Santos, E. M. 2005. Análise multivariada das medidas morfométricas de potros da raça Mangalarga Marchador: Análise discriminante. Revista Brasileira de Zootecnia 34:600-612. Santiago, J. M.; Rezende, A. S. C.; Fonseca, M. G.; Abrantes, R. G. P.;
Lage, J. and Lana, A. M. Q. 2013. Comparação entre as medidas morfométricas do rebanho atual de machos Mangalarga Marchador e dos campeões da raça. Boletim de Indústria Animal 70:46-52. Santiago, J. M.; Rezende, A. S. C.; Lana, A. M. Q.; Fonseca, M. G.;
Abrantes, R. G. P.; Lage, J.; Andrade, J. M. and Resende, T. M. 2014. Comparação entre as medidas morfométricas do rebanho atual de fêmeas Mangalarga Marchador e das campeãs da raça. Revista Brasileira de Saúde e Produção Animal 15:141-148. Santiago, J. M.; Rezende, A. S. C.; Lana, A. M. Q.; Fonseca, M. G.
and Lage, J. 2016. Evolution of morphometric measures in the Mangalarga Marchador breed. Revista Caatinga 29:191-199. Santos, R. F. 1981. O cavalo de sela brasileiro e outros equídeos.
J. M. Varela Editores, Botucatu.
Santos, S. A.; Souza, G. S. and Abreu, U. G. P. 2008. Como estimar o peso do seu cavalo Pantaneiro. Ministério da Agricultura, Pecuária e Abastecimento, Embrapa Pantanal, Corumbá.
Santos, S. A.; Souza, G. S.; Abreu, U. G. P.; McManus, C. M. and Comastri Filho, J. A. 2007. Monitoramento do desenvolvimento de cavalos pantaneiros por meio de curvas de crescimento. Archivos de Zootecnia 56(Sup. 1):648.
Silva, A. C. M.; Paiva, S. R.; Albuquerque, M. S. M.; Egito, A. A.; Santos, S. A.; Lima, F. C.; Castro, S. T.; Mariante, A. S.; Correa, P. S. and McManus, C. M. 2012. Genetic variability in local Brazilian horse lines using microsatellite markers. Genetics and Molecular Research 2:881-890.
Torres, A. P. and Jardim, W. R. 1987. Criação do cavalo e outros equinos. 3 ed. Nobel, São Paulo.
Wagner, E. L.; Tyler, P. J. and Bruce, A. M. 2009. Body weight estimation: Which measurement to use? University, Auburn, AL, USA. Abstracts 29:416-417.