PUTATIVE METABOLIC PATHWAY OF
MANNITOL AND SORBITOL IN SUGARCANE
Celso Luís Marino*;Susi Meire Maximino Leite; Ana Paula Cazerta Farro; Flávio Tetsuo Sassaki; Henrique Luis Veronezi de Campos; Virgínia Elias Coscrato
UNESP/IV - Depto. de Genética, C.P. 510 - 18618-000, Botucatu, SP - Brasil. * Corresponding author <[email protected]>
ABSTRACT: Until the mid 1950s, boron was believed to play an important role in the transport of sugars in plants. However, boron actually depends on sugar alcohols to be taken up by the plant. In some cases, the main sugars involved in this process are sorbitol and mannitol which form stable complexes with boron. In this study, the sequences of the SugarCane EST Genome Project (SUCEST) database were searched for enzymes involved in the metabolism of these sugars by comparing them with enzymes from other organisms. Eighteen contigs from sugarcane (Saccharum sp.) presented high similarity with 11 enzymes involved in the putative biosynthetic pathway of sorbitol and mannitol from fructose in sugarcane. Seven of these contigs had high homology with sequences deposited in GenBank.
Key words: boron, expressed sequence tags (ESTs), polyols, sugar alcohol
PROVÁVEL VIA METABÓLICA DE MANITOL E SORBITOL
EM CANA-DE-AÇÚCAR
RESUMO: Até meados da década de 50 acreditava-se que o boro tinha uma importante função no transporte de açúcares em plantas. Na verdade, o boro depende de açúcares álcoois para serem mobilizados dentro da planta. Em alguns organismos os principais açúcares envolvidos neste processo são o sorbitol e o manitol, que formam complexos estáveis com o micronutriente. O objetivo deste estudo foi procurar seqüências no banco de dados SugarCane EST Genome Project (SUCEST) que codificam enzimas participantes na via metabólica destes açúcares através da comparação de enzimas de outros organismos. Dezoito “contigs” de cana-de-açúcar (Saccharum sp.) apresentaram similaridade com onze seqüências de enzimas que compõem a provável via metabólica de sorbitol e manitol a partir de frutose. Destes “contigs”, sete apresentaram uma alta similaridade entre as seqüências depositadas no GenBank.
Palavras-chave: boro, polióis, seqüências alvos expressas (ESTs), açúcares-álcoois
INTROTUCTION
Carbohydrate chemistry has seen many advances in the last decades. Up to 1953, only four amino sugars had been identified. Almost 20 years later, about 50 amino sugars were known (Sharon, 1975). The current interest in carbohydrate chemistry is not surprising con-sidering their importance in most aspects of the environ-ment.
Polyols are reduced forms of ketoses that occur in more than 100 species of plants (Stoop et al., 1996). Derivatives of sorbitol and mannitol are the most com-mon polyols. Bieleski (1982) estimated that up to 30% of the carbon fixed by plants is in the form of polyols. The occurrence of phloem mobile, boron-polyol com-plexes provides a mechanistic explanation for the phloem mobility of boron, observed in celery and peach. Polyols are also important in other Prunus, Malus and Pyrus spe-cies, as well as in members of the Apiaceae, Oleaceae and Celestraceae families (Brown & Shelp, 1997).
Recent work has located a gene - BOR1 - in Arabidopsis thaliana that codifies a boron transporter en-zyme thus providing a molecular basis for the active trans-port of this element in higher plants (Takano et al., 2002). Boron is a member of the metalloid group of elements, which also includes silicon and germanium. These ele-ments show intermediate properties between metal and nonmetals. The role of boron in plant nutrition is still the least understood of all the mineral nutrients, but is be-lieved to be involved in several processes, including sugar transport, cell wall synthesis, lignification, cell wall struc-ture, carbohydrate metabolism, RNA metabolism, respi-ration, metabolism of indole acetic acid (AIA), phenol metabolism, and membrane stability. This indicates that boron is probably involved in a number of metabolic pathways, or may have a “cascade effect”, similar to phy-tohormones (Marshner, 1995).
stable boron:sorbitol complexes (1:2 ratio) as a result of the favorable zigzag arrangement of the 2-, 3-, and 4-hy-droxyls. The stability of these sorbitol complexes exceeds that of the 3, 4, 3’, 4’ mannitol complex (Makkee et al., 1985; Nose & Zenki, 1991). At the high sugar:boron ra-tios found in high sorbitol genera (Pyrus, Malus, Prunus), more than 99% of boron occurs in 1:2 complexes. Hu et al. (1997) used matrix-assisted, laser desorption/Fourier transform mass spectrometry to identify the 3,4-manni-tol-boron-3’, 4’-mannitol complex in the phloem sap of celery, as well as similar sorbitol and fructose complexes in the extrafloral nectar of peach.
The objective of this work was to use the SUCEST database to identify orthologous sugarcane genes that could codify enzymes involved in the metabo-lism of sorbitol and mannitol.
MATERIAL AND METHODS
Enzyme detection
The Metabolic Pathways link at http:// www.genome.ad.jp/kegg/kegg2.html was used to search for enzymes involved in the metabolism of sorbitol and mannitol. Enzymes found occurred in five pathways: gly-colysis (MAP00010), the pentose phosphate cycle (MAP00030), starch and sucrose metabolism (MAP00500), fructose and mannose metabolism (MAP00051), and galactose metabolism (MAP00052). The Expasy database (http://www.expasy.ch) from the link Swiss-Prot was used to identify the catalytic activity of the enzymes and the organism with the lowest e-value from the compared sequences. Additional information was obtained from the PubMed database (http:// www.ncbi.nlm.nih.gov/).
Identification of sugarcane cluster consensi
Sugarcane EST cluster consensi were identified using the basic local alignment search tool (tBLASTn) (Altschul et al., 1990). Sugarcane reads related to the metabolism of mannitol and sorbitol were annotated us-ing the minimum criteria of e-value < -70 and identity > 60%. The contigs identified were represented using the nomenclature created by SUCEST. The 5th
and 6th
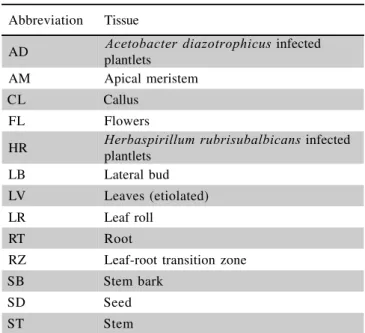
letters in the identified contigs determined the tissue used in the construction of the libraries, e.g., RT for root (Table 1). For more details see http://sucest.lad.dcc.unicamp.br/en.
Data normalization
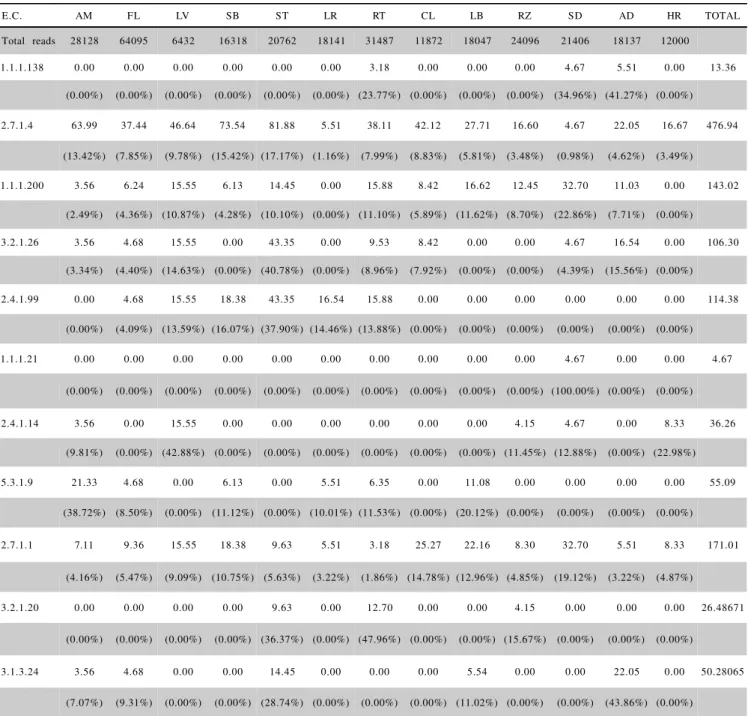
The frequencies of reads for each tissue in the se-lected contigs were computed and normalized for each enzyme. The total number of corresponding reads for each enzyme of a specific library was divided by the total num-ber of reads for this same library, and then multiplied by 100,000(Table 3).
RESULTS AND DISCUSSION
Search for orthologous genes
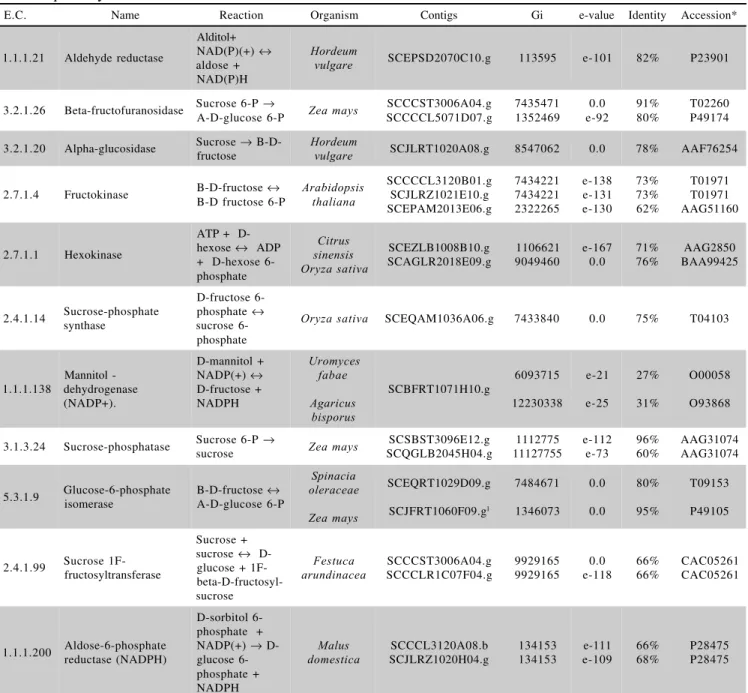
The SUCEST database (http://sucest.lad. dcc.unicamp.br/en) was mined for sugarcane gene prod-ucts potentially involved in the metabolism of sorbitol and mannitol. Eleven enzymes were identified and 18 corre-sponding contigs were annotated (Table 2). The search-ing criteria (e-value and identity) allowed the annotation of only a few contigs per enzyme. However, these contigs presented high levels of similarity. In 84% of the cases, the e-value was less than –100, whereas in 37% of the cases it was 0.0 (Table 2).
During the search, the level of similarity to mi-croorganism genes was frequently low. This could explain the high e-value observed for the enzyme mannitol de-hydrogenase, which was not found in higher organisms. Although the e-values for this enzyme were very high, the enzyme must be present in sugarcane since polyol mannitol has been detected in fresh sugarcane leaves at a concentration of 0.02 mol L-1 using high performance anion exchange-pulse amperometric detection (HPAE-PAD) at COPERSUCAR1; sorbitol has also been detected at a concentration of 0.04 mol L-1
. The highest levels of identity were observed with genes from maize (Zea mays), also a gramineous plant (Table 2).
Out the 11 enzymes annotated, aldehyde reduc-tase and mannitol dehydrogenase showed a single contig represented by only one read. The single read in aldehyde reductase could be related to a sugarcane database rep-resentation or to a higher gene expression in seedlings
1Eugênio C. Ulian - Personal communication, Copersucar, Piracicaba, SP, Brazil.
Table 1 - Tissues used to construct the SUCEST libraries and their abbreviations.
Abbreviation Tissue
AD Acetobacter diazotrophicus infected
plantlets
AM Apical meristem
CL Callus
FL Flowers
HR Herbaspirillum rubrisubalbicans infected
plantlets
LB Lateral bud
LV Leaves (etiolated)
LR Leaf roll
RT Root
RZ Leaf-root transition zone
SB Stem bark
SD Seed
in relation to isolated tissues, since the read was found only in the first case. In the case of mannitol dehydroge-nase, the read was identified in the root. An explanation for this could be that the level of mannitol is so low that it could not be detected in the sugarcane database (SUCEST). In the remaining enzymes, the contigs were formed by reads from more than one type of tissue. Three contigs were annotated for fructokinase. One of these had 96 reads which may indicate that this enzyme figured was the most abundant (Figure 1).
All of the 13 tissues used to construct the differ-ent SUCEST libraries contain sugarcane sequences re-lated to the examined metabolic pathway. The
contribu-E.C. Name Reaction Organism Contigs Gi e-value Identity Accession*
1.1.1.21 Aldehyde reductase
Alditol+ NAD(P)(+) ↔ aldose + NAD(P)H
Hordeum
vulgare SCEPSD2070C10.g 113595 e-101 82% P23901
3.2.1.26 Beta-fructofuranosidase Sucrose 6-P →
A-D-glucose 6-P Zea mays
SCCCST3006A04.g SCCCCL5071D07.g 7435471 1352469 0.0 e-92 91% 80% T02260 P49174 3.2.1.20 Alpha-glucosidase Sucrose →
B-D-fructose
Hordeum
vulgare SCJLRT1020A08.g 8547062 0.0 78% AAF76254
2.7.1.4 Fructokinase B-D-fructose ↔ B-D fructose 6-P
Arabidopsis thaliana SCCCCL3120B01.g SCJLRZ1021E10.g SCEPAM2013E06.g 7434221 7434221 2322265 e-138 e-131 e-130 73% 73% 62% T01971 T01971 AAG51160 2.7.1.1 Hexokinase
ATP + D-hexose ↔ ADP + D-hexose 6-phosphate Citrus sinensis Oryza sativa SCEZLB1008B10.g SCAGLR2018E09.g 1106621 9049460 e-167 0.0 71% 76% AAG2850 BAA99425 2.4.1.14 Sucrose-phosphate synthase D-fructose 6-phosphate ↔ sucrose 6-phosphate
Oryza sativa SCEQAM1036A06.g 7433840 0.0 75% T04103
1.1.1.138
Mannitol -dehydrogenase (NADP+).
D-mannitol + NADP(+) ↔ D-fructose + NADPH Uromyces fabae Agaricus bisporus SCBFRT1071H10.g 6093715 12230338 e-21 e-25 27% 31% O00058 O93868
3.1.3.24 Sucrose-phosphatase Sucrose 6-P →
sucrose Zea mays
SCSBST3096E12.g SCQGLB2045H04.g 1112775 11127755 e-112 e-73 96% 60% AAG31074 AAG31074 5.3.1.9 Glucose-6-phosphate isomerase
B-D-fructose ↔ A-D-glucose 6-P Spinacia oleraceae Zea mays SCEQRT1029D09.g SCJFRT1060F09.g1 7484671 1346073 0.0 0.0 80% 95% T09153 P49105
2.4.1.99 Sucrose 1F-fructosyltransferase
Sucrose + sucrose ↔ D-glucose + 1F- beta-D-fructosyl-sucrose Festuca arundinacea SCCCST3006A04.g SCCCLR1C07F04.g 9929165 9929165 0.0 e-118 66% 66% CAC05261 CAC05261 1.1.1.200 Aldose-6-phosphate reductase (NADPH) D-sorbitol 6-phosphate + NADP(+) → D-glucose 6-phosphate + NADPH Malus domestica SCCCL3120A08.b SCJLRZ1020H04.g 134153 134153 e-111 e-109 66% 68% P28475 P28475
Table 2 - Enzyme Code number, name, reaction catalyzed from enzymes and reads found in sugarcane related to the metabolic pathway of mannitol and sorbitol.
*Accession numbers are referent to the organisms searched at site http://www.ncbi.nlm.nih.gov/.
1Read without contig.
0 10 20 30 40 50 60 70 80 90 100
SCCCCL3120B01.gSCCCCL3120A08.bSCEQRT1029D09.gSCEZLB1008B10.gSCAGLR2018E09.gSCCCST3006A04.gSCSBST3096E12.gSCJLRT1020A08.gSCJLRZ1021E10.gSCCCCL5071D07.gSCEPAM2013E06.gSCEQAM1036A06.gSCCCLR1C07F04.gSCBFRT1071H10.gSCJLRZ1020H04.gSCQGLB2045H04.gSCJFRT1060F09.gSCEPSD2070C10.g
Contigs
Number of reads
tion of each tissue varied considerably in the selected contigs (Figure 2). A special case was contig “SCCCCL3120B01.g” which presented reads in all sues. Based on the normalized data for all contigs, tis-sues with the highest frequencies were LV (1.9), ST (1.01), CL (0.84) and SB (0.76), and tissues with the low-est frequencies were LR (0.22) and FL (0.12) (Figure 2). In species that translocate polyols, vegetative tissues such as petioles, stems, and roots may accumulate polyols, but there is no evidence that this occurs by direct synthesis rather than by simple import from the phloem (Madore, 1994).
Table 3 - Frequency and percentage of reads for each tissue in selected contigs. Data were normalized by dividing the total number of corresponding reads for each enzyme of a specific library by the total number of reads for this same library, and multiplying the resulting quotient by 100,000.
E.C. AM FL LV SB ST LR RT CL LB RZ SD AD HR TOTAL
Total reads 28128 64095 6432 16318 20762 18141 31487 11872 18047 24096 21406 18137 12000
1.1.1.138 0.00 0.00 0.00 0.00 0.00 0.00 3.18 0.00 0.00 0.00 4.67 5.51 0.00 13.36
(0.00%) (0.00%) (0.00%) (0.00%) (0.00%) (0.00%) (23.77%) (0.00%) (0.00%) (0.00%) (34.96%) (41.27%) (0.00%)
2.7.1.4 63.99 37.44 46.64 73.54 81.88 5.51 38.11 42.12 27.71 16.60 4.67 22.05 16.67 476.94
(13.42%) (7.85%) (9.78%) (15.42%) (17.17%) (1.16%) (7.99%) (8.83%) (5.81%) (3.48%) (0.98%) (4.62%) (3.49%)
1.1.1.200 3.56 6.24 15.55 6.13 14.45 0.00 15.88 8.42 16.62 12.45 32.70 11.03 0.00 143.02
(2.49%) (4.36%) (10.87%) (4.28%) (10.10%) (0.00%) (11.10%) (5.89%) (11.62%) (8.70%) (22.86%) (7.71%) (0.00%)
3.2.1.26 3.56 4.68 15.55 0.00 43.35 0.00 9.53 8.42 0.00 0.00 4.67 16.54 0.00 106.30
(3.34%) (4.40%) (14.63%) (0.00%) (40.78%) (0.00%) (8.96%) (7.92%) (0.00%) (0.00%) (4.39%) (15.56%) (0.00%)
2.4.1.99 0.00 4.68 15.55 18.38 43.35 16.54 15.88 0.00 0.00 0.00 0.00 0.00 0.00 114.38
(0.00%) (4.09%) (13.59%) (16.07%) (37.90%) (14.46%) (13.88%) (0.00%) (0.00%) (0.00%) (0.00%) (0.00%) (0.00%)
1.1.1.21 0.00 0.00 0.00 0.00 0.00 0.00 0.00 0.00 0.00 0.00 4.67 0.00 0.00 4.67
(0.00%) (0.00%) (0.00%) (0.00%) (0.00%) (0.00%) (0.00%) (0.00%) (0.00%) (0.00%) (100.00%) (0.00%) (0.00%)
2.4.1.14 3.56 0.00 15.55 0.00 0.00 0.00 0.00 0.00 0.00 4.15 4.67 0.00 8.33 36.26
(9.81%) (0.00%) (42.88%) (0.00%) (0.00%) (0.00%) (0.00%) (0.00%) (0.00%) (11.45%) (12.88%) (0.00%) (22.98%)
5.3.1.9 21.33 4.68 0.00 6.13 0.00 5.51 6.35 0.00 11.08 0.00 0.00 0.00 0.00 55.09
(38.72%) (8.50%) (0.00%) (11.12%) (0.00%) (10.01%) (11.53%) (0.00%) (20.12%) (0.00%) (0.00%) (0.00%) (0.00%)
2.7.1.1 7.11 9.36 15.55 18.38 9.63 5.51 3.18 25.27 22.16 8.30 32.70 5.51 8.33 171.01
(4.16%) (5.47%) (9.09%) (10.75%) (5.63%) (3.22%) (1.86%) (14.78%) (12.96%) (4.85%) (19.12%) (3.22%) (4.87%)
3.2.1.20 0.00 0.00 0.00 0.00 9.63 0.00 12.70 0.00 0.00 4.15 0.00 0.00 0.00 26.48671
(0.00%) (0.00%) (0.00%) (0.00%) (36.37%) (0.00%) (47.96%) (0.00%) (0.00%) (15.67%) (0.00%) (0.00%) (0.00%)
3.1.3.24 3.56 4.68 0.00 0.00 14.45 0.00 0.00 0.00 5.54 0.00 0.00 22.05 0.00 50.28065
(7.07%) (9.31%) (0.00%) (0.00%) (28.74%) (0.00%) (0.00%) (0.00%) (11.02%) (0.00%) (0.00%) (43.86%) (0.00%)
0 0,5 1 1,5 2
LV ST CL SB LB AD SD AM RT HR RZ LR FL
Tissues
Relative abundance of ESTs
The enzyme (mannitol dehydrogenase) 1.1.1.138 was detected inroot (RT), seed (SD) and in Acetobacter diazotrophicus infected plantlets (AD) (Table 3). The presence of this enzyme in AD could possibly explain the correlation between mannitol levels and the occurrence of a pathogen resistance gene (Yamamoto et al., 1997).
Aldehyde reductase (E.C. 1.1.1.21), which con-verts aD-glucose to D-sorbitol and vice versa, shared similarity with only one contig which had a unique read found in seed (Table 3). Although sink tissues, such as seeds, may contain polyols, these are usually only trace components and not the major carbohydrates (Madore, 1994). Comparison of the relative abundance of the genes identified in the different libraries, indicated that all were present mainly in the stem (ST), leaves (LV), callus (CL) and stem bark (SB), tissues in which boron is required for the formation and elongation of cell wall membrane stability (Shelp, 1993).
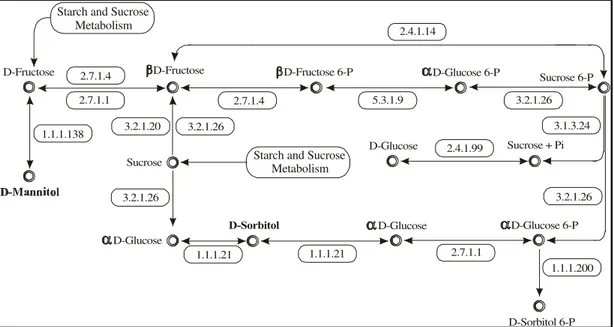
Construction of the metabolic pathway
The biosynthetic pathway of mannitol and sorbi-tol is closely related to that of other sugars such as fruc-tose, glucose and sucrose, and depends on some impor-tant enzymes. The first stable product of the photosyn-thetic process is triose phosphate, which is the immedi-ate precursor of all carbohydrimmedi-ates and is synthesized in the source leaves. Other sugars, including polyols such as mannitol and sorbitol, are subsequently derived from triose phosphate.
Based on the putative plant homologues identi-fied in the set of sugarcane ESTs used (Table 3), it was possible to construct a putative biosynthetic pathway for sorbitol and mannitol from fructose (Figure 3). This path-way was constructed based on sugarcane contigs that shared significant sequence similarity to known enzymes
Figure 3 - Putative metabolic pathway for the synthesis of mannitol and sorbitol from fructose in sugarcane.
D-Fructose
1.1.1.138 2.7.1.4
2.7.1.1
D-Fructose
3.2.1.20 3.2.1.26
Sucrose
D-Glucose 3.2.1.26
1.1.1.21 2.7.1.4
D-Fructose 6-P
5.3.1.9 3.2.1.26
D-Glucose 6-P Sucrose 6-P
Sucrose + Pi
D-Glucose 6-P
D-Sorbitol 6-P D-Glucose
D-Sorbitol
2.4.1.99 D-Glucose
3.1.3.24
3.2.1.26
1.1.1.200 2.7.1.1
1.1.1.21
2.4.1.14
Starch and Sucrose Metabolism Starch and Sucrose
Metabolism
and had low e-value levels. With the use of less strict cri-teria, this pathway could be expanded.
New searches will be carried out aiming to ex-pand this putative metabolic pathway. For that, searches for contigs related to other steps and ramifications of this proposed metabolic pathway will be made. Functional genomic studies to confirm the expression of the enzymes included in the putative biosynthetic pathway of manni-tol and sorbimanni-tol, as well as biochemical studies to show that the enzymes are active in hybrids of the Saccharum complex, are now required.
ACKNOWLEDGEMENTS
To FAPESP for financial support and Dr. Ivan de Godoy Maia for help during this study.
REFERENCES
ALTSCHUL, S.F.; GISH, M.; MILLER, W.; MYERS, E.W.; LIPMAN, E.J. Basic local alignment search tool. Journal of Molecular Biology, v.215, p.403-410, 1990.
BIELESKI, R.L. Sugar alcohols. In: LOEWUS, F.A.; TANNER, W. (Ed.)
Encyclopedia of plant physiology. New York: Springer-Verlag, 1982.
v.13A, p.158-192.
BROWN, P.; HU, H. Phloem mobility of boron is species dependent: evidence for phloem mobility in sorbitol-rich species. Annals of Botany,
v.77, p.497-505, 1996.
BROWN, P.; SHELP, B.J. Boron mobility in plants. Plant and Soil, v.193, p.85-101, 1997.
HU, H.; PENN, S.G.; LEBRILLA, C.B.; BROWN, P.H. Isolation and characterization of soluble boron-complexes in higher plants: the mechanism of phloem mobility of boron. Plant Physiology, v.113, p.649-655, 1997. MADORE, M.A. Handbook of plant and crop physiology. In:
PESSARAKLI, M. (Ed.) Carbohydrate synthesis and crop
metabolism. New York: Marcel Dekker, 1994. cap.12, p.257-273.
MAKKEE, M.; KIEBOOM, A.P.G.; VAN BEKKUM, H. Studies on borate esters III. Borate esters of mannitol, glucitol, fructose and D-glucose in water. RecueildesTravaux des Chimique des Pays-Bas,
MARSHNER, H. Mineral nutrition of higher plants. 2.ed. San Diego: Academic Press, 1995. 889p.
NOSE, K.; ZENKI, M. Flow injection spectrophotometric determination of boron with D-sorbitol using methyl orange as an indicator. Analyst, v.116, p.711-714, 1991.
SHARON, N. Complex carbohydrates: their chemistry, biosynthesis and functions. Massachusetts: Addison Wesley, 1975. 466p.
SHELP, B.J. Physiology and biochemistry of boron in plants. In: GUPTA, U.C. (Ed.) Boron and its role in crops production. Boca Raton: CRC Press, 1993. cap.4, p.53-85.
STOOP, J.M.H.; WILLIAMSON, J.D.; PHARR, D.M. Mannitol metabolism in plants: a method for coping with stress. Trends in Plant Science,v.1, p.139-144, 1996.
TAKANO, J.; NOGUCHI, K.; YASUMORI, M.; KOBAYASHI, M.; GAJDOS, Z.; MIWA, K.; HAYASHI, H.; YONEYAMA, T.; FUJIWARA, T. Arabidopsis boron transporter for xylem loading. Nature, v.420, p.337-340, 2002.
YAMAMOTO, Y.T.; ZAMSKI, E.; WILLIAMSON, J.D.; CONKLING, M.A.; PHARR, D.M. Subcellular localizationof celery mannitol dehydrogenase. A cytosolic metabolic enzyme in nuclei. Plant
Physiology, v.115, p.1397-1403, 1997.