ISSN 0104-6632 Printed in Brazil
www.abeq.org.br/bjche
Vol. 31, No. 04, pp. 1003 - 1011, October - December, 2014 dx.doi.org/10.1590/0104-6632.20140314s00002537
*To whom correspondence should be addressed
Brazilian Journal
of Chemical
Engineering
REMOVAL OF LACTOBIONIC ACID BY
ELECTRODIALYSIS
J. B. Severo Júnior
*, T. L. M. Alves and H. C. Ferraz
Programa de Engenharia Química/COPPE, Universidade Federal do Rio de Janeiro, Cidade Universitária, CP 68502, 21941-972, Rio de Janeiro - RJ, Brasil.
Phone: (55) (21) 25628343, Fax: (55) (21) 25628300 E-mail: [email protected]
(Submitted: February 11, 2013; Revised: September 16, 2013 ; Accepted: December 2, 2013)
Abstract - Lactobionic acid has a number of applications, such as in cosmetic formulations and detergents, as well as in the medical field, where it is used for the preservation of organs destined for transplantation. Previous studies have reported that a promising alternative procedure for the production of lactobionic acid is the biotechnological route, using permeabilized cells of Zymomonas mobilis to produce sorbitol and lactobionic acid from fructose and lactose. However, the acid produced during the process accumulates in the reaction medium, causing enzyme deactivation. It was found that this problem can be avoided by coupling an electrodialysis unit to the reaction vessel, resulting in efficient removal of the acid from the reaction medium and improved the stability of the enzyme. These tests employed a synthetic mixture containing lactobionic acid, sorbitol, lactose, and fructose, and a factorial design was performed to identify the most influential variables. The NaCl concentration in the concentrate stream, together with the potential difference, exerted the greatest effects on the rate of removal of lactobionic acid. In all experiments, the removal efficiency exceeded 95%. The best conditions for the system investigated were a potential of 60 V, and NaCl concentrations of 3 and 25 g L-1 in the concentrate stream and the electrode compartment, respectively.
Keywords: Electrodialysis; Zymomonas mobilis; Lactobionic acid; Experimental design.
INTRODUCTION
The use of lactobionic acid in cosmetic formula-tions is already established. Another potential appli-cation based on its biodegradability and lack of tox-icity is the use in the manufacture of substances with surfactant properties, such as detergents. Neverthe-less, the greatest commercial application is in the medical field, as the main constituent of fluid for organ preservation during the procedure of trans-plantation. Lactobionic acid is obtained industrially by dehydrogenation of the lactose using a metallic catalyst (Splechtna et al., 2001; Dhariwal et al., 2006; Paul and Patrick, 2009; Pedruzzi et al., 2011; Severo Júnior et al., 2011; Malvessi et al., 2013).
1004 J. B. Severo Júnior, T. L. M. Alves and H. C. Ferraz
Natural substrates of GFOR are fructose and glu-cose. However, the aldonic acid resulting from this catalysis is gluconic acid, which is a low market value product. Lactobionic acid, on the other hand, is much more valuable, rendering its production by Zymomonas mobilis very attractive (Jonas and Silveira, 2004).
Just as important as the synthesis step is the downstream processing, that can have an enormous impact on the product final price. Conventional sepa-ration techniques include precipitation, ion ex-change, among others. A more recent process is electrodialysis, which employs an electrical gradient to promote the separation of ionic species. In addi-tion to accomplishing separaaddi-tion without adding chemicals to the medium, electrodialysis allows the continuous separation of the ionic product, which can contribute to increased conversion and avoid enzyme inactivation by accumulation of product in the reaction medium (Furlinger et al., 1998; Ferraz et al., 2001).
Ferraz et al. (2001) evaluated the production and simultaneous separation of sorbitol and gluconic acid by an electrodialysis unit coupled to a membrane bioreactor containing permeabilized and immobi-lized cells of Zymomonas mobilis. The results pre-sented by these authors showed that the electrodialy-sis unit coupled to the bioreactor allowed an efficient removal of gluconic acid from the reaction medium,
as well as an improvement in the stability of the en-zyme, without reduction of the reaction rate, even after 60 hours of reaction. In addition, several studies reported in the literature show that this process offers considerable economic potential for the recovery and production of organic acids including citric acid, fumaric acid, and galacturonic acid (Novalic et al., 2000; Choi et al., 2002; Tongwen and Weihua, 2002; Bélafi-Bakó et al., 2004; Mólnar et al., 2009; Mólnar et al., 2010).
Thus, this work aims at evaluating the removal of lactobionic acid from synthetic mixtures containing sorbitol, lactose and fructose by electrodialysis, based on factorial design, to verify the feasibility of the in-tegration of this step with a bioreactor containing permeabilized cells of Zymomonas mobilis.
MATERIALS AND METHODS
The electrodialysis unit comprises 9 compart-ments of acrylic, separated by anionic and cationic exchange membranes alternately, with a total effec-tive area of 226.2 cm2, as shown in Figure 1; this unit was constructed in-house. The electrodialysis unit is composed of 4 pairs of cells, with 4 cationic exchange membranes (CR 67 HMR-412, Ionics) and 4 anionic exchange membranes (AR 204 SZRA-412, Ionics), placed alternately and 7 mm apart from each other.
F + L S + La
F L S Na+ Cl -Na+ Cl -+ - + - - + - + +
-F + L + S
La La La H+ La -F L S La -H+ F L S H+ La -1 2
3 5 7 9 11
2 12 12 13 14 Diluted stream 15
4 6 8 10
16
Font
(electric potential difference)
Product tank
Concentrate stream Feed tank
F + L S + La
F L S Na+ Cl -Na+ Cl -+ - + - - + - + +
-F + L + S
La La La H+ La -F L S La -H+ F L S H+ La -1 2
3 5 7 9 11
2 12 12 13 14 Diluted stream 15
4 6 8 10
16
Font
(electric potential difference)
Product tank
Concentrate stream
F + L S + La
F L S Na+ Cl -Na+ Cl -+ - + - - + - + +
-F + L + S
La La La H+ La -F L S La -H+ F L S H+ La -1 2
3 5 7 9 11
2 12 12 13 14 Diluted stream 15
4 6 8 10
16
Font
(electric potential difference)
Product tank
F + L S + La
F L S Na+ Cl -Na+ Cl -+ - + - - + - + +
-F + L + S
La La La H+ La -F L S La -H+ F L S H+ La -1 2
3 5 7 9 11
2 12 12 13 14 Diluted stream 15
4 6 8 10
16
Font
(electric potential difference)
F + L S + La
F L S Na+ Cl -Na+ Cl -+ - + - - + - + +
-F + L + S
La La La H+ La -F L S La -H+ F L S H+ La -1 2
3 5 7 9 11
2 12 12 13 14 Diluted stream 15
4 6 8 10
16
Font
(electric potential difference)
Product tank
Concentrate stream Feed tank
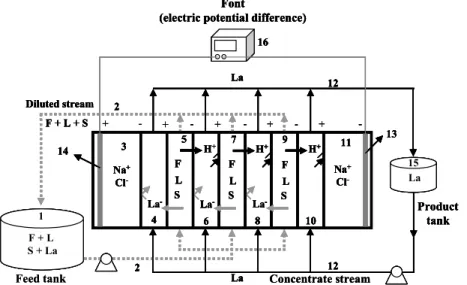
Figure 1: Schematic representation of the electrodialysis unit used in the
Brazilian Journal of Chemical Engineering Vol. 31, No. 04, pp. 1003 - 1011, October - December, 2014
According to Figure 1, the feed (1) containing the synthetic solution of fructose, lactose, sorbitol and lactobionic acid (total volume of 150 ml) was pumped into channels 5, 7 and 9. Because fructose, lactose and sorbitol have no electric charge, they are not attracted by the electrodes, coming out in the dilute stream (2), while the lactobionic ion and the hydro-gen ion permeate through the anion exchange mem-brane and through the cation exchange memmem-brane, respectively, towards compartments 4, 6, 8 and 10, coming out in the concentrated stream (12) and being collected in the tank (15). This separation occurs due to the electrical potential difference applied to the electrodialysis unit by carbon electrodes (13 and 14) using a continuous current power supply (16) from Instrutherm, model FA-3050.
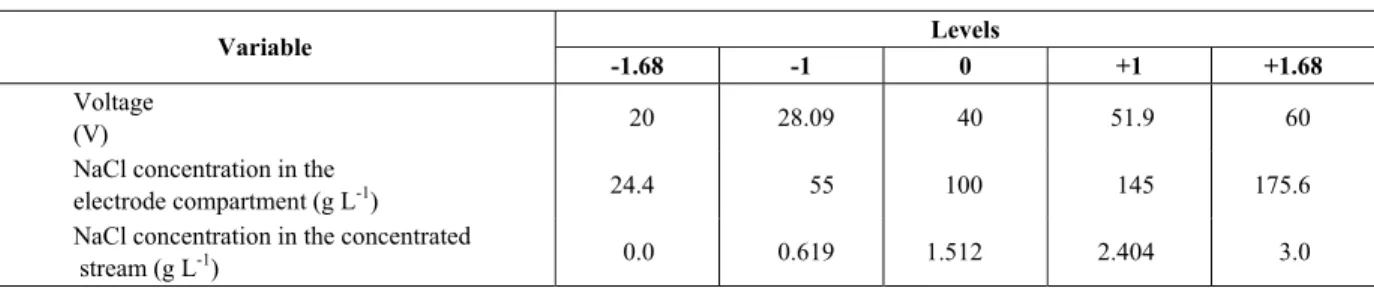
To evaluate the removal of lactobionic acid, a factorial design was employed having as independent variables the potential difference (or voltage), the NaCl concentration in the electrode compartment and in the concentrated stream. Table 1 shows the levels of the variables used. The voltage ranged from 20 V to 60 V. The use of voltages lower than 20 V is not efficient to remove the acid in this system. The limits of the others variables were chosen based on results obtained in preliminary tests.
A factorial design type 23 with 3 central points and 6 axial points was chosen, showed in Table 2, and the dependent variable was the specific re-moval rate of the lactobionic acid (g.min-1.m-2). Equations (1) to (3) represent the normalized variables,
norm
V (voltage), _
norm NaCl el
C (NaCl concentration in the
electrodes compartment), norm NaCl
C (NaCl concentration in the concentrated stream).
40 11.91
norm Voltage
V = − (1)
_ _
100 45 NaCl el norm
NaCl el C
C = − (2)
1.512 0.893
norm NaCl
NaCl
C
C = − (3)
All experiments were carried out at 30°C and at a flow rate of 20 l.h-1 using 150 ml of synthetic solu-tions of lactose (40 g L-1), fructose (20 g L-1), sorbi-tol (5 g L-1) and lactobionic acid (10 g L-1) (Sigma Aldrich, 99%, all the reagents). The lactobionic acid concentration was monitored indirectly by the feed conductivity (Quimis conductivimeter).
RESULTS AND DISCUSSION
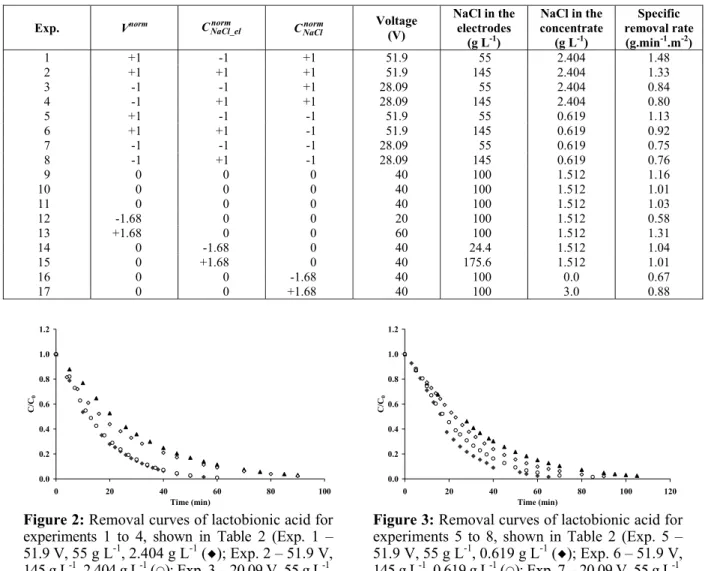
Figures 2 to 5 show the removal curves of lacto-bionic acid as a function of the time for all experi-ments performed. Table 2 shows the values of the specific removal rate of lactobionic acid, calculated from the derivative of the curves at 90% removal. The observed removal rates varied from 0.58 to 1.48 gacid.min-1.m-2, and in all experiments it was possible
to remove more than 95% of lactobionic acid in less than 2 hours. Figures 2 and 3 show experiments 1-4 and 5-8, respectively. In each set of experiments, the NaCl concentration in the concentrate stream was the same. The voltage and the NaCl concentration in the electrode compartment were changed. In both figures it can be observed that, as the voltage increases, the removal rate increases as well, indicating that the NaCl concentration in the electrode compartment does not exert a significant influence on the removal of lac-tobionic acid. Figure 4 shows the removal curves for the replicates at the central point, experiments 9-11, pointing out the good reproducibility of the data.
Table 1: Levels of the variables used in the experimental design in the electrodialysis unit.
Levels Variable
-1.68 -1 0 +1 +1.68
Voltage
(V) 20 28.09 40 51.9 60
NaCl concentration in the
electrode compartment (g L-1) 24.4 55 100 145 175.6
NaCl concentration in the concentrated
1006 J. B. Severo Júnior, T. L. M. Alves and H. C. Ferraz
Table 2: Design matrix for the experiments performed in the electrodialysis unit.
Exp. Vnorm
_
norm NaCl el
C norm
NaCl
C Voltage
(V)
NaCl in the electrodes
(g L-1)
NaCl in the concentrate
(g L-1)
Specific removal rate
(g.min-1.m-2)
1 +1 -1 +1 51.9 55 2.404 1.48
2 +1 +1 +1 51.9 145 2.404 1.33
3 -1 -1 +1 28.09 55 2.404 0.84
4 -1 +1 +1 28.09 145 2.404 0.80
5 +1 -1 -1 51.9 55 0.619 1.13
6 +1 +1 -1 51.9 145 0.619 0.92
7 -1 -1 -1 28.09 55 0.619 0.75
8 -1 +1 -1 28.09 145 0.619 0.76
9 0 0 0 40 100 1.512 1.16
10 0 0 0 40 100 1.512 1.01
11 0 0 0 40 100 1.512 1.03
12 -1.68 0 0 20 100 1.512 0.58
13 +1.68 0 0 60 100 1.512 1.31
14 0 -1.68 0 40 24.4 1.512 1.04
15 0 +1.68 0 40 175.6 1.512 1.01
16 0 0 -1.68 40 100 0.0 0.67
17 0 0 +1.68 40 100 3.0 0.88
0.0 0.2 0.4 0.6 0.8 1.0 1.2
0 20 40 60 80 100
Time (min)
C/
C0
0.0 0.2 0.4 0.6 0.8 1.0 1.2
0 20 40 60 80 100 120
Time (min)
C/
C0
Figure 2: Removal curves of lactobionic acid for
experiments 1 to 4, shown in Table 2 (Exp. 1 – 51.9 V, 55 g L-1, 2.404 g L-1 (¡); Exp. 2 – 51.9 V, 145 g L-1, 2.404 g L-1 ({); Exp. 3 – 20.09 V, 55 g L-1, 2.404 g L-1 (▲); Exp. 4 – 28.09 V, 145 g L-1, 2.404 g L-1 ()), where C is the actual concentra-tion and C0 the initial concentration.
Figure 3: Removal curves of lactobionic acid for
experiments 5 to 8, shown in Table 2 (Exp. 5 – 51.9 V, 55 g L-1, 0.619 g L-1 (¡); Exp. 6 – 51.9 V, 145 g L-1, 0.619 g L-1 ({); Exp. 7 – 20.09 V, 55 g L-1, 0.619 g L-1 (▲); Exp. 8 – 28.09 V, 145 g L-1, 0.619 g L-1 ()), where C is the actual concentration and C0 the initial concentration.
0.0 0.2 0.4 0.6 0.8 1.0 1.2
0 10 20 30 40 50 60 70 80 90 Time (min)
C/
C0
Figure 4: Removal curves of lactobionic acid for
Brazilian Journal of Chemical Engineering Vol. 31, No. 04, pp. 1003 - 1011, October - December, 2014
Figure 5 is related to the removal curves of the axial points of the experimental design. It is possible to observe the great influence of the voltage on acid removal as shown in experiments 12 and 13. With the increase of the voltage from 20 V to 60 V, the time to remove about 95% of the lactobionic acid drops from 100 min to 50 min approximately. No difference in the specific removal rate of lactobionic acid was observed for changes in the NaCl concentration in the electrode compartment, which can attributed to the range of NaCl concentration used. Possibly, the use of values below 25 g L-1 could produce some noticeable difference. On the other hand, the NaCl concentration in the concentrated stream exerts great influence on the removal rate, because the presence of this salt in this stream increases the conductivity and so decreases the resistance to the transport.
Based on the results of the experimental design and using Equation (4), it is possible to analyze the effect of each variable on the removal rate of lacto-bionic acid, as well as to verify the significance of these effects. According to the theory of factorial design, this equation means that the effects can be represented by a sum of linear contributions. Model parameters and parameter variances can be obtained with the aid of maximum likelihood estimation pro-cedures, as described in the literature (Schwaab and Pinto, 2007).
(
)
(
)
0 1 2 _ 3
4 _ 4 _
5 6 _
2 2
2
7 8 _ 9
norm norm norm
NaCl el NaCl
norm norm norm norm
NaCl el NaCl el
norm norm norm norm
NaCl NaCl el NaCl
norm norm norm
NaCl el NaCl
Rate a a V a C a C
a V C a V C
a V C a C C
a V a C a C
= + ⋅ + ⋅ + ⋅ + ⋅ ⋅ + ⋅ ⋅ + ⋅ ⋅ + ⋅ ⋅
+ ⋅ + ⋅ + ⋅
(4)
The confidence regions of the parameter esti-mates can be written in the form:
est true est
i θi i i θi
θ −ε <θ <θ +ε (5)
where θiest represents the estimated parameter value; true
i
θ represents the “true” (and unknown) parameter value and εθi represents the parameter uncertainty, obtained with the help of the standard t-distribution, in the form:
i t i
θ θ
ε = ⋅σ (6)
with the level specified by the user. σθi is the stan-dard deviation of the parameter estimate. Thus, for a parameter to be significant, εθi should be smaller than
est i
θ (Schwaab and Pinto, 2007). Taking this into ac-count, Equation (7) was obtained after a parameter estimation procedure, performed with the software Statistica 6.0 (Statsoft, 2001).
(
) (
)
(
)
(
)
(
)
(
)
21.045 0.028 0.215 0.023
0.091 0.023 0.078 0.031 0.078 0.024 norm norm NaCl norm norm NaCl norm NaCl Rate V C V C C = ± + ± ⋅ + ± ⋅ + ± ⋅ ⋅ − ± ⋅ (7)
Equation (7) shows that the significant parame-ters with 95% confidence were the voltage and the NaCl concentration in the concentrated stream, while the NaCl concentration in the electrodes compart-ment did not exert an influence on the specific re-moval rate of lactobionic acid, within the experi-mental range used.
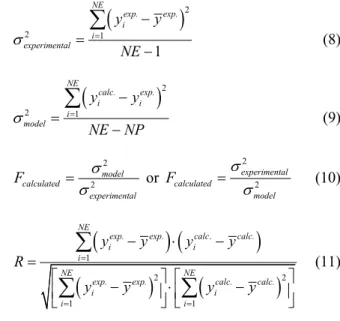
Table 3 shows the statistical analysis of the model performance, where:
(
)
22 1 1 NE exp. exp. i i experimental y y NE σ = − = −
∑
(8)(
)
22 1 NE calc. exp. i i i model y y NE NP σ = − = −
∑
(9) 2 2 model calculated experimental F σ σ= or
2 2 experimental calculated model F σ σ
= (10)
(
) (
)
(
)
(
)
. 1 2 2 1 1 NEexp. exp. calc calc.
i i
i
NE NE
exp. exp. calc. calc.
i i
i i
y y y y
R
y y y y
= = = − ⋅ − = ⎡ − ⎤ ⎡⋅ − ⎤ ⎢ ⎥ ⎢ ⎥ ⎣ ⎦ ⎣ ⎦
∑
∑
∑
(11)In these equations, calc. i
y and exp. i
y are the predicted and experimental values, respectively;
calc. i
y and exp. i
y are the predicted and experimental average values, respectively; NE and NP are the number of experiments and the number of model parameters, respectively; 2
experimental
σ and 2
model σ are the experimental and model variances, respectively; R is the correlation coefficient; Fcalculated is the value
of the calculated F.
1008 J. B. Severo Júnior, T. L. M. Alves and H. C. Ferraz
resulting in Fcalculated is within the tabulated interval,
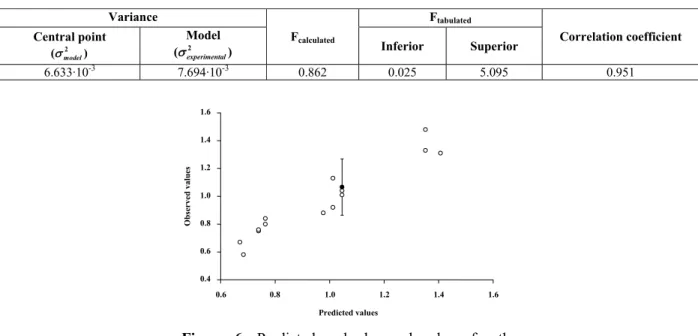
meaning that the prediction errors of the model are similar to the experimental errors, as can be observed in Figure 6. It is important to note that an assumption of the factorial design is that the error is constant for
all the experimental range. This figure shows that the predicted values are within the experimental errors, represented by the average value of the central point, with its confidence interval, calculated by the t Test with 95% confidence.
0.0 0.2 0.4 0.6 0.8 1.0 1.2
0 20 40 60 80 100 120
Time (min)
C/
C0
Figure 5: Removal curves of lactobionic acid for
experiments 12 to 17 (axial points), shown in Table 2 (Exp. 12 – 20 V, 100 g L-1, 1.512 g L-1 (z); Exp. 13 – 60 V, 100 g L-1, 1.512 g L-1 ({); Exp. 14 – 40 V, 24.4 g L-1, 1.512 g L-1 (¡); Exp. 15 – 40 V, 175.60 g L-1, 1.512 g L-1 (); Exp. 16 – 40 V, 100 g L-1, 0.0 g L-1 (▲); Exp. 17 – 40 V, 100 g L-1, 3.0 g L-1 (U)), where C is the actual concentration and C0 the initial
concentration.
Table 3: F Test between the central points and of model variances (Equation (7)).
Variance Ftabulated
Central point
2
(σmodel)
Model
2
(σexperimental)
Fcalculated
Inferior Superior Correlation coefficient
6.633·10-3 7.694·10-3 0.862 0.025 5.095 0.951
0.4 0.6 0.8 1.0 1.2 1.4 1.6
0.6 0.8 1.0 1.2 1.4 1.6
Predicted values
O
b
serv
e
d
v
a
lue
s
Figure 6: Predicted and observed values for the
Brazilian Journal of Chemical Engineering Vol. 31, No. 04, pp. 1003 - 1011, October - December, 2014
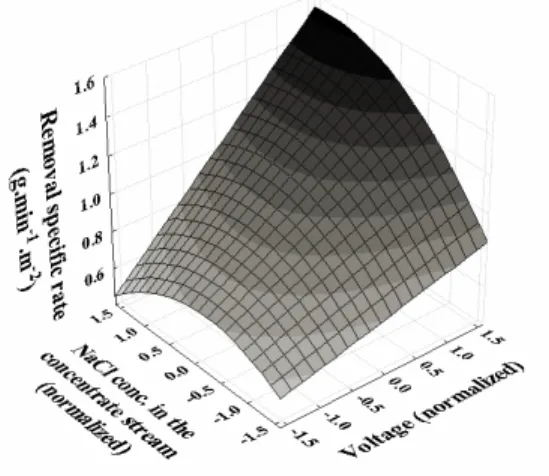
Equation (7) also shows that the voltage is the most influential variable, being a linear and positive parameter. In other words, as the voltage increases so does the removal rate. Besides, there is a combina-tion effect between the voltage and the salt concen-tration in the concentrate stream, indicating the ex-istence of non-linearity in the investigated system. According to Equation (7), the effect of the NaCl concentration in the concentrated stream goes through a maximum. With support of the software Mathcad, an optimization routine (based on the Levenberg-Marquard algorithm) was used to calculate the values of the variables that maximize the specific removal rate in the studied range. Thus, the condition of 60 V and 3.0 g L-1 for the NaCl concentration in the concentrated stream is the best condition found, as it is evident from Figure 7.
Figure 7: Behavior of the specific removal rate as a
function of the voltage and NaCl concentration in the concentrated stream, based on Equation (7).
Figure 8 shows the apparent resistance of the electrodialysis unit calculated for experiments 12 and 13, in order to evaluate the voltage effect. Experi-ments 16 and 17 show the influence of the salt con-centration in the concentrated stream. The apparent resistance of the electrodialysis unit was calculated based on Equation (12), Ohm’s law, as follows:
V i
Ω = (12)
where V and i are the applied tension and the electri-cal current of the system, respectively.
It is possible to verify in Figure 8 that, for ex-periments 12 and 13, as the voltage increased from 20 V to 60 V, the electrical resistance of the system decreased because the electrical current increased.
The effect of the salt concentration in the concen-trated stream is evident in Figure 8, because at the very beginning of the experiment (time = 0), the apparent resistance of the unit without addition of salt is about 500 Ohms, while with 3 g L-1 salt solu-tion it is 60 Ohms; since the ions in the solusolu-tion in-creased the conductivity in the channels between the membranes, thus the transport resistance decreased.
0 100 200 300 400 500 600
0 20 40 60 80 100 120
Time (min)
Resistan
ce
(
O
h
m
)
Figure 8: Apparent electrical resistance of the
electrodialysis system for experiments 12, 13, 16 and 17 of Table 2 (Exp. 12 – 20 V, 100 g L-1, 1.512 g L-1 (¡); Exp. 13 – 60 V, 100 g L-1, 1.512 g L-1 (U); Exp. 16 – 40 V, 100 g L-1, 0.0 g L-1 (▲); Exp. 17 – 40 V, 100 g L-1, 3.0 g L-1 ({)).
For all experiments of the factorial design, a removal of lactobionic acid superior to 95% was ob-tained in less than 100 min. In a similar work (Peretti et al., 2009), a removal of 38.7% of lactobionic acid from synthetic mixtures was obtained in about 250 min and at 15 V.
The results presented in this work show that this membrane separation process can be successfully integrated into the step of production of sorbitol and lactobionic acid by permeabilized cells of Zymomonas mobilis from lactose and fructose, with a possible posi-tive effect of avoiding the enzyme inhibition (Furlinger et al., 1998; Ferraz et al., 2001). For a lactobionic acid production rate of 1 gacid.gcell-1.h-1 (the highest obtained
in our previous studies), using 1 g of cells, a mem-brane area inferior to 100 cm2 would be needed.
CONCLUSIONS
1010 J. B. Severo Júnior, T. L. M. Alves and H. C. Ferraz
force, thus facilitating the removal. The best conditions for the separation of the acid within the studied range were 60 V, 3 g L-1 of NaCl in the concentrated stream and 25 g L-1 of NaCl in the electrode compartment.
In all experiments it was possible to remove more than 95% of lactobionic acid in less than 2 hours. The increase of the number of cell pairs of the electrodi-alysis stack, and thus in the membrane area, is easily accomplished due to its modular design, allowing the prompt scale-up of this process. This work opens new perspectives for the industrial production of sorbitol and lactobionic acid, which is currently still based on conventional processes.
NOMENCLATURE
Latin Letters
ai coefficients of the empirical model
(-)
NaCl
C NaCl concentration in the concentrated stream
g L-1
norm NaCl
C normalized NaCl concentration in the concentrated stream
(-)
_
NaCl el
C NaCl concentration in the electrode compartment
g L-1
_
norm NaCl el
C normalized NaCl
concentration in the electrode compartment
(-)
Fcalculated value of the calculated F (-) i electrical current of the
system
A
NE number of experiments (-) NP number of parameter of the
model
(-)
R correlation coefficient (-) Rate specific removal rate gacid gcell-1 h-1
t value of the t-distribution (-)
V applied voltage V
norm
V normalized voltage (-)
calc. i
y average data predicted by the model
gacid gcell-1 h-1
calc. i
y values predicted by the model gacid gcell-1 h-1
exp.
y average experimental data gacid gcell-1 h-1
exp. i
y experimental values gacid gcell-1 h-1
Greek Letters
i
θ
ε parameter uncertainty (-) est
i
θ estimated parameter value (-)
true i
θ “true” (and unknown) parameter value
(-)
i
θ
σ standard deviation of the parameter estimate
(-)
2
experimental
σ the experimental variances (-)
2
model
σ the model variances (-)
Ω apparent resistance ohm
REFERENCES
Bélafi-Bakó, K., Nemestóthy, N., Gubicza, L., Study on application of membrane techniques in bio-conversion of fumaric acid to L-malic acid. De-salination, 162, 301 (2004).
Choi, J-H., Kim, S-H., Moon, S-H., Recovery of lactic acid from sodium lactate by ion substitution using ion-exchange membrane. Separation and Purification Technology, 28, 69 (2002).
Dhariwal, A., Mavrov, V., Schroeder, I., Production of lactobionic acid with process integrated elec-trochemical enzyme regeneration and optimisa-tion of process variables using response surface methods (RSM). Journal of Molecular Catalysis B: Enzymatic, 42, 64 (2006).
Ferraz, H. C., Alves, T. L. M., Borges, C. P., Cou-pling of an electrodialysis unit to a hollow fiber bioreactor for separation of gluconic acid from sorbitol produced by Zymomonas mobilis perme-abilized cells. Journal of Membrane Science, 191, 43 (2001).
Furlinger, M., Haltrich, D., Kulbe, K. D., Nidetzky, B., A multistep process is responsible for product-induced inactivation of glucose-fructose oxidore-ductase from Zymomonas mobilis. European Journal of Biochemistry, 251, 955 (1998).
Jonas, R., Silveira, M. M., Sorbitol can be produced not only chemically but also biotechnologically. Applied Biochemistry and Biotechnology, 118, 321 (2004).
Malvessi, E., Carra, S., Pasquali, F. C., Kern, D. B., Silveira, M. M., Ayub, M. A. Z., Production of organic acids by periplasmic enzymes present in free and immobilized cells of Zymomonas mobi-lis. Journal of Industrial Microbiology Biotech-nology, 40, 1 (2013).
Miyamoto, Y., Ooi, T., Kinoshita, S., Production of lactobionic acid from whey by Pseudomonas sp. LS13-1. Biotechnology Letters, 22, 427 (2000). Molnár, E., Eszterle, M., Kiss, K., Nemestóthy, N.,
Brazilian Journal of Chemical Engineering Vol. 31, No. 04, pp. 1003 - 1011, October - December, 2014
Molnár, E., Nemestóthy, N., Bélafi-Bakó, K., Utili-sation of bipolar electrodialysis for recovery of galacturonic acid. Desalination, 250, 1128-1131 (2010).
Novalic, S., Kongbangrend, T., Kulbe, K. D., Recovery of organic acids with high molecular weight using a combined electrodialytic process. Journal of Membrane Science, 166, 99 (2000). Paul, L. H. M., Patrick, F. F., Advanced Dairy
Chemistry: Lactose, Water, Salts and Minor Con-stituents. Springer, New York, v. 3 (2009). Pedruzzi, I., Silva, E. A. B., Rodrigues, A. E.,
Pro-duction of lactobionic acid and sorbitol from lac-tose/fructose substrate using GFOR/GL enzymes from Zymomonas mobilis cells: A kinetic study. Enzyme and Microbial Technology, 49, 183 (2011).
Peretti, F. A., Silveira, M. M., Zeni, M., Use of elec-trodialysis technique for the separation of lacto-bionic acid produced by Zymomonas mobilis. De-salination, 245, 626 (2009).
Schwaab, M., Pinto, J. C., Análise de dados expe-rimentais I – fundamentos de estatística e
esti-mação de parâmetros. E-papers, Brazil, v. 1 (2007). (In portuguese).
Severo Júnior, J. B., Pinto, J. C., Ferraz, H. C., Alves, T. L. M., Production of lactobionic acid and sor-bitol using the GFOR (glucose-fructose oxidore-ductase) enzyme from permeabilized cells of Zy-momonas mobilis. Journal of Industrial Microbi-ology BiotechnMicrobi-ology, 38, 1575 (2011).
Splechtna, S., Petzelbauer, I., Bamingerm, U., Haltrich, D., Kulbe, K. D., Nidetzky, B., Produc-tion of a lactose-free galacto-oligosaccharide mix-ture by using selective enzymatic oxidation of lactose into lactobionic acid. Enzyme and Micro-bial Technology, 29, 434 (2001).
StatSoft, Inc., STATISTICA (Data Analysis Soft-ware System), version 6. www.statsoft.com (2001). Tongwen, X., Weihua, Y., Citric acid production by
electrodialysis with bipolar membranes. Chemical Engineering and Processing, 41, 519 (2002) Zachariou, M., Scopes, R. K., Glucose-fructose