Predicting pathway cross-talks in ankylosing
spondylitis through investigating the interactions
among pathways
Xiang Gu
1, Cong-Jian Liu
1and Jian-Jie Wei
2 1Department of Orthopedics, People’s Hospital of Ri Zhao, Ri Zhao, Shandong, China 2
Department of Orthopedics, Weihaiwei People’s Hospital, Weihai, Shandong, China
Abstract
Given that the pathogenesis of ankylosing spondylitis (AS) remains unclear, the aim of this study was to detect the potentially functional pathway cross-talk in AS to further reveal the pathogenesis of this disease. Using microarray profile of AS and biological pathways as study objects, Monte Carlo cross-validation method was used to identify the significant pathway cross-talks. In the process of Monte Carlo cross-validation, all steps were iterated 50 times. For each run, detection of differentially expressed genes (DEGs) between two groups was conducted. The extraction of the potential disrupted pathways enriched by DEGs was then implemented. Subsequently, we established a discriminating score (DS) for each pathway pair according to the distribution of gene expression levels. After that, we utilized random forest (RF) classification model to screen out the top 10 paired pathways with the highest area under the curve (AUCs), which was computed using 10-fold cross-validation approach. After 50 bootstrap, the best pairs of pathways were identified. According to their AUC values, the pair of pathways, antigen presentation pathway and fMLP signaling in neutrophils, achieved the best AUC value of 1.000, which indicated that this pathway cross-talk could distinguish AS patients from normal subjects. Moreover, the paired pathways of SAPK/JNK signaling and mitochondrial dysfunction were involved in 5 bootstraps. Two paired pathways (antigen presentation pathway and fMLP signaling in neutrophil, as well as SAPK/JNK signaling and mitochondrial dysfunction) can accurately distinguish AS and control samples. These paired pathways may be helpful to identify patients with AS for early intervention.
Key words: Ankylosing spondylitis; Monte Carlo cross-validation; Differentially expressed genes; Random forest classification; Pathway cross-talk
Introduction
Ankylosing spondylitis (AS) is a chronic inflammation disorder that attacks sacroiliac joints and spine (1) with a 0.3% incidence rate in the Asian population (2). AS causes severe back pain, stiffness and new bone formation, and results in progressive joint ankylosis further decreasing quality of life (3). Unfortunately, the disease condition, includ-ing disease activity, progression and prognosis, are very hard to define in AS (4). Until now, the underlying mole-cular processes driving the AS progress are still unclear. Consequently, investigation on the pathogenesis of AS is urgently needed.
In recent years, genetic-associated research has detected several new genes related to AS. Of note, some of these genes seem specific for AS, but others have pleiotropic associations (5,6). Moreover, these studies offer little information concerning changes in gene activity during the progression of the disease. Fortunately, gene expression profiling provides a ‘‘snapshot’’ of cellular
activity, supplying information on molecular mechanisms mediating disease changes, and can produce diagnostic gene sets. A number of recent studies have defined tran-scriptional profiles generated from peripheral blood mono-nuclear cells for AS. GSE25101 is one of the microarray profiles of AS that was reported by Pimentel-Santos et al. (7), who identified a set of differentially expressed genes (DEGs), which were highly connected with AS, partially regulating the inflammatory process and joint destruction. In 2015, Zhao et al. (8) used the same microarray profile of GSE25101 to predict the potential AS-related genes, such as RPL17,MRPL22,PSMA6and PSMA4. In 2015, also using the same data, Shi et al. (9) identified 284 DEGs
correlated with AS (such as MYH9, BCL11Band CD4),
and detected the pathway for immune response regula-tion. Nevertheless, so far, most studies that assessed the genetics of AS focused on a single gene or a single path-way. However, pathway cross-talk is frequently neglected.
Correspondence: X. Gu:<[email protected]>
In general, different pathways interact with each other, and an abnormity in one pathway may influence the activities of many other related pathways. Understanding pathway interactions might be beneficial to explore the pathogenesis of AS. No reliable method is used to quantify the cross-talks for pathway pairs (10). However, integrating DEGs information and pathway information with Monte Carlo cross-validation has been proposed to quantify the cross-talk between pathways pairs (11). Monte Carlo cross-validation provided by Shao (12) has been demonstrated to decrease the risk of overfitting the model, and has been used to evaluate the prediction ability of the selected model.
Thus, in the current study, to explore the pathogenesis of AS, we undertook the microarray data analysis of AS to identify the significant pathways considering the functional dependency among pathways using Monte Carlo cross-validation. We believe that our results may contribute to a better understanding of the molecular processes driving AS progression.
Material and Methods
Using microarray profile as well as biological pathways as study objects, Monte Carlo cross-validation method was
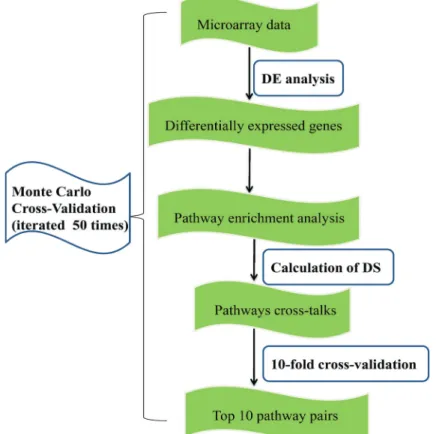
used to identify the significant pathways. In this process, all steps were iterated 50 times. For each run, we implemented differential expression analysis (DEA), pathways enrich-ment analysis, calculation of a discriminating score (DS), and random forest (RF) classification. After 50 runs, the top 10 pathway pairs with the best area under the curve (AUC) values were identified (significant paired path-ways). Theflow chart of the analysis is shown in Figure 1.
Microarray data
The expression profile of GSE25101 deposited by Pimentel-Santos et al. (7) was downloaded from Gene Expression Omnibus (http://www.ncbi.nlm.nih.gov/geo/), based on the GPL6947 platform of Illumina Human HT-12 V3.0 expression BeadChips. In the GSE25101, there were 16 active AS patients and 16 normal controls with matched gender and age. Included AS patients had Bath Ankylosing Spondylitis Disease Activity Index (BASDAI)
scores 44 and Bath Ankylosing Spondylitis Functional
Index (BASFI) scores44. The raw probe annotationfiles
were obtained for subsequent analysis.
Differential expression analysis
The raw probe sets were pre-processed by means of robust multiarray averaging method. Then, the probes were
mapped to the genomics, and the human gene symbols were obtained. Afterwards, Bayesian approach (13) was utilized to detect DEGs. With the goal of avoiding the multiple testing bias, which might cause false positive results, the Benjamini-Hochberg method (14) was used for multiple correction, and false discovery rate (FDR) distribu-tion for each gene was obtained. Eventually, |log2FC|41 and FDR o0.05 were set as the cut-off criteria to extract DEGs between AS and control samples.
Pathway enrichment analysis
To extract a cluster of pathways significantly enriched by DEGs, pathway enrichment analysis from DEGs was conducted. First, a total of 589 biological pathways were derived from the Ingenuity Pathways Analysis (IPA) software (http://www.ingenuity.com/) (15). Then, we assessed the
enrichment effect based on Fisher’s exact test, aiming
to place DEGs in an IPA pathway and to screen out the pathways responsible for coordinating their activity.
The pathways with Po0.01 were identified. Afterwards,
the raw P values were corrected for multiple testing through Benjamini-Hochberg procedure (14). In the current
study, the pathways with FDRo0.05 were considered as
differential pathways.
DS for pathway cross-talk
The DS is often used to compare the expression levels in the samples with amplification and the samples with-out amplification (16). The DS indicates the relationships between pathway pairs. Therefore, we calculated the DS to further analyze the pathway cross-talks in our study. In detail, we computed a DS by comparing the expression levels of each pathway pair involved in DEGs in each sample based on the formula used in a previous study by Orsetti et al. (16). A larger DS denotes a higher difference in activity of the pairs.
Selecting the best pathway pairs
RF is a powerful classifier utilized to handle two issues of variable selection, and it has become a standard anal-ysis tool in bioinformatics (17). Thus, in the present work, we employed a RF model on the pathway pairs to estimate the classification performance of this method according to AUC index. The 10-fold cross-validation method was utilized to calculate AUC based on mtry and ntree parameters. The ‘mtry’, is the number of variables randomly sampled as candidates at each split, and is equal to sqrt(p), where p is the variable count in the data matrix. The ‘ntree’, is the count of trees grown, amounted to 500. Subsequently, we sorted all AUC values in descending order, and the top 10 pathway pairs were extracted.
As reported, during the validation analysis, the ratio of 6 to 4 is a commonly used distribution proportion (18). Thus, the Monte Carlo cross-validation method randomly assigned 60% of the original microarray profile to make up for the training set and assigned the remaining 40%
to form the testing data. This procedure was iterated 50 times, randomly producing new training and testing sets each time. For each run, we used a training set to extract DEGs, the pathways enriched by DEGs, and the DS values for the top 10 pathway pairs with the best AUCs between AS and control groups; we utilized the testing data to validate the top 10 pathway pairs. At the end of the 50 runs, the top 10 pathway pairs sorted in descending rank were extracted in 50 bootstraps. Eventually, the list of the top 10 pathway pairs ranked for all 50 bootstraps were considered as the significant ones.
Results
DEGs identification and pathway enrichment analysis
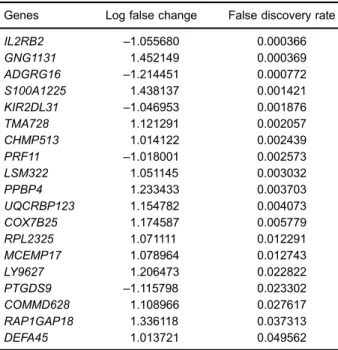
After robust microarray analysis, 11,586 genes were identified for differential expression analysis. According
to |log2FC|41 and FDRo0.05, 19 genes were found to
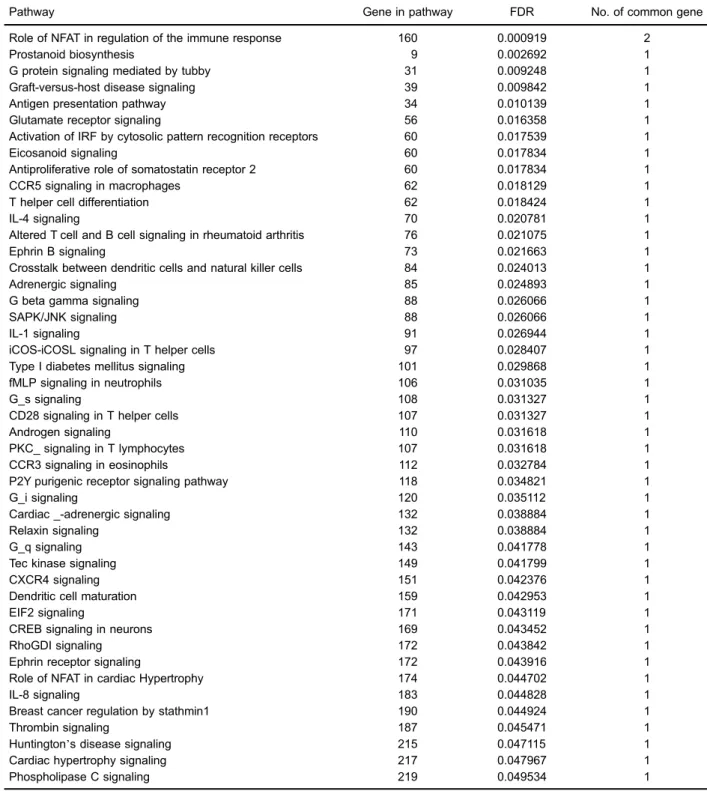
be differentially expressed between AS and control samples, as listed in Table 1. Moreover, 46 significant pathways enriched by DEGs were detected. Table 2 displays the names of significant pathways enriched from DEGs, the corresponding FDR values, count of genes for each path-way, and count of common genes between DEGs and genes in the pathways. Then, we computed a DS via com-paring the expression levels of each pair of pathways involved in DEGs in each sample. The distribution of DS values is shown in Supplementary Table S1. The DS values of 4 pathway cross-talks were higher than 0.1, which included the role of NFAT in regulation of the immune response/prostanoid biosynthesis (DS=0.212938), the role
Table 1.List of differentially expressed genes (DEGs).
Genes Log false change False discovery rate
IL2RB2 –1.055680 0.000366
GNG1131 1.452149 0.000369
ADGRG16 –1.214451 0.000772
S100A1225 1.438137 0.001421
KIR2DL31 –1.046953 0.001876
TMA728 1.121291 0.002057
CHMP513 1.014122 0.002439
PRF11 –1.018001 0.002573
LSM322 1.051145 0.003032
PPBP4 1.233433 0.003703
UQCRBP123 1.154782 0.004073
COX7B25 1.174587 0.005779
RPL2325 1.071111 0.012291
MCEMP17 1.078964 0.012743
LY9627 1.206473 0.022822
PTGDS9 –1.115798 0.023302
COMMD628 1.108966 0.027617
RAP1GAP18 1.336118 0.037313
of NFAT in regulation of the immune response/eicosanoid signaling (DS=0.212938), the role of NFAT in regulation of the immune response/EIF2 signaling (DS=0.182708), and
the role of NFAT in regulation of the immune response/ activation of IRF by cytosolic pattern recognition receptors (DS=0.111934).
Table 2.Pathways enriched by differentially expressed genes (DEGs).
Pathway Gene in pathway FDR No. of common gene
Role of NFAT in regulation of the immune response 160 0.000919 2
Prostanoid biosynthesis 9 0.002692 1
G protein signaling mediated by tubby 31 0.009248 1
Graft-versus-host disease signaling 39 0.009842 1
Antigen presentation pathway 34 0.010139 1
Glutamate receptor signaling 56 0.016358 1
Activation of IRF by cytosolic pattern recognition receptors 60 0.017539 1
Eicosanoid signaling 60 0.017834 1
Antiproliferative role of somatostatin receptor 2 60 0.017834 1
CCR5 signaling in macrophages 62 0.018129 1
T helper cell differentiation 62 0.018424 1
IL-4 signaling 70 0.020781 1
Altered T cell and B cell signaling in rheumatoid arthritis 76 0.021075 1
Ephrin B signaling 73 0.021663 1
Crosstalk between dendritic cells and natural killer cells 84 0.024013 1
Adrenergic signaling 85 0.024893 1
G beta gamma signaling 88 0.026066 1
SAPK/JNK signaling 88 0.026066 1
IL-1 signaling 91 0.026944 1
iCOS-iCOSL signaling in T helper cells 97 0.028407 1
Type I diabetes mellitus signaling 101 0.029868 1
fMLP signaling in neutrophils 106 0.031035 1
G_s signaling 108 0.031327 1
CD28 signaling in T helper cells 107 0.031327 1
Androgen signaling 110 0.031618 1
PKC_ signaling in T lymphocytes 107 0.031618 1
CCR3 signaling in eosinophils 112 0.032784 1
P2Y purigenic receptor signaling pathway 118 0.034821 1
G_i signaling 120 0.035112 1
Cardiac _-adrenergic signaling 132 0.038884 1
Relaxin signaling 132 0.038884 1
G_q signaling 143 0.041778 1
Tec kinase signaling 149 0.041799 1
CXCR4 signaling 151 0.042376 1
Dendritic cell maturation 159 0.042953 1
EIF2 signaling 171 0.043119 1
CREB signaling in neurons 169 0.043452 1
RhoGDI signaling 172 0.043842 1
Ephrin receptor signaling 172 0.043916 1
Role of NFAT in cardiac Hypertrophy 174 0.044702 1
IL-8 signaling 183 0.044828 1
Breast cancer regulation by stathmin1 190 0.044924 1
Thrombin signaling 187 0.045471 1
Huntington’s disease signaling 215 0.047115 1
Cardiac hypertrophy signaling 217 0.047967 1
Phospholipase C signaling 219 0.049534 1
Identifying the best pathway pairs
With the goal of assessing the classification ability of this approach, we used 10-fold cross-validation to calcu-late the AUC values for pathway pairs using the RF model. Each pathway pair was then ranked based on its corres-ponding AUC value. Of note, there were 35 pairs of pathways with AUC not less than 0.800. It is known
through the literature that AUC 40.7 is determined as
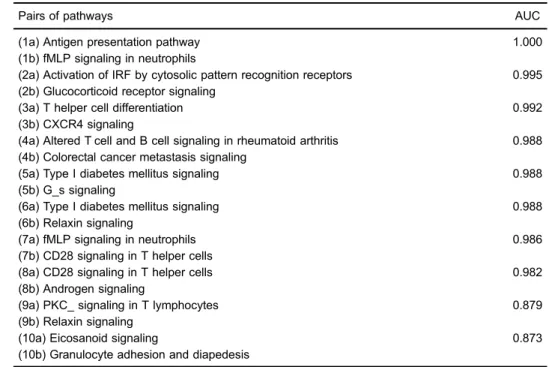
good, and an AUC of 1.0 suggests a perfect classification (19). Greater AUCs indicate better disease classification, that is, a stronger correlation between the pathways and the given disease. Hence, to better understand the molec-ular mechanisms of AS, we focused more in the top 10 pathway pairs, as reported by Colaprico et al. (11). Table 3 demonstrates the top 10 paired pathways with the best classification performance for AS and control samples for all 50 runs. The pair‘antigen presentation pathway’ and ‘fMLP signaling in neutrophils’had the best AUC value of 1.0. Moreover, the pair‘activation of IRF by cytosolic pattern recognition receptors’and glucocorticoid receptor signaling’ revealed a good classification ability with a 0.995 AUC. Similar performance was observed in the pair‘T helper cell differentiation’and‘CXCR4 signaling’with AUC of 0.992.
After this, the top 10 pairs of pathways were extracted based on the occurrence frequency in the 50 bootstraps
X3. According to this procedure, the pair ‘SAPK/JNK
signaling’ and ‘mitochondrial dysfunction’ were involved in 5 bootstraps, the pair ‘mitochondrial dysfunction’ and ‘G beta gamma signaling’appeared in 4 runs, and the pair
‘mitochondrial dysfunction’and‘G protein signaling mediated by Tubby’also appeared in 4 runs. Importantly, among these top 10 pathway pairs, the ‘mitochondrial dysfunction’ inter-acted with 6 different pathways. Specific information is shown in Table 4.
Discussion
AS, as a common rheumatic disorder, leads to inflam-matory back pain, thereby reducing the quality of life (20). The potential molecular mechanism of AS remains unclear. In recent years, gene expression profiles have been widely used to identify disease-related biomarkers (21,22), several of them having similar functions, however reproducibility is poor. In this condition, these biomarkers may not have precise classification ability. With the goal of solving this challenge, extraction of biological pathways involved in a given phenotype is a key process. Pathway-based bio-signatures are more reproducible and frequently obtain better classification ability than single gene biomarkers (19). However, currently, most approaches regard the pathways to be independent, not considering the interactions between them, called‘‘cross-talk’’(23). The cross-talks among path-ways indicate the regulatory interaction among different pathways. Of note, detection of cross-talks among pathways better reveal the pathway functions and contribute more to the understanding of the synergistic effects on cellular processes, compared with individual pathways (24). Further-more, several reports demonstrated the potential function
Table 3.Top 10 pathway pairs with the highest AUC values.
Pairs of pathways AUC
(1a) Antigen presentation pathway (1b) fMLP signaling in neutrophils
1.000
(2a) Activation of IRF by cytosolic pattern recognition receptors (2b) Glucocorticoid receptor signaling
0.995
(3a) T helper cell differentiation (3b) CXCR4 signaling
0.992
(4a) Altered T cell and B cell signaling in rheumatoid arthritis (4b) Colorectal cancer metastasis signaling
0.988
(5a) Type I diabetes mellitus signaling (5b) G_s signaling
0.988
(6a) Type I diabetes mellitus signaling (6b) Relaxin signaling
0.988
(7a) fMLP signaling in neutrophils (7b) CD28 signaling in T helper cells
0.986
(8a) CD28 signaling in T helper cells (8b) Androgen signaling
0.982
(9a) PKC_ signaling in T lymphocytes (9b) Relaxin signaling
0.879
(10a) Eicosanoid signaling
(10b) Granulocyte adhesion and diapedesis
0.873
of pathway cross-talks in therapeutic strategies (25,26). Although there are many merits of pathway cross-talk in disease treatment, pathways amount of cross-talk interac-tions have not been completely studied. Most importantly, no available technique can quantify the cross-talks for pathway pairs (10). Integrating DEGs information and the pathway information with Monte Carlo cross-validation has been proposed to quantify the cross-talk between pathways pairs (11). Consequently, in the present work, Monte Carlo cross-validation analysis was employed to uncover the best paired pathways that could distinguish between AS and control samples. We found 35 paired pathways with AUCs not less than 0.800, after evaluating the top 10 paired pathways. Thus, the pathogenesis of AS may be related with the expression alterations of these paired pathways.
The pathway pair‘antigen presentation pathway’and ‘fMLP signaling in neutrophils’got the best AUC value of 1.000, which indicated that this pathway cross-talk could distinguish AS patients from the normal subjects. As report-ed, exogenous antigens are presented by major histocom-patibility complex (MHC) class I molecules (27). Signifi-cantly, MHC class I molecules have been suggested to play important roles in immune surveillance by binding to CD8+ T cells, which act in concert towards antigen processing as well as antigen presentation machinery (28,29). HLA-27 and ERAP1 are central members in the antigen presentation machinery, which have been shown to contribute to the AS risk (30). HLA-27 can regulate the migration of neutrophil and neutrophils exert key functions in the innate immune response (31). A previous study published by Biasi et al.
exhibited an increased response to fMLP by circulating neutrophils in AS patients (31). Accordingly, the cross-talk between antigen presentation pathway and fMLP signaling in neutrophils might be strongly correlated with the etiology of AS, probably via regulating the immune response.
Bone formation (for example, syndesmophytes) is a common feature of AS (32). Furthermore, bone formation and development depend on the balance between osteo-blasts-mediated bone formation and osteoclasts-induced bone resorption, and this bone homeostasis is disrupted in an inflammation environment (33,34). TNF-a, as a key
pro-inflammatory cytokine, is responsible for the
inflammation-related bone loss, and TNF-acan suppress BMP-mediated
osteoblastogenesis through activating the SAPK/JNK path-way (35). Furthermore, endoplasmic reticulum (ER) stress can provide the links with the inflammatory responses, and result in the activation of JNK by reactive oxygen species (ROS) (36). Furthermore, mitochondria can contribute to the production of ROS (37). As documented, ROS attacks are directed primarily towards the polyunsaturated fatty acids of the membrane lipids, inducing lipid peroxidation, which further results in the disorganization of cell structure and function (38). Additionally, ROS have been indicated to be possible mediators of tissue damage, which is related to AS (39). Therefore, we infer that the alteration of the pathway pair ‘SAPK/JNK signaling’ and ‘mitochondrial dysfunction’ might induce AS onset and progression by affecting inflam-matory and oxidative metabolism as mentioned above.
Nevertheless, several study limitations must be noted. First, the sample size was rather small. Second, this was a Table 4.Top 10 pathway pairs with occurrence number not less than 3.
Pathway pairs Total occurrence number
(1a) EIF2 signaling (1b) LXR/RXR activation
3
(2a) Glutamate receptor signaling (2b) Mitochondrial dysfunction
3
(3a) EIF2 signaling (3b) iNOS signaling
3
(4a) IL-1 signaling
(4b) Mitochondrial dysfunction
3
(5a) CCR5 signaling in macrophages (5b) Mitochondrial dysfunction;
3
(6a) EIF2 signaling
(6b) Hepaticfibrosis/hepatic stellate cell activation
3
(7a) EIF2 signaling
(7b) MIF regulation of innate immunity
3
(8a) G protein signaling mediated by Tubby (8b) Mitochondrial dysfunction
4
(9a) G beta gamma signaling; (9b) Mitochondrial dysfunction
4
(10a) SAPK/JNK signaling (10b) Mitochondrial dysfunction
preliminary study of mechanisms underlying AS and results were achieved based onin silicoanalysis without validation in animal models or patient tissues. Thus, these pathway pairs should be further investigated using western blotting or PCR-based experiments to reveal the pathway changes in AS.
In conclusion, our analysis provided new knowledge for AS and identified several bio-signatures for this disease.
Based on our results, the detected pathway cross-talks might be helpful to identify patients with AS for early intervention. However, these paired pathways call for future functional studies.
Supplementary material
Click here to view [pdf].
References
1. Assassi S, Reveille JD, Arnett FC, Weisman MH, Ward MM, Agarwal SK, et al. Whole-blood gene expression profiling in ankylosing spondylitis shows upregulation of toll-like recep-tor 4 and 5.J Rheumatol 2010; 38: 87–98, doi: 10.3899/
jrheum.100469.
2. Guo YY, Yang LL, Cui HD, Zhao S, Zhang N. Coexisting ankylosing spondylitis and rheumatoid arthritis: a case report with literature review.Chin Med J2011; 124: 3430–3432. 3. Sims AM. Genome-wide association study of ankylosing
spondylitis identifies non-MHC susceptibility loci.Nat Genet 2010; 42: 123–127, doi: 10.1038/ng.513.
4. Machado P, Landewé R, Lie E, Kvien TK, Braun J, Baker D, et al. Ankylosing spondylitis disease activity score (ASDAS): defining cut-off values for disease activity states and improve-ment scores. Ann Rheum Dis 2011; 70: 47, doi: 10.1136/ ard.2010.138594.
5. Brionez TF, Reveille JD. The contribution of genes outside the major histocompatibility complex to susceptibility to ankylosing spondylitis.Curr Opin Rheumatol2008; 20: 384–
391, doi: 10.1097/BOR.0b013e32830460fe.
6. Burton PR, Clayton DG, Cardon LR, Craddock N, Deloukas P, Duncanson A, et al. Association scan of 14,500 nonsynon-ymous SNPs in four diseases identifies autoimmunity variants. Nat Genet2007, 39: 1329–1337, doi: 10.1038/ng.2007.17. 7. Pimentelsantos FM, Ligeiro D, Matos M, Mourão AF, Costa
J, Santos H, et al. Whole blood transcriptional profiling in ankylosing spondylitis identifies novel candidate genes that might contribute to the inflammatory and tissue-destructive disease aspects. Arthritis Res Ther 2011; 13: R57, doi: 10.1186/ar3309.
8. Zhao H, Wang D, Fu D and Xue L. Predicting the potential ankylosing spondylitis-related genes utilizing bioinformatics approaches. Rheumatol Int 2015; 35: 973, doi: 10.1007/ s00296-014-3178-9.
9. Shi Z, Li Q, Cai B, Ran B, Li M. Gene expression profiling analysis of patients with ankylosing spondylitis. J Spinal Disord Tech 2015; 28: E244–E250 (247), doi: 10.1097/
BSD.0000000000000266.
10. Donato M, Xu Z, Tomoiaga A, Granneman JG, Mackenzie RG, Bao R, et al. Analysis and correction of crosstalk effects in pathway analysis. Genome Res 2013; 23: 1885, doi: 10.1101/gr.153551.112.
11. Colaprico A, Cava C, Bertoli G, Bontempi G and Castiglioni. Integrative Monte Carlo Cross-validation reveals miRNAs regulating pathways cross-talk in aggressive breast cancer. Biomed Res Int 2015; 2015: 831314, doi: 10.1155/2015/ 831314.
12. Shao J. Linear model selection by cross-validation. J Am Stat Assoc1993; 88: 486–494.
13. Efron B, Tibshirani R. Empirical bayes methods and false discovery rates for microarrays.Genet Epidemiol2002; 23: 70–86, doi: 10.1002/gepi.1124.
14. Benjamini Y, Hochberg Y. Controlling the false discovery rate - a practical and powerful approach to multiple testing. J Royal Stat Soc1995; 57: 289–300.
15. Chang HY, Nuyten DS, Sneddon JB, Hastie T, Tibshirani R, Sørlie T, et al. Robustness, scalability, and integration of a wound-response gene expression signature in predicting breast cancer survival.Proc Natl Acad Sci U S A2005; 102: 3738–3743, doi: 10.1073/pnas.0409462102.
16. Orsetti B, Nugoli M, Cervera N, Lasorsa L, Chuchana P, Rougé C, et al. Genetic profiling of chromosome 1 in breast cancer: mapping of regions of gains and losses and
identi-fication of candidate genes on 1q.Br J Cancer2006; 95: 1439, doi: 10.1038/sj.bjc.6603433.
17. Breiman L. Random forests.Mach Learn2001; 45: 5–32,
doi: 10.1023/A:1010933404324.
18. Zhang P, Peng J. SVM vs regularized least squares
classi-fication. In: International Conference on Pattern Recognition, pp 176–179, Vol.171, 2004, doi: 10.1109/ICPR.2004.1334050.
19. Su J, Yoon BJ, Dougherty ER. Accurate and reliable cancer classification based on probabilistic inference of pathway activity.Plos One2009; 4: e8161, doi: 10.1371/journal.pone. 0008161.
20. Anderson JJ, Baron G, Van dHD, Felson DT, Dougados M. Ankylosing spondylitis assessment group preliminary defi ni-tion of short-term improvement in ankylosing spondylitis. Arthritis Rheum 2001; 44: 1876–1886, doi:
10.1002/1529-0131(200108)44.
21. Bailey ST, Westerling T, Brown M. Loss of estrogen-regulated microRNA expression increases HER2 signaling and is prognostic of poor outcome in luminal breast cancer. Cancer Res 2014; 75: 436–445, doi: 10.1158/0008-5472.
CAN-14-1041.
22. Knowles MA, Hurst CD. Molecular biology of bladder cancer: new insights into pathogenesis and clinical diversity. Nat Rev Cancer2015; 15: 25, doi: 10.1038/nrc3817. 23. Khatri P, Sirota M, Butte AJ. Ten years of pathway analysis:
current approaches and outstanding challenges. PLoS Comput Biol 2012; 8: 1454–1459, doi: 10.1371/journal.pcbi.1002375. 24. Li Y, Agarwal P. A pathway-based view of human diseases
and disease relationships.Plos One2009, 4: e4346, doi: 10.1371/journal.pone.0004346.
25. Johnston SR. New strategies in estrogen receptor-positive breast cancer.Clin Cancer Res2010; 16: 1979–1987, doi:
10.1158/1078-0432.CCR-09-1823.
receptor cross talk in breast cancer.Cancer Res2014; 74: 2107–2107, doi: 10.1158/1538-7445.AM2014-2107.
27. Kurts C, Robinson BW, Knolle PA. Cross-priming in health and disease. Nat Rev Immunol 2010; 10: 403–414, doi:
10.1038/nri2780.
28. Yewdell JW. The seven dirty little secrets of major histocom-patibility complex class I antigen processing.Immunol Rev 2005; 207: 8–18, doi: 10.1111/j.0105-2896.2005.00309.x. 29. Jensen PE. Recent advances in antigen processing and
presentation. Nat Immunol 2007; 8: 1041–1048.
30. Evans DM, Spencer CCA, Pointon JJ, Su Z, Harvey D, Kochan G, et al. Interaction between ERAP1 and HLA-B27 in ankylosing spondylitis implicates peptide handling in the mechanism for HLA-B27 in disease susceptibility. Nat Genet 2011; 43: 761–767, doi: 10.1038/ng.873.
31. Biasi D, Carletto A, Caramaschi P, Bellavite P, Andrioli G, CaraffiM, et al. Neutrophil functions, spondylarthropathies and HLA-B27: a study of 43 patients.Clin Exper Rheumatol 1995; 13: 623–627.
32. Visvanathan S, Van dHD, Deodhar A, Wagner C, Baker DG, Han J, et al. Effects of infliximab on markers of inflammation and bone turnover and associations with bone mineral density in patients with ankylosing spondy-litis. Ann Rheum Dis 2008; 68: 175–182, doi: 10.1136/
ard.2007.084426.
33. Yago T, Nanke Y, Kawamoto M, Furuya T, Kobashigawa T, Kamatani N, et al. IL-23 induces human osteoclastogenesis
via IL-17 in vitro, and anti-IL-23 antibody attenuates collagen-induced arthritis in rats. Arthritis Res Ther 2007; 9: R96, doi: 10.1186/ar2297.
34. Klenk S, Dippon J, Fritz P, Heidemann G. Effect of blockade of TNF-alpha and interleukin-1 action on bone resorption in early postmenopausal women.J Bone Miner Res2007, 22: 724–729, doi: 10.1359/jbmr.070207.
35. Mukai T, Otsuka F, Otani H, Yamashita M, Takasugi K, Inagaki K, et al. TNF-alpha inhibits BMP-induced osteoblast differentiation through activating SAPK/JNK signaling. Bio-chem Biophys Res Commun 2007; 356: 1004–1010, doi:
10.1016/j.bbrc.2007.03.099.
36. Urano F, Wang X, Bertolotti A, Zhang Y, Chung P, Harding HP, et al. Coupling of stress in the ER to activation of JNK protein kinases by transmembrane protein kinase IRE1. Science 2000; 287: 664–666, doi: 10.1126/science.287.
5453.664.
37. Hotamisligil GS. Inflammation and metabolic disorders.Curr Opin Clin Nutr Metab Care 2008; 11: 459, doi: 10.1097/ MCO.0b013e32830460c2.
38. Floyd RA. Role of oxygen free radicals in carcinogenesis and brain ischemia.FASEB J1990; 4: 2587–2597.