Air quality and emergency pediatric care for
symptoms of bronchial obstruction categorized
by age bracket in Rio de Janeiro, Brazil
Qualidade do ar e atendimentos pediátricos de
emergência por sintomas de obstrução brônquica
categorizados por faixas etárias no Rio de Janeiro,
Brasil
1 Escola Nacional de Saúde Pública Sergio Arouca, Fundação Oswaldo Cruz, Rio de Janeiro, Brasil. 2 Instituto de Medicina Social, Universidade do Estado do Rio de Janeiro, Rio de Janeiro, Brasil.
Correspondence M. Moura
Centro de Estudos da Saúde do Trabalhador e Ecologia Humana, Escola Nacional de Saúde Pública Sergio Arouca, Fundação Oswaldo Cruz. Rua Leopoldo Bulhões 1480, Rio de Janeiro, RJ 21041-210, Brasil. [email protected]
Marisa Moura 1
Washington Leite Junger 2
Gulnar Azevedo e Silva Mendonça 2 Antonio Ponce de Leon 2
Abstract
The objective of this study was to estimate the association between levels of air pollutants and respiratory symptoms in children. An ecological time-series study was conducted between April 2002 and March 2003 with daily data on PM10, SO2, CO, NO2, and O3 and paediatric care in emergency rooms due to symptoms indicating bronchial obstruction. The potential confound-ing factors considered were: time trend, season-ality, meteorological variables, respiratory infec-tions and the effects of weekends and holidays. A semi-parametric Poisson regression was used to model the time series. Splines (data smoothing functions), indicator variables and cubic polyno-mials were used to adjust the effects of the con-founding variables. A 5% significance level was adopted for the study. A statistically significant increase of 6.7% in paediatric visits of children of less than 2 years of age was associated with PM10. A 3% positive association with O3 showed borderline significance (p < 0.06) in this age bracket. Our findings highlight the existence of an acknowledged public health problem in Rio de Janeiro, Brazil, and also emphasize the need to identify the principal sources of air pollutants.
Air Pollution; Asthma; Child
Introduction
Bronchial asthma is the most prevalent chronic disease in childhood, and its prevalence is in-creasing especially in large industrialized coun-tries 1,2,3. Although the disease has a low case
fatality rate, it limits normal childhood activi-ties in a large number of children. There are cur-rently an estimated 300 million asthmatic in-dividuals worldwide, a figure that will increase by another 100 million by the year 2025, due in part to the growing process of urbanization and air pollution 4.
The contribution of air pollutants to the ap-pearance of characteristic symptoms of bronchial asthma has still not been fully elucidated. Some evidence suggests that lesions in the airways and pulmonary parenchyma, caused by exposure to air pollutants, probably exacerbate the harmful effects of viruses and/or allergens 5,6.
Distinct levels of maturation and the ana-tomical development of the structures in the immune and pulmonary systems from birth to puberty determine the variations in responses to environmental stimuli. In the first years of life, the reduced size of the airways facilitates the decrease in the bronchial lumen during the in-flammatory processes accompanying viral infec-tions. At this age, the respiratory syncytial virus was found to be one of the most prevalent agents involved 7,8. The respiratory manifestations are
picture of bronchial asthma, thus leading to con-stant errors in aetiological diagnoses 9. From six
years of age onwards, the temporal association with exposure to allergens, the recurrent evolu-tion of acute clinical episodes, and the presence of specific biological parameters characterizing the immunological alterations of allergic diseas-es characterize children with bronchial asthma. Respiratory allergies and viral infections appear to be independent and synergistic risk factors for the development of symptoms of bronchial ob-struction at this stage 8.
Rio de Janeiro is the second largest city in Brazil, but the respiratory effects of air pollution on the paediatric population have received little investigation, while epidemiological data are scarce concerning the prevalence of bronchial asthma and other allergic diseases in the city’s population 10.
The objective of this present study was to es-timate the association between daily variations in air pollutant levels and emergency room visits due to obstructive airway diseases in the paedi-atric population in a specific region of Rio de Ja-neiro city, considering different age groups.
Material and methods
The epidemiological design of a time series eco-logical study was adopted, with daily observation of health events, air pollutant concentrations, and meteorological factors.
All children from aged between one month and 12 years who had come for emergency medical treatment due to acute respiratory com-plaints, at public health units with a high daily volume of emergency medical care in the region of Jacarepaguá, city of Rio de Janeiro, between 1st
April 2002 and 31 March 2003, were included in the study.
The study area is located in the west side of the city of Rio de Janeiro and covers 126.61km2,
with a paediatric population of 120,469 (Instituto Pereira Passos. Armazém de dados. http://portal geo.rio.rj.gov.br/serie_rfoco/municipio/index. htm, accessed on 03/Oct/2005).
A team of previously trained professionals conducted a daily selection of the patient treat-ment forms that met the eligibility criteria. Af-ter this stage, the presence of respiratory signs, symptoms, or diagnoses was recorded on an original instrument, with specific fields for fre-quent causes of emergency paediatric visits such as colds, otitis, eye irritation, cough, and asthma. In addition, the reasons for the visits were clas-sified as upper airways diseases, lower airways diseases, and/or acute respiratory infections. It
was necessary to create this original instrument because the medical records did not mention the International Classification of Diseases (ICD) or any other classification of the symptoms and clinical diagnoses that would allow data stand-ardization.
Due to the various forms of clinical manifes-tations caused by the reduction in the bronchial lumen and the absence of standardized annota-tions, the field “asthma” was checked whenever the medical records indicated bronchial asthma, bronchiolitis, chest wheezing or wheezing, which are frequently related to obstructive diseases of the airways in children. This procedure was necessary because the medical annotations fre-quently referred merely to a sign or symptom, without mentioning a probable diagnosis.
Hourly concentrations of particulate matter with aerodynamic volume of up to 10 microns (PM10), sulphur dioxide (SO2), nitrogen dioxide
(NO2), carbon monoxide (CO), and ozone (O3)
were recorded from an automatic monitoring station located centrally in Jacarepaguá, and the daily averages of these pollutants were used as the indicators of the population’s exposure to air pollution. The following criteria were used in or-der to obtain the daily exposure for each pollut-ant: for PM10, SO2, and NO2, at least 75% of the
hourly measures should be observed; for O3, the
maximum concentration during daylight time (6 am to 6 pm) was taken when at least 75% of the measures were observed; and for CO, the maxi-mum of an 8-hour running average if 75% of the daily data were available.
During the study period, technical problems caused several interruptions in the monitoring of pollutants. By the end, there were records for 246 days of PM10, 201 days of NO2, 244 days of CO,
237 days of O3, and only 194 days of SO2. Given
the important gap in the environmental data on SO2, the choice was made not to analyse the
res-piratory effects of this pollutant.
Flaws occurred in monitoring, both in short sequences of days and long periods of several consecutive days: 08-30 September 2002, 1st
De-cember 2002 to 15 January 2003, and 10 Febru-ary 2003 to 16 March 2003. In order to minimize possible spurious associations, information was imputed from monitors located in other areas of the city for gaps on single days or short periods. The high correlation between the environmen-tal pollutant levels measured in Jacarepaguá and these other areas allowed the use of a data im-putation procedure. The methodology adopted in the imputation process was similar to that de-scribed by Junger et al. 11, in which the estimates
monitoring stations and the autocorrelation for this pollutant level in the same monitoring sta-tion over time.
The choice to replace only the gaps from short intervals meant that the total observation period for PM10 and CO was 262 out of 365 days.
The amount of data was smaller for NO2 and O3,
250 and 248 respectively, because the replace-ment option only included one station.
Daily data on meteorological conditions: rel-ative humidity and minimum, mean and maxi-mum temperatures were measured in a station located close to the study region. Information on weather conditions from the current day, the two previous days, and the mean for the two previous days were used in the analysis. Rainfall was also considered in the model due to the occasional showers during the summer time, which often cause floods in some areas of the city and, there-fore, limits people’s access to health care units.
The outcome variable – emergency paedi-atric visits due to obstructive bronchial symp-toms – was stratified by age brackets: ≤ 2 years, 2-6 years, and 6-12 years. The exposure variables were mean daily concentration of the air pollut-ants PM10, NO2, CO, and O3. Time trend,
season-ality, weather conditions, anomalous days over the course of the year, epidemics of respiratory infections were the potential confounding vari-ables regarded in the model. A Poisson regression model was used, since the outcome variable con-sisted of counts of events.
In the estimation of the effects of air pollut-ants on health, the confounders showing daily fluctuations needed to be accounted for. Gen-eralized additive models (GAM) have been used for this purpose, since they are quite flexible, al-lowing for the inclusion oif parametric and non-parametric structures in the same model. This study used splines (data smoothing functions) to adjust for the effects of time trends and long-term seasonality as well as the effects of meteoro-logical variables.
The days of the week that showed anomalous behaviour, like weekends, holidays, days between holidays and weekends, and days on which the 2002 Football World Cup matches were held were also included in the regression models as indica-tor variables.
It was not possible to estimate the effect of airborne allergens (like pollen and fungi) in rela-tion to air pollutants, since no systematic records were found in Rio de Janeiro.
To investigate respiratory infection epidem-ics, we drew on records for paediatric hospital admissions due to pneumonia in the city of Rio de Janeiro from April 2002 to March 2003, ob-tained from the database of the Unified National
Health System (DATASUS; http://www.datasus. gov.br). Diagnoses of pneumonias were selected according to the ICD, 10th revision (ICD-10: J12
to J18) 12. The methodology used in the
determi-nation of epidemic periods was similar to that reported by Braga et al. 13. Adjustment of this
variable used cubic polynomials for each epi-demic period.
Acute respiratory manifestations related to air pollutants can display several days of lag in rela-tion to exposure. This study analysed the air pol-lution levels on the day of the paediatric visit (D0) and the three previous days (D1, D2, D3). The cu-mulative effect was evaluated with the running means of the pollutant levels from two to seven days (mm2, mm3, mm4, mm5, mm6, mm7).
Poisson regression equations directly pro-duce relative risk values. In this paper risk values correspond to an increase of 10µg/m3 in each
pol-lutant level analysed separately, with the excep-tion of CO, for which an increase of 1,000µg/m3
was considered. A 5% significance level was ad-opted for the study. Results were also reported as percentage variation in paediatric visits.
The study protocol was submitted to the Re-search Ethics Committee of the Social Medicine Institute at the State University of Rio de Janeiro and was approved at a meeting held on 19 June 2002.
Results
From April 2002 to March 2003, there were 45,595 emergency paediatric visits due to respiratory disorders. Symptoms of lower airways obstruc-tion accounted for approximately 42% of all visits due to lower airways symptoms. In relation to children’s age, those under 2 years of age com-prised 2,841 visits and those from aged between 2 and 6 and over 6 comprised 2,893 and 1,067 visits, respectively.
During the study period there was no viola-tion of the air quality standards recommended by the National Environmental Commission (CONAMA). The CONAMA resolution states that the primary standards are those pollutant con-centrations that if exceeded may cause harmful effects on the exposed population. The recom-mended primary limit for PM10 is 150µg/m3, for
O3 is 160µg/m3, for NO2 is 320µg/m3, and for
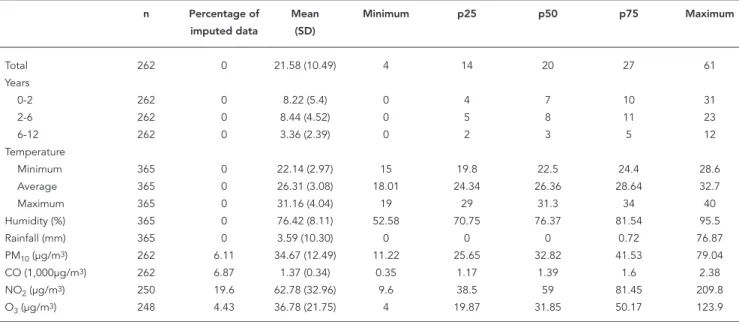
CO 10,000µg/m314. Table 1 shows the
descrip-tive statistics for the environmental and health variables.
The Pearson correlation coefficients between air pollutants (with the exception of CO and O3)
In children less than 2 years of age, an in-crease of 10µg/m3 in the environmental
concen-tration of PM10 was associated with an increase of
nearly 7% in the demand for emergency paediat-ric care due to airways obstruction (p < 0.01). The same value for O3 exposure led to a smaller effect,
some 3%, in the same age bracket, with marginal statistical significance (p < 0.06). The estimates of acute respiratory effects in the children as a whole and in the other age groups did not show positive or statistically significant associations.
Figure 1 provides graphic representation of the percentage variations in all emergency pae-diatric visits due to the symptoms of bronchial obstruction in children less than 2 years of age.
All the results are summarized in Table 2.
Discussion
The results suggest that exposure to air pollut-ants was associated with a significant increase in emergency paediatric visits due to symptoms of bronchial obstruction in children under the age of 2.
Statistical analysis in ecological studies with daily time series data, considering long and me-dium-term temporal variations, requires that the series be sufficiently long for the phenomena to be shown and the results unbiased. The
observa-tion period, with a maximum of 262 days for the majority of the pollutants, was the principal limi-tation in this study, although gaps in monitoring of pollutants were not related to the air pollution levels.
Farhat et al. 15, Atkinson et al. 16 and Lin et
al. 17 found positive and significant associations
between exposure to air pollutants and symp-toms of bronchial obstruction in children, with-out taking age into account. Conversely, in this study, the absence of a significant result when all age ranges were analysed together may have been due to a dilution of the effects since the outcome included the entire paediatric popula-tion.
The impact of the exposure to PM10 was
con-centrated in children under 2. This age bracket has specific characteristics that distinguishes it from others ages. Therefore, our findings high-light the importance of this specificity in the outcome. One hypothesis is that air pollution did not influence the demand for emergency paediatric care due to bronchial asthma (a com-mon immunological disease in older children). On the other hand, in children under 2 years of age, the demand for medical care for symptoms of bronchial obstruction, frequently associated with viral agents in this age group, was associated with PM10 and also with O3 (although a weaker
association in the latter case). One can conclude
Table 1
Descriptive statistics for environmental variables and emergency paediatric visits due to symptoms of bronchial obstruction, by age range, between April 2002 and March 2003.
n Percentage of Mean Minimum p25 p50 p75 Maximum
imputed data (SD)
Total 262 0 21.58 (10.49) 4 14 20 27 61
Years
0-2 262 0 8.22 (5.4) 0 4 7 10 31
2-6 262 0 8.44 (4.52) 0 5 8 11 23
6-12 262 0 3.36 (2.39) 0 2 3 5 12
Temperature
Minimum 365 0 22.14 (2.97) 15 19.8 22.5 24.4 28.6
Average 365 0 26.31 (3.08) 18.01 24.34 26.36 28.64 32.7
Maximum 365 0 31.16 (4.04) 19 29 31.3 34 40
Humidity (%) 365 0 76.42 (8.11) 52.58 70.75 76.37 81.54 95.5
Rainfall (mm) 365 0 3.59 (10.30) 0 0 0 0.72 76.87
PM10 (µg/m3) 262 6.11 34.67 (12.49) 11.22 25.65 32.82 41.53 79.04
CO (1,000µg/m3) 262 6.87 1.37 (0.34) 0.35 1.17 1.39 1.6 2.38
NO2 (µg/m3) 250 19.6 62.78 (32.96) 9.6 38.5 59 81.45 209.8
O3 (µg/m3) 248 4.43 36.78 (21.75) 4 19.87 31.85 50.17 123.9
that the reduced dimensions of airways in small-er children, exacsmall-erbating the clinical manifesta-tions of viral infection, made these children more susceptible to the effects of pollutants than the immune alterations characteristic of bronchial asthma. This result can also be explained by the parents’ greater concern over health problems in younger children, demanding immediate medi-cal care, even for less severe cases. On the other hand, in older children, the respiratory symptoms that can appear after exposure either were not se-vere enough to require emergency care or were treated later, outside the observation period.
Few studies have taken childhood anatomi-cal and functional variations into consideration,
categorizing the respiratory effects of air pollut-ants by age bracket. This limits a broad evalua-tion of the consistency of results. Braga et al. 18,
in São Paulo, Brazil, investigated hospital admis-sions due to respiratory causes according to four age groups of children and adolescents. There were more admissions for increased exposure to PM10, O3, SO2, CO, and NO2 among children aged
under 2, equivalent to an interquartile interval. A greater effect occurred with PM10, and with the
exception of O3, it was possible to reject the null
hypothesis with 99.9% probability. However, the study did not analyse the respiratory diagnoses related to the admissions, which precludes com-parison with our study in Jacarepaguá.
Figure 1
Percentage variation (RR) and 95% confi dence intervals for paediatric visits due to obstructive bronchial symptoms in children less than 2 years of age.
1a) PM10 1b) NO2
1c) CO 1d) O3
An increase in the concentration of PM10 was
associated with more emergency visits in chil-dren aged between 6 and 12. In this age group, obstructive airway symptoms are more likely the
result of the immune phenomena of bronchial asthma than in younger children. This effect, al-though not statistically significant, was observed on the day of exposure, on the previous days, and
Table 2
Percentage variation (RR) and 95% confi dence intervals (95%CI) for paediatric visits due to obstructive bronchial symptoms in children.
Outcome/Exposure Pollutant
PM10 CO NO2 O3
RR (95%CI) RR (95%CI) RR (95%CI) RR (95%CI)
All ages
Concurrent day 1.54 (-1.50; 4.69) -0.25 (-1.33; 0.84) -0.35 (-1.41; 0.72) 0.01 (-1.97; 2.04) 1 day lag 0.98 (-2.20; 4.27) 0.04 (-1.05; 1.14) 0.58 (-0.46; 1.64) -0.80 (-2.94; 1.39) 2 day lag -0.31 (-3.49; 2.97) 0.91 (-0.19; 2.03) 0.03 (-1.07; 1.14) -0.80 (-3.21; 1.66) 3 day lag -0.35 (-3.26; 2.64) -0.28 (-1.41; 0.86) -0.04 (-1.03; 0.97) 1.02 (-1.03; 3.11) 2 day average 1.62 (-1.82; 5.19) -0.19 (-1.57; 1.22) 0.26 (-0.84; 1.37) -0.60 (-2.88; 1.73) 3 day average 1.36 (-2.46; 5.34) 0.52 (-1.12; 2.20) 0.25 (-1.05; 1.55) -0.66 (-3.76; 2.54) 4 day average 1.26 (-2.73; 5.43) 0.24 (-1.64; 2.15) 0.51 (-0.83; 1.88) 0.78 (-2.62; 4.29) 5 day average 1.45 (-2.64; 5.70) 0.46 (-1.60; 2.57) 0.42 (-0.99; 1.85) 0.82 (-2.69; 4.46) 6 day average 1.36 (-2.79; 5.69) 0.08 (-2.10; 2.30) 0.33 (-1.07; 1.75) 0.18 (-3.21; 3.69) 7 day average 1.28 (-2.97; 5.71) -0.10 (-2.38; 2.23) 0.51 (-0.98; 2.03) -1.07 (-4.56; 2.55) < 2 years old
Concurrent day 6.53 (1.78; 11.51) -0.21 (-1.82; 1.42) -0.46 (-2.16; 1.26) 2.90 (-0.27; 6.18) 1 day lag 0.60 (-3.98; 5.39) 0.03 (-1.60; 1.69) 1.20 (-0.39; 2.82) 0.92 (-2.43; 4.38) 2 day lag 0.24 (-4.04; 4.72) 1.04 (-0.59; 2.70) -0.07 (-1.59; 1.47) -0.25 (-3.48; 3.09) 3 day lag 1.76 (-2.39; 6.09) -1.64 (-3.22; -0.03) -0.36 (-1.85; 1.15) 2.94 (-0.11; 6.08) 2 day average 5.44 (0.12; 11.04) -0.17 (-2.30; 2.00) 0.82 (-0.89; 2.57) 4.08 (0.17; 8.14) 3 day average 4.39 (-1.22; 10.31) 0.74 (-1.80; 3.35) 0.96 (-1.03; 3.00) 4.52 (-0.65; 9.95) 4 day average 4.40 (-1.34; 10.49) -0.76 (-3.58; 2.15) 0.49 (-1.49; 2.52) 5.82 (0.53; 11.39) 5 day average 5.10 (-0.80; 11.36) -0.65 (-3.71; 2.51) 0.90 (-1.19; 3.03) 5.29 (-0.09; 10.97) 6 day average 5.22 (-0.83; 11.63) -1.90 (-5.10; 1.41) 0.03 (-2.03; 1.41) 2.85 (-2.21; 8.17) 7 day average 4.68 (-1.49; 11.23) -2.19 (-5.54; 1.28) 0.27 (-1.91; 2.51) 0.90 (-4.30; 6.39) 2-6 years old
Concurrent day -1.67 (-5.53; 2.36) -0.15 (-1.60; 1.32) 0.44 (-1.07; 1.97) -1.94 (-4.71; 0.92) 1 day lag 0.90 (-3.37; 5.36) 0.84 (-0.63; 2.34) 0.43 (-1.09; 1.96) -2.85 (-5.87; 0.27) 2 day lag 0.70 (-3.57; 5.17) 1.77 (0.28; 3.27) 1.31 (-0.27; 2.92) -2.79 (-6.14; 0.68) 3 day lag -0.24 (-4.10; 3.77) 1.54 (0.01; 3.09) 1.17 (-0.24; 2.60) 0.71 (-2.26; 3.77) 2 day average -0.74 (-5.21; 3.95) 0.58 (-1.31; 2.49) 0.40 (-1.19; 2.01) -3.79 (-6.97; -0.50) 3 day average -0.38 (-5.39; 4.90) 1.95 (-0.30; 4.25) 1.23 (-0.63; 3.12) -5.38 (-9.57; -0.99) 4 day average -0.10 (-5.33; 5.43) 3.02 (0.42; 5.68) 1.63 (-0.34; 3.63) -4.75 (-9.36; 0.10) 5 day average -0.32 (-5.63; 5.30) 3.00 (0.16; 5.92) 1.70 (-0.37; 3.82) -3.45 (-8.35; 1.71) 6 day average -0.93 (-6.33; 4.77) 3.06 (0.05; 6.15) 1.94 (-0.14; 4.06) -2.85 (-7.63; 2.19) 7 day average -1.56 (-7.07; 4.27) 2.28 (-0.85; 5.51) 2.15 (-0.09; 4.44) -4.88 (-9.81; 0.31) 6-12 years old
taking accumulated exposure indicators into ac-count. The small daily mean number of visits by children in this group (some three per day) may have been insufficient to reach statistical power.
As in our study in Rio de Janeiro, in Seattle, U.S.A. 19,20 and Santa Clara County, California,
U.S.A. 21, PM
10 was associated with increased
emergency paediatric visits due to acute exac-erbation of bronchial asthma. Recent studies have suggested that increased use of diesel fuel in automobiles in large metropolises and the particles produced by diesel exhaust may be as-sociated with the increase in allergic respiratory diseases 22.
As for the impact of air pollutants on bronchi-al asthma, O3 is the most extensively investigated
agent 5. Numerous epidemiological studies have
highlighted the importance of O3 and
demon-strated a relationship between its environmen-tal concentration and bouts of acute bronchial asthma 23,24,25,26,27,28,29.
In principle, the body’s response to acute ag-gressions in the airways does not comply with the clinical manifestations observed in a 24-hour period, unless the effects show very low intensity. Similar epidemiological studies have shown that the greater demand for emergency care remains for a few days after the exposure to higher levels of air pollution 30,31. In Jacarepaguá, during the
study period, lower levels of environmental pol-lutants were observed, and is possible that the effect due to an increase in levels of the exposure may have been brief and mild, hence, quickly solved without the need for medical care. In ad-dition, it is possible that the more susceptible children might have shown greater demand for medical assistance.
The temporal distribution of the paediatric visits in Jacarepaguá suggests higher incidence of symptoms at the beginning of winter in chil-dren of all age brackets. Another peak in paediat-ric visits is observed in spring, only in the series for children over 2 years of age. Physiologically, the allergic reactions that are characteristic of bronchial asthma appear after the preschool pe-riod, and in our study they could correspond to the second peak of bronchial symptoms in older children only. Pollens are known respiratory al-lergens, and this time of year corresponds to the pollination stage of several species of flowers in many countries when the amount of pollen in the air increases followed by a higher incidence of respiratory symptoms in allergic individuals. Still, the inclusion of indicators of environmental pollen levels as a possible confounding factor in the association between air pollutants and respi-ratory effects has not always caused significant alterations 23,32,33. Further, it was not possible to
assess this effect in the current study because the available information is conflicting on pollen species and periods of pollination, and the en-vironmental pollen levels are not systematically monitored in Rio de Janeiro.
The sources of pollutants in Jacarepaguá are particular, diverse, and different from other ar-eas of the city of Rio de Janeiro and may yield an inhaled air composition that at least partially explains the observed results. Apparently, the burning of fossil fuels in vehicle engines and in-dustrial emissions share the responsibility for the composition of the inhaled air pollutants in Jaca-repaguá. The large industrial park sited in this area probably contributes heavily to the air pol-lution levels, since there are some two hundred installed plants 34.
An information bias may arise when the dependent variable includes information from emergency medical services. When paediatric populations are involved, the errors can result from both mistaken information supplied by the children’s parents or guardians and the hasty and erroneous medical diagnostic impressions that are common in emergency settings. Diagnostic errors are frequent in bronchial asthma due to the variety of clinical symptoms that asthma can produce in children 27. However, this bias is
gen-erally non-differential, since during the medical consultation the health professional is unaware of air pollutant levels. In a study in São Paulo, all the clinical diagnoses were confirmed by two physicians, which probably reduced the inci-dence of bias in the study 17.
In order to decrease respiratory diagnostic er-rors arising from the similarity between manifes-tations of viral infections and bronchial asthma, Fauroux et al. 26 and Chew et al. 35 did not include
younger children in the study population and Farhat et al. 15 adopted the term “obstructive
dis-eases” to designate manifestations of bronchial obstruction in childhood in all age brackets. In the current study we chose to use the term “ob-structive symptoms of the airways” for respira-tory manifestations due to both aetiologies.
It is worthy noting that Rio de Janeiro city shows relevant local differences regarding its to-pography, and the city contains three air basins. Jacarepaguá is located in air basin II, so the trans-port mechanisms implicated in the dispersion of pollutants may differ across the city. Therefore, the domain of the study may not be extendible to the entire city due to differences in the com-position of the particulate matter. Besides, it is known that PM10 concentrations also show local
variations.
of daily emergency room visits due to obstruc-tive symptoms of the airways associated with environmental levels of PM10 indicates the
ex-istence of an important public health problem in the city of Rio de Janeiro. A borderline-sig-nificant increase of 3% in emergency paediatric
visits due to ozone indicates the need to iden-tify and attenuate the sources of air pollution in Jacarepaguá. A major contribution will certainly come from spatial analysis of these data, which is under development.
Resumo
O objetivo deste trabalho foi estimar a associação en-tre os níveis dos poluentes atmosféricos e sintomas res-piratórios em crianças. Foi realizado um estudo eco-lógico de séries temporais, entre abril de 2002 e março de 2003, com dados diários de PM10, SO2, CO, NO2 e O3 e dos atendimentos pediátricos de emergência ocasio-nados por sintomas de obstrução brônquica. As vari-áveis de confusão foram: tendência temporal, sazona-lidade, fatores meteorológicos, infecções respiratórias e os efeitos dos finais de semana e feriados. Regressão de Poisson semiparamétrica foi usada para modelar as séries temporais. Curvas suaves, splines, variáveis indicadoras e polinômios cúbicos foram empregadas para corrigir os efeitos dos fatores de confundimento. Foi adotado o nível de significância de 5%. Um incre-mento estatisticamente significativo dos atendimen-tos, de 6,7%, esteve associado com PM10 nas crianças menores do que dois anos. Associação positiva com o O3, em torno de 3%, nessa faixa etária, teve significado estatístico limítrofe (p < 0,06). Esses resultados eviden-ciam um problema de saúde pública não reconhecido no Rio de Janeiro, Brasil, que reforça a necessidade de identificação das principais fontes de poluição.
Poluição do Ar; Asma; Criança
Contributors
M. Moura was in charge of all steps of the study and also in planning and elaborating the manuscript, data analyses, and drafting of the manuscript. W. L. Junger and A. Ponce de Leon were in charge of planning the study, data analyses and revision of the manuscript. G. A. S. Mendonça participated in planning the study and in the revision of the manuscript.
Acknowledgments
References
1. O’Connell E. Pediatric allergy: a brief review of risk factors associated with developing allergic disease in childhood. Ann Allergy Asthma Immunol 2003; 90(6 Suppl 3):53-8.
2. Ball TM, Castro-Rodriguez JA, Griffith KA, Holberg CJ, Martinez FD, Wright AL. Siblings, day-care at-tendance, and the risk of asthma and wheezing during childhood. N Engl J Med 2000; 343:538-43. 3. Ramsey CD, Celedón JC. The hygiene hypothesis
and asthma. Curr Opin Pulm Med 2004; 11:14-20. 4. Masoli M, Fabian D, Holt S, Beasley R; Global
Ini-tiative for Asthma (GINA) Program. The global burden of asthma report: executive summary of the GINA Dissemination Committee report. Al-lergy 2004; 59:469-78.
5. Bernstein JA, Alexis N, Barnes C, Bernstein IL, Bernstein JA, Nel A, et al. Health effects of air pol-lution. J Allergy Clin Immunol 2004; 114:1116-23. 6. Hiltermann TJ, Stolk J, van der Zee SC, Brunekreef
B, de Bruijne CR, Fisher PH, et al. Asthma Sever-ity and SusceptibilSever-ity to Air Pollution. Eur Respir J 1998; 11:686-93.
7. Wright AL. Epidemiology of asthma and recurrent wheeze in childhood. Clin Rev Allergy Immunol 2002; 22:33-44.
8. Gern JE. The spectrum of severe wheezing in child-hood. J Allergy Clin Immunol 2004; 114:236-8. 9. Buchdahl R, Parker A, Stebbings T, Babiker A.
Asso-ciation between air pollution and acute childhood wheezy episodes: prospective observational study. BMJ 1996; 312:661-5.
10. Boechat JL, Rios JL, Sant’anna CC, França AT. Pre-valência e gravidade de sintomas relacionados à asma em escolares e adolescentes no município de Duque de Caxias, Rio de Janeiro. J Bras Pneu-mol 2005; 31:111-7.
11. Junger W, Santos N, Ponce de Leon A. Missing data imputation in multivariate time series via EM al-gorithm. Cadernos do IME 2003; 15:8-21.
12. Organização Mundial da Saúde. Classificação es-tatística internacional de doenças e problemas re-lacionados à saúde, 10a revisão. São Paulo: Centro Colaborador da OMS para a Classificação de Do-enças em Português; 1995.
13. Braga ALF, Zannobetti A, Schwartz J. Do respira-tory epidemics confound the association between air pollution and daily deaths? Eur Respir J 2000; 16:723-8.
14. Brasil. Resolução CONAMA nº. 003, de 28 de junho de 1990. Diário Oficial da União 1990; 22 ago. 15. Farhat SCL, Paulo RL, Shimoda TM, Conceição GM,
Lin CA, Braga ALF, et al. Effect of air pollution on pediatric respiratory emergency room visits and hospital admission. Braz J Med Biol Res 2005; 38:227-35.
16. Atkinson RW, Strachan DP. Role of outdoor aeroal-lergens in asthma exacerbations: epidemiological evidence. Thorax 2004; 59:277-8.
17. Lin CA, Martins MA, Farhat SC, Pope 3rd CA, Con-ceição GM, Anastácio VM, et al. Air pollution and respiratory illness of children in São Paulo, Brazil. Paediatr Perinat Epidemiol 1999; 13:475-88.
18. Braga AL, Saldiva PH, Pereira LA, Menezes JJ, Con-ceição GM, Lin CA, et al. Health effects of air pollu-tion exposure on children and adolescents in São Paulo, Brazil. Pediatr Pulmonol 2001; 31:106-13. 19. Norris G, YoungPong SN, Koening JQ, Larson TV,
Sheppard L, Stout JW. An association between fine particles and asthma emergency department vis-its for children in Seattle. Environ Health Perspect 1999; 107:489-93.
20. Schwartz J, Larson TV, Pierson WE, Koenig JQ. Particulate air pollution and hospital emergency room visits for asthma in Seattle. Am Rev Respir Dis 1993; 147:826-31.
21. Lipsett M, Hurley S, Ostro B. Air pollution and emergency room visits for asthma in Santa Clara County, California. Environ Health Perspect 1997; 105:216-22.
22. Pandya RJ, Solomon G, Kinner A, Balmes JR. Die-sel exhaust and asthma: hypotheses and molecu-lar mechanism of action. Environ Health Perspect 2002; 110 Suppl 1:103-12.
23. Galán I, Tobías A, Banegas JR, Aránguez E. Short-term effects of air pollution on daily asthma emer-gency room admissions. Eur Respir J 2003; 22: 802-8.
24. Sunyer J, Spix C, Quénel P, Ponce de Leon A, Pönka A, Barumandzadeh T, et al. Urban air pollution and emergency admissions for asthma in four European cities: the APHEA Project. Thorax 1997; 52:760-5.
25. Tenias JM, Ballester F, Rivera ML. Association be-tween hospital emergency visits for asthma and air pollution in Valencia, Spain. Occup Environ Med 1998; 55:541-7.
26. Fauroux B, Sampil M, Quénel P, Lemoullec Y. Ozone: a trigger for hospital pediatric asthma emergency room visits. Pediatr Pulmonol 2000; 30:41-6.
27. Romieu I, Meneses F, Sienra-Monge JJ, Huerta J, Velasco SR, White MC, et al. Effects of urban air pollutants on emergency visits for childhood asthma in Mexico City. Am J Epidemiol 1995; 141: 546-53.
28. Stieb DM, Burnett RT, Beveridge RC, Brook JR. Association between ozone and asthma emer-gency department visits in Saint John, New Bruns-wick, Canada. Environ Health Perspect 1996; 104:1354-60.
29. Yang W, Jennison BL, Omaye ST. Air pollution and asthma emergency room visits in Reno, Nevada. Inhal Toxicol 1997; 9:15-29.
30. Peel JL, Tolbert PE, Klein M, Metzger KB, Flanders WD, Todd K, et al. Ambient air pollution and respi-ratory emergency department visits. Epidemiology 2005; 16:164-74.
32. Anderson HR, Ponce de Leon A, Bland JM, Bower JS, Emberlin J, Strachan DP. Air pollution, pollens, and daily admissions for asthma in London 1987-92. Thorax 1998; 53:842-8.
33. Hajat S, Haines A, Goubet SA, Atkinson RW, An-derson HR. Associations of air pollution with daily GP consultations for asthma and other lower res-piratory conditions in London. Thorax 1999; 54: 597-605.
34. Federação das Indústrias do Rio de Janeiro. Cadas-tro industrial do Estado do Rio de Janeiro. Rio de Janeiro: Federação das Indústrias do Rio de Janei-ro; 2005.
35. Chew FT, Goh DYT, Ooi BC, Saharom R, Hui JK, Lee BW. Association of ambient air-pollution levels with acute asthma exacerbation among children in Singapore. Allergy 1999; 54:320-9.
Submitted on 06/Jul/2007