Rev Saúde Pública 2004;38(5) www.fsp.usp.br/rsp
Correspondence to:
Lourdes C Martins
Rua Abraham Bloemaert, 126 Jd. das Vertentes 05541-320 São Paulo, SP, Brasil
E-mail: [email protected]
Based on master’s dissertation presented to the Federal University of Paraná, 2003. Received on 3/6/2003. Reviewed on 8/1/2004. Approved on 15/3/2004.
Air pollution and respiratory diseases among
children in Brazil
Sonia M aria Cipriano Bakonyia, Inês M oresco D anni-O liveiraa, Lourdes Conceição
M artinsb and Alfésio Luís Ferreira Bragac
aDepartamento de Geografia. Universidade Federal do Paraná (UFPR). Curitiba, PR, Brasil.
bLaboratório de Poluição Atmosférica Experimental. Faculdade de Medicina. Universidade de São
Paulo. São Paulo, SP, Brasil. cPrograma de Pediatria Ambiental. Faculdade de Medicina. Universidade
de Santo Amaro. São Paulo, SP, Brasil
Keywords
Air pollution, adverse effects. Child health (public health). Respiratory diseases. Times series.
Abstract
Objective
To assess the effects of air pollution levels on respiratory morbidity among children from 1999 to 2000.
Methods
Daily records of health center attendance due to respiratory diseases among children were obtained from the public health system in Curitiba, State of Paraná, Brazil. Daily levels of particulate matter (PM10), smoke, NO2 and O3 were obtained from both Paraná State Environmental Institute and the Development Technology Institute, a non-governmental agency. Daily measurements of temperature and relative humidity were obtained from the National Institute of Meteorology. Generalized additive Poisson regression models were used to assess the relationship between respiratory diseases and air pollution, controlling for long-term seasonality using loess (a non-parametric smoothing function), weather and weekdays. A significance level of 5% was adopted in all the analyses.
Results
All pollutants presented an effect on respiratory diseases among children. An increase of 40,4 µg/m3 in the 3-day moving average of smoke was associated with an increase of 4.5% (95% CI: 1.5-7.6) in the attendance of children with respiratory diseases. Conclusion
The results suggest that air pollution promotes adverse effects on children’s respiratory health even when pollutant levels are lower than the air quality standards.
INTRODUCTION
The problems stemming from air pollution started to be considered as a question of public health from the time of the industrial revolution, when today’s urban development system began. In the 1980s, Brazil’s urban development rate reached a level of 68.9%. At that time, the population growth of the Curitiba metropolitan re-gion (State of Paraná) was 5.8% per year, much greater than in the other metropolitan regions of Brazil.11,14
Although this growth diminished during the fol-lowing decade (to 3% per year), the city of Curitiba
has not emerged unscathed from this process. This can today be perceived through a variety of factors, among which the air quality and its possible reper-cussions in the form of respiratory diseases.
Rev Saúde Pública 2004;38(5) www.fsp.usp.br/rsp Poluição e doença respiratória em criança
Bakonyi SMC et al
tion coefficient was calculated between the air pol-lutants and the number of individuals attended at the health centers per day, and also in relation to the at-mospheric variables, with the aim of verifying whether these data presented linear associations.
The number of children attended as outpatients each day because of respiratory diseases (ICD-9: 460 to 519) was considered to be the dependent variable, and the mean daily pollutant levels for PM10, smoke, O3 and NO2 were the independent variables. The con-trol variables were the number of days elapsed (t=1, 2, 3, ...., N; where N is the last day of the series), for adjusting the long-term seasonality; the days of the week (indicator variable), for adjusting the short-term seasonality; the daily minimum temperature (°C); and the relative humidity of the air (%). The latter two were for controlling the meteorological effect.
The daily number of children attended because of respiratory diseases is a counted event and, for this rea-son, it presents Poisson’s distribution. Since the rela-tionships between the dependent variable and the con-trol variables are not necessarily linear, it is important to adopt a regression model that allows such relationships to be estimated in the most appropriate manner. To sat-isfy these two principles, generalized additive models (GAM)6 were adopted for Poisson’s regression, using nonparametric smoothing functions (loess).6
To control for long-term seasonality, the loess func-tion was utilized for removing the basic long-term sea-sonal patterns, thereby eliminating variability due to chance occurrences. The smoothing parameter for days elapsed was chosen in such a way as to obtain minimi-zation of the autocorrelation of model residues. To con-trol for short-term seasonality, an indicator variable for the days of the week was adopted. A linear relationship between the dependent variable and the air pollutants, minimum temperature and mean humidity was assumed.
The biological manifestations of the effects of pol-lution on health appear to present behavior that shows a lag in relation to the individual’s exposure to the polluting agents.3 In other words, attendance provided on a given day is probably related to the pollution on that day, but also to the pollution that there was on preceding days. Thus, it was decided to utilize daily values and moving averages over two and three days for the pollutants, in which, for example, the three-day moving average is the average for the pollution on the day in question and the two days preceding it.
With regard to defining the final regression model, the percentage increases in the number of children attended because of respiratory diseases, and their The lack of information regarding the relationship
between air pollution and respiratory diseases in the city prompted the investigation of such relationships in the present study. Thus, the objective of the study was to verify the relationship between air pollutants and morbidity due to diseases of the respiratory tract among the child population
M ETH O D S
This work is a time-series ecological study10 per-formed in the municipality of Curitiba, State of Paraná, Brazil. Daily records of the outpatient attend-ance of children with respiratory diseases at the city’s health centers within its public health system, were obtained from the Municipal Health Department. These data relate to the attendance of children within the age group of 0 to 14 years. The period assessed was from January 1, 1999, to December 31, 2000. The respiratory diseases were coded in accordance with the International Classification of Diseases, 9th Re-vision (ICD-9: 460 to 519).
Data on the daily levels of particulate matter (PM10) and smoke were obtained from the Paraná State Envi-ronmental Institute (Instituto Ambiental do Paraná), from measurements at a station. Data relating to nitro-gen dioxide (NO2) and ozone (O3) were supplied by the Development Technology Institute (Instituto de
Tecnologia para o Desenvolviment - Lactec), from
measurements at two stations (in Curitiba’s Industrial City and in the residential district of Santa Cândida). The averages from hourly measurements over 24-hour periods for NO2, PM10 and smoke and the peak hourly measurement for O3 were considered to be representa-tive of the daily concentrations of these pollutants.5 Braga et al3 (1999) showed that the averages of the daily levels of pollutants at each monitoring station adequately represented the mean pollutant levels in the city of São Paulo. On the basis of that study, the averages for the pollutants NO2 and O3 that were meas-ured in the two stations were calculated as representa-tive of the city’s mean levels.
Atmospheric data were obtained from the meteoro-logical station of the Polytechnic Center of the Na-tional Meteorology Institute (Instituto Nacional de
Meteorologia - INMET), which is located around 6
km from the center of the city of Curitiba. From read-ings taken at 9:00 a.m., 3:00 p.m. and 9:00 p.m., fig-ures for the daily averages for the relative humidity of the air and the minimum temperature, for the pe-riod from 1999 to 2000, could be obtained.
correla-!
Rev Saúde Pública 2004;38(5) www.fsp.usp.br/rsp
Poluição e doença respiratória em criança Bakonyi SMC et al
respective confidence intervals, were estimated for the interquartile variation (the difference between the third and first percentiles) in the concentrations of the pollutants.
The significance level of α=5% was adopted for all the regression analyses. The statistical packages uti-lized were SPLUS for Windows, version 4.5, and SPSS 10.0 for Windows.
RESU LTS
During the study period, 81,229 children were at-tended due to all the respiratory causes included in chapter VIII of ICD-9.
From Figure 1, it can be seen that in 1999 the PM10 exceeded the daily limit for air quality (150 µg/m3) twice, smoke six times and O3(160 µg/m3) twice. NO
2 did not ex-ceed its limit (320 µg/m3). For the year 2000, the PM10 again exceeded its limit twice and smoke just once, while NO2 and O3 did not exceed the acceptable levels for air quality def ined by the National Council for the Environment (Conselho Nacional do Meio
Ambiente - Conama)7
Table 1 presents the descriptive statistics for the daily levels of the air pollutants, mini-mum temperature, relative humidity of the air and respiratory diseases.
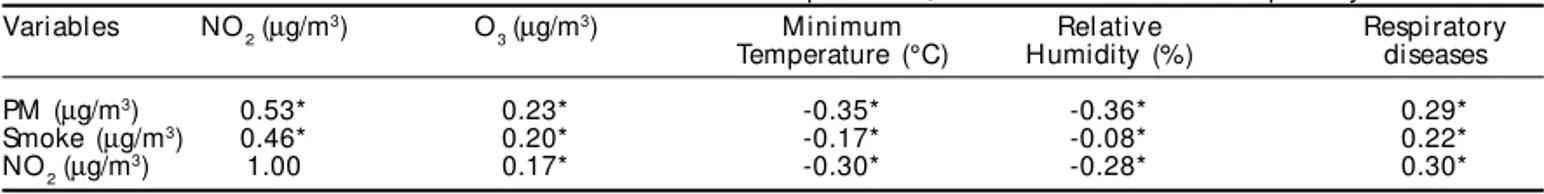
All the air pollutants were positively cor-related with each other (Table 2). The great-est correlation was found between the PM10 and NO2, thereby indicating a linear associa-tion between these pollutants.
An inversely proportional relationship was also observed between the pollutants, the minimum tem-perature and the relative humidity of the air. For the respiratory diseases, a positive and statistically sig-nificant correlation was seen between these and the PM10, smoke and NO2. The only correlation that was not statistically significant was with O3.
Table 3 presents the results from the generalized additive models for the study period. It can be seen that the association between the air pollution and attendance due to respiratory diseases was statisti-cally significant for the PM10, NO2 and smoke, both for the daily concentrations and for the two and Figure 1 - Daily mean concentrations for the pollutants analyzed in the
city of Curitiba (1999-2000). 0
50 100 150 200 250 300
01.01.99
0 50 100 150 200 250
0 40 80 120 160 200 240 280 320
0 50 100 150 200
O3 (
µ
g/m
3)
25.02.99 21.04.99 15.06.99 09.08.99 03.10.99 27.11.99 21.01.00 16.03.00 10.05.00 04.07.00 28.08.00 22.10.00 16.12.00
MP (
µ
g/m
3)
01.01.99 22.02.99 15.04.99 06.06.99 28.07.99 18.09.99 09.11.99 31.12.99 21.02.00 13.04.00 04.06.00 26.07.00 16.09.00 07.11.00 29.12.00
Smoke (
µ
g/m
3)
160 240 320
160 240
01.01.99 22.02.99 15.04.99 06.06.99 28.07.99 18.09.99 09.11.99 31.12.99 21.02.00 13.04.00 04.06.00 26.07.00 16.09.00 07.11.00 29.12.00
NO2 (
µ
g/m
3)
01.01.99 22.02.99 15.04.99 06.06.99 28.07.99 18.09.99 09.11.99 31.12.99 21.02.00 13.04.00 04.06.00 26.07.00 16.09.00 07.11.00 29.12.00
Table 1 - Descriptive analyses of the variables in the study.
Variables D ays (N ) M ean Standard deviation M inimum M axi mum
Pollutants
PM (µg/m3) 687 90.39 37.37 20.00 245.0
Smoke (µg/m3) 548 40.24 26.37 9.00 210.0
NO2(µg/m3) 672 27.17 21.32 5.32 179.19
O3 (µg/m3) 688 63.71 24.97 4.86 166.4
W eather
Temperature 727 12.97 4.55 -3.50 21.8
H umidity 728 85.35 7.09 58.70 99.50
Patients
No. of patients attended* 731 11.12 51.99 0.00 281.0
*The number of patients attended per day because of respiratory illnesses is a dependent variable controlled by minimum temperature, mean humidity, days of the week and long-duration seasonality.
Table 2 - Pairwise Pearson correlation coefficients between the pollutants, weather variables and respiratory diseases. Variables NO2 (µg/m3) O
3 (µg/m
3) M inimum Rel ati ve Respi ratory
Temperature (°C) Humidity (%) diseases
PM (µg/m3) 0.53* 0.23* -0.35* -0.36* 0.29*
Smoke (µg/m3) 0.46* 0.20* -0.17* -0.08* 0.22*
NO2 (µg/m3) 1.00 0.17* -0.30* -0.28* 0.30*
" Rev Saúde Pública 2004;38(5) www.fsp.usp.br/rsp Poluição e doença respiratória em criança
Bakonyi SMC et al
three-day moving averages, For the O3, only the three-day moving average presented a statistically significant effect. The relative risks were generally greater for the three-day moving averages, which demonstrates the cumulative effect of exposure to air pollutants. In the case of O3, the effect was also increasing and cumulative, although only the esti-mate for the three-day moving average presented statistical significance.
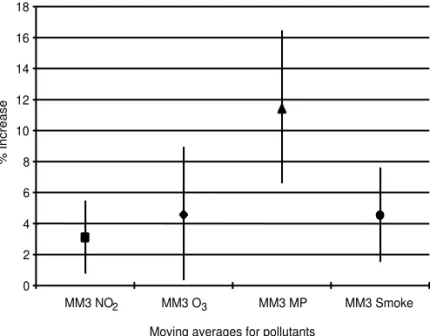
Figure 2 shows the percentage increases in outpa-tient attendance due to increases of one interquartile in the three-day moving averages for the pollutants. It can be noted that, for this lag period, all pollutants presented a positive and significant association with the outcome adopted.
D ISCU SSIO N
Although this was an ecological study,10 in which the study unit was a group of individuals that could represent a district, a city or even a country, rather than individual observation, it is stressed that such studies have been shown to be efficient with regard to dealing with the effects of pollution on health.1-4,8,9,12,13
The decision to work with the total number of respiratory diseases and not according to specific respiratory diseases came from the probability that, in so doing, the diversity of diagnoses among the various services that fur-nished the original data would be dimifur-nished. The use of increasingly sophisticated regres-sion models allowed the possible confound-ing factors that could interfere in the data analysis to be controlled with greater efficacy. The choice of GAM for the analysis came from the fact that this model allows for adjustment of nonlinear functions for variables that present such behavior. The utilization of Poisson’s regression allowed analysis of counted events, such as the number of chil-dren attended because of respiratory diseases.6
Positive associations were found between the pol-lutants (PM10, smoke, NO2 and O3) and respiratory diseases among children in Curitiba. These effects are similar to what has been found in other Brazilian cities, especially with regard to the findings from the city of São Paulo,3,4,8 both in relation to the diversity of the associated pollutants and the magnitude of the estimated effects.
The increased incidence of respiratory diseases dur-ing the colder periods of the year is due to two main factors: the low temperatures and the increases in the concentrations of primary pollutants.1,2,12,13 O
3 is a sec-ondary pollutant that depends on the presence of sun-light and precursors such as nitrogen oxides and hy-drocarbons.5 Dry winters with sunny days provide all the conditions for rises in the levels of this photochemi-cal agent, in the same way as happens in other seasons of the year. Thus, O3 did not present a high correlation with the other variables analyzed in the present study, since its concentration does not vary in the same way as for the other primary pollutants. Despite this, its oxidizing activity and capacity for inducing inflam-Table 3 - Regression coefficients, relative risk and the respective 95% confidence intervals for the pollutants included in the model. Pollutants Regression coefficient Standard error Relative risk 95% CI
NO2 0.00087 0.00037 1.0009 1.0001 -1.0016
NO2 - tw o-day average 0.00095 0.00039 1.0010 1.0002 -1.0017 NO2 - three-day average 0.001119 0.00043 1.0011 1.0003 -1.0020
O3 0.00035 0.000298 1.0004 0.9998 -1.0009
O3 - two-day average 0.00059 0.00031 1.0006 1.000 -1.0012
O3 - three-day average 0.0007 0.00033 1.0007 1.0001 -1.0013
PM 0.0008 0.00022 1.0008 1.0004 -1.0012
PM - tw o-day average 0.001 0.00024 1.0011 1.0006 -1.0016
PM - three-day average 0.001197 0.00025 1.0012 1.0007 -1.0017
Smoke 0.00074 0.0003 1.0007 1.0002 -1.0013
Smoke - tw o-day average 0.00098 0.00033 1.0010 1.0003 -1.0016 Smoke - three-day average 0.00035 0.00035 1.0011 1.0004 -1.0018
Figure 2 - Percentage increases in admissions of children for respiratory diseases caused by per-unit increases in the three-day moving averages (MM3) for NO2 (27.17 µg/m3), O
3 (63.71 µg/m
3), PM (90.39 µg/m3) and
smoke (40.24 µg/m3).
0 2 4 6 8 10 12 14 16 18
MM3 NO2 MM3 O3 MM3 MP MM3 Smoke
Moving averages for pollutants
#
Rev Saúde Pública 2004;38(5) www.fsp.usp.br/rsp
Poluição e doença respiratória em criança Bakonyi SMC et al
matory processes gives this pollutant the role of the villain in causing or aggravating respiratory diseases, as has been reported by other studies.4,8
NO2 was the only air pollutant that did not exceed the limits established for air quality, even though it was positively correlated with respiratory diseases. This reinforces the hypothesis that, even when such pollutants do not exceed the standard limits,5 they may cause effects that are harmful to health. The as-sociation between pollution and morbidity/mortal-ity does not display a safe level for pollutants: in other words, no safe level for pollution has been char-acterized such that, below this level, the pollution would not have any effect.3,9,12
Even though the analyses utilized models that in-cluded one or, at most, two pollutants, it is difficult to attribute the deleterious effects of air pollution on health to just one of these pollutants. The mixing of these elements in the atmosphere may modify their individual toxicity, thereby adding power to their in-dividual effects.
On the basis of the results found, it can be inferred that the air pollution levels in Curitiba, despite not being very high, or even when not exceeding the air quality standard (as in the case of NO2), do interfere in the morbidity profile of the child population in the city.
It is hoped that the results found will be useful, since they allow the risks to which the population is exposed to be measured, and provide backing for draw-ing up measures aimed at minimizdraw-ing such risks. Fur-thermore, the results contribute towards the planning of environmental or urban healthcare and towards improving public policies.
ACKN O W LED GEM EN TS
To the Instituto Ambiental do Paraná and to the Instituto de Tecnologia para o Desenvolvimento, for supplying the data relating to the air pollutants. To the Secretaria Municipal de Saúde, for supplying the data relating to daily attendance due to respira-tory diseases.
REFEREN CES
1. Anderson HR, Leon AP, Bland JM, Bower JS, Strachan DP. Air pollution and daily mortality in London: 1987-1992. BMJ 1996;312:665-9.
2. Atkinson RW, Anderson HR, Sunyer J, Ayres J, Baccini M, Vonk JM et al. Acute effects of particulate air pollution on respiratory admission: results from APHEA 2 project. Air pollution and health: a European Approach. Am J Respir Crit Care 2001;164(10 Pt 1):1860-6.
3. Braga ALF, Conceição GMS, Pereira LAA, Kishi HS, Pereira JCR, Andrade MF et al. Air pollution and pediatric respiratory hospital admissions in São Paulo, Brazil. J Environ Med 1999;1:95-102.
4. Braga ALF, Saldiva PHN, Pereira LAA, Menezes JJC, Conceição GMS, Lin CA et al. Health effects of air pollution exposure on children and adolescents in São Paulo, Brazil. Pediatr Pulmonol 2001;31:106-13.
5. [Cetesb] Companhia de Tecnologia de Saneamento Ambiental. Relatório de qualidade do ar no estado de São Paulo, 2002. São Paulo; 2003.
6. Hastie TJ, Tibshirani RJ. Generalized additive models. London: Chapman and Hall; 1995.
7. [IAP] Instituto Ambiental do Paraná. Relatório da qualidade do ar na região metropolitana de Curitiba, PR, 2000. Paraná; 2001.
8. Lin AC, Martins MA, Farhat SL, Pope III CA, Concei-ção GMS, Anastácio MV et al. Air pollution and respiratory illness of children in São Paulo, Brazil. Pediatr Perinat Epidemiol 1999;13:475-88.
9. Martins LC, Latorre MRDO, Cardoso MRA, Gonçal-ves FLT, Saldiva PHN, Braga ALF. Poluição atmosféri-ca e atendimentos por pneumonia e gripe em São Paulo, Brasil. Rev Saúde Pública 2002;36:88-94.
10. Morgenstern H. Ecologic Studies in epidemiology: concepts, principles, and methods. Ann Rev Public Health 1995;16:61-81.
11. Santos M. A urbanização brasileira. 3ª ed. São Paulo: Hucitec; 1996.
12. Schwartz J, Dockery DW. Particulate air pollution and daily mortality in Steubenville, Ohio. Am J Epidemiol 1992;135;12-9.
13. Schwartz J, Marcus A. Mortality and air pollution in London: a time series analysis. Am J Epidemiol 1990;131:185-94.