A PowerPoint-based guide to assist in
choosing the suitable statistical test*
David Normando**, Leo Tjäderhane***, Cátia Cardoso Abdo Quintão****
Abstract
Selecting appropriate methods for statistical analysis may be difficult, especially for the stu-dents and others in the early phases of the research career. On the other hand, PowerPoint presentation is a very common tool to researchers and dental students, so a statistical guide based on PowerPoint could narrow the gap between orthodontist and the Biostatistics. This guide provides objective and useful information about several statistical methods using ex-amples related to the dental field. A Power-Point presentation is employed to assist the user to find answers to common questions regarding biostatistics, such as the most appropriate sta-tistical test to compare groups, to make correlations and regressions or to look for casual and systematic errors for a specific method. Assistance to check normal distribution and to choose the most suitable graphics is also presented. This guide* could be even used by reviewers in a quick assessment to check the appropriated statistical methodology into a specific study.
Keywords:Biostatistics (Public Health). Health statistics. Statistics. Statistical databases. Interactive tutorial.
** Assistant Professor. Department of Orthodontics, Federal University of Pará- UFPa, Brazil.
*** Professor. Institute of Dentistry, University of Oulu, Oulu, Finland; and Oulu University Hospital, Oulu, Finland. **** Assistant Professor. Department of Orthodontics, State University of Rio de Janeiro- UERJ, Brazil.
INTRODUCTION
Statistical analysis is a very important tool in the validation of data obtained in a given study, as well as to a reliable extrapolation of these data for a population. Despite clinical decisions are routinely based on results of statistical analysis, it is quite common to find graduate dental students, clinicians and researchers showing a certain lack of understanding on how suitable statistics tests can be obtained. Several steps are important in the statistical analysis, a key point being the choice of the appropriate statistical test. Select-ing suitable statistical test would correspond ana-logically to a correct diagnosis for a clinician. A misunderstanding could lead the researcher to wrong conclusions.
This “gap” between health science research-ers and the undresearch-erstanding of mathematics and the statistical methods could justify the disin-terest of a considerable part of clinical research-ers and graduate students.6 The use of a clear comprehensive communication tool, such as presented here, using orthodontic subject ex-amples could bring biostatistics closer to the or-thodontics students and researchers. The main goal of this guide is to make statistical analysis more understandable, using dentist’s day to day language and a well-known tool, a visual Power-PointTM presentation. This guide could be even used by the reviewers in a quick assessment to check if the appropriate statistical methodol-ogy has been employed in a specific study. It is, however, important to emphasize that the aim of this quick guide is not to underestimate the role of the biostatistician, nor their search tools, textbooks and statistical softwares.
The choice of a statistical test requires the user to know: 1) the data type (continuous, cat-egorical: ordinal or nominal), 2) how this data is distributed after the completion of its collection (Normal or Free-distribution), and 3) the type of samples (independent or paired). A brief re-view is presented to introduce or remind the
reader about some basic principles. Some ar-ticles in the orthodontic literature are available as reference.4,5,7
Data Types
Basically, data may be classified as quantitative (continuous) or qualitative.4 Quantitative data is measured on an interval or ratio scale and mea-sures the data with number, such as tooth size in millimeters or incisor’s inclination evaluated in degrees. After data collection, it is possible to obtain a measure for the central tendency and an estimate of variability. The most commonly used estimate of averageness is the arithmetic mean and the most common estimate of variability is the standard deviation.
Qualitative or categorical data has a limited number of distinct values or categories (discrete variable) that are classified as Ordinal or Nomi-nal. Ordinal data should follow a crescent level of assignment order. The apical root resorption index,1 measured by an ordinal scale from 0 to 4, is an example of ordinal data. Each increas-ing score level reflects an increasincreas-ing severity of apical root resorption. However, it can not be said that someone with a root score resorption 1 (mild resorption) has the half of root resorption of someone with a root score resorption 2 (mod-erate resorption). One measurement (score) is not a parameter to another. Therefore, this kind of data may be also called non-parametric. The most commonly used estimate of averageness to ordinal data is the median value, the middle ob-servation point where half of values are higher and half are lower.
Data Distribution
There are two types of data distribution: Nor-mal and abnorNor-mal (also called free-distribution). Normal or Gaussian distribution takes approxi-mately the form of a bell-shaped curve when data is exposed in a curve of distribution. It can be seen that the data cluster around a central point and spread symmetrically around this cen-ter point. Many commonly used statistical tests, e.g. Student t-test, are based on parametric as-sumptions requiring a normal distribution.5
When the curve distribution is not a bell-shaped curve, it is called asymmetrical, abnor-mal or a free-distribution. Tests for abnorabnor-mally distributed data are called nonparametric. The use of a parametric statistic is more likely to de-tect a statistically significant difference between samples when the difference is real, but use of a parametric test when the normal distribution is violated is not a correct way to perform analysis.
Before analyzing the differences between the groups, it is necessary to check the distribution of the data. If continuous data is abnormally dis-tributed, it is necessary to choose a nonparamet-ric statistics or to transform data into a normal distribution, applying, for example, a log trans-formation.4
Paired and Unpaired sample
Samples can be easily classified as paired (or dependent) and unpaired (or independent).5 A common paired design occurs when a single group of subjects is measured before and after a procedure to examine the effect of some treat-ment. Independent samples are consisted of dif-ferent subjects on each group.
THE POWER POINT PRESENTATION
The goal of this tutorial is to produce in-formation on the appropriate statistical test for the analysis of the results. This information will be obtained through a system of questions and replies.
To use this guide, the presentation is opened and “Slide show” mode must be selected. The first slide describes the purpose and limitations of this tutorial. One limitation in this guide is that it cur-rently incorporates mainly statistical tests to stud-ies that examine one variable (UNIVARIATE). The choices regarding the multivariate analysis are limited. Although multivariate analyses are still less frequently used in dental research, their use is increasing. In these cases, consultation with a biostatistician is strongly recommended.
The second slide presents a selection of links that lead the user forward according to the need. There are 5 options (Fig 1):
1) I want to assess whether my data show a normal distribution.
2) I want to make comparisons between groups.
3) I want to make correlation or regression analysis.
4) I want to check the replicability of data (systematic error).
5) I want to choose the appropriate graphics to my data.
Clicking on the icon with arrow, a link will take the user to successive questions until a re-sponse will be obtained. To reach the correct an-swer, the user has to understand the 3 previously described basic items (data distribution, type of variable and sample classification).
1st option: I want to assess whether my data shows a normal distribution
2nd option: I want to make comparisons be-tween groups
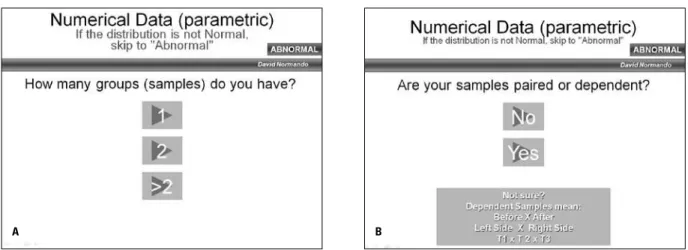
The second option of the presentation is an indication of the appropriated test for a statis-tical analysis comparing means. Means differ-ence analysis is the most usual statistical test employed in Orthodontics.2 When clicking on the icon, the user will have to answer what type of data—continuous, nominal or ordinal—was obtained (Fig 3). Then, the presentation will ask questions regarding the number of sample groups (Fig 4, A) and if examined groups are paired or not (Fig 4, B).
3rd option: I want to make correlation or re-gression analysis
The third option describes the statistical test for correlation tests or regression analysis (Fig 1). As well as in step 2 (Comparisons between groups), the user must choose the type of data (Fig 3) to get the answer (Fig 5).
4th option: I want to check the replicability of data (systematic and casual errors)
The error analysis of method is frequent in scientific research. In recent years, about 70% of the articles published in Orthodontics presented some type of error analysis.3 The observation of a systematic error of a method used by a researcher is usually achieved by making double measure-ments. These double data must show a high level of reproducibility or replicability.
The 4th option of this presentation concerns the review of systematic error. The steps to be performed are similar to the previous ones. After defining that you want to analyze the replicabil-ity of the data (Fig 1), the user must define what type of data you have (Fig 3), before the answer will be shown (Fig 6).
5th option: I want to choose the appropriate graphic to the data obtained
Usually the researcher is just focused on graph
FIGURE 2 - Suggested statistical tests to check normality in the data distri-bution. The icon “back to beginning” will lead the user to the second slide of the presentation (Fig 1).
FIGURE 3 - The first step for the selection of statistical test is the de-scription of the type of data. The user must click on one of the options to continue. It should be noted that if continuous data has an abnormal distribution the option “ordinal” (button) should be chosen.
FIGURE 5 - Answer page to suitable statistical test to make correlation or regression analysis of two continuous variables. The box button “ab-normal distribution” should be clicked if the data doesn’t show a “ab-normal distribution.
FIGURE 6 - Answer page to the example for the systematic error analy-sis of cephalometric measurement. The icon “abnormal distribution” should be clicked if the data do not show a normal distribution. Note that statistical tests for paired data can also be used for analysis of the systematic error.
FIGURE 4 - A) After selecting the type of data, the user must answer how many sample groups are being examined. B) After defining the number of groups,
the user must answer if the sample is paired or not. The table under the button provides examples to aid in the selection.
A B
FIGURE 7 - Graphic selection. A) Selection can be made according to the type of sample and the objective of a given study. B) Suggested type of graphic
to compare continuous data obtained from independent samples.
Contact address
Antonio David Corrêa Normando Rua Boaventura da Silva, 567- 1201 CEP: 66.055-093 – Belém / PA E-mail: [email protected]
1. Levander E, Malmgren O. Evaluation of the risk of root resorp-tion during orthodontic treatment: a study of upper incisors. Eur J Orthod. 1988 Feb;10(1):30-8.
2. Lian T, Cuoghi OA. O uso da estatística na Ortodontia. Rev Dental Press Ortod Ortop Facial. 2004 Nov/Dez;9(6):97-108. 3. Normando ADC, Quintão, CCA, Almeida, MAO. Análise do emprego do cálculo amostral e do erro do método em pesqui-sas científicas publicadas na literatura ortodôntica nacional e internacional. Rev Dental Press Ortod Ortop Facial. (no prelo).
REFERENCES
4. Sheats RD, Pankratz VS. Understanding distributions and data types. Semin Orthod. 2002 June;8(2):62-6.
5. Sheats RD, Pankratz VS. Common statistical tests. Semin Orthod. 2002 June;8(2):77-86.
6. Torgerson DJ, Miles JN. Simple sample size calculation. J Eval Clin Pract. 2007;13(6):952-3.
7. Valladares JVN, Domingues MHMS, Capelozza Filho L. Pes-quisa em Ortodontia: bases para a produção e a análise crítica. Rev Dental Press Ortod Ortop Facial. 2000 jul/ago;5(4):89-105.
presentations of the mean. However, graphics should highlight data dispersion, such as stan-dard deviation or variance to parametric data, or the interquartile range to non-parametric data. The 5th step of this presentation is related to the selection of informative graphs.
The initial steps are the same as shown earlier. After the choice of the option you want to run (Fig 1), the user must choose the type of data that is being evaluated in the study (Fig 3). In case of
continuous or ordinal data, a slide will appear to allow selection between paired or unpaired sam-ples, or if a correlation or regression analysis has been performed (Fig 7, A and B). If the data is nominal, the answer will be directly presented.
Submitted: October 2008