A Transcript Finishing Initiative for Closing Gaps
in the Human Transcriptome
The Ludwig–FAPESP Transcript Finishing Initiative,
1Mari Cleide Sogayar,
2and
Anamaria A. Camargo
2We report the results of a transcript finishing initiative, undertaken for the purpose of identifying and characterizing
novel human transcripts, in which RT-PCR was used to bridge gaps between paired EST clusters, mapped against the
genomic sequence. Each pair of EST clusters selected for experimental validation was designated a transcript finishing
unit (TFU). A total of 489 TFUs were selected for validation, and an overall efficiency of 43.1% was achieved. We
generated a total of 59,975 bp of transcribed sequences organized into 432 exons, contributing to the definition of
the structure of 211 human transcripts. The structure of several transcripts reported here was confirmed during the
course of this project, through the generation of their corresponding full-length cDNA sequences. Nevertheless, for
21% of the validated TFUs, a full-length cDNA sequence is not yet available in public databases, and the structure of
69.2% of these TFUs was not correctly predicted by computer programs. The TF strategy provides a significant
contribution to the definition of the complete catalog of human genes and transcripts, because it appears to be
particularly useful for identification of low abundance transcripts expressed in a restricted set of tissues as well as for
the delineation of gene boundaries and alternatively spliced isoforms.
[Supplemental material is available online at www.genome.org. The sequence data from this study have been
submitted to GenBank under accession nos. CF272536–CF272733.]
A primary objective of the Human Genome Project has been the identification of the complete set of human genes and their de-rived transcripts. A major step towards this goal was achieved at the beginning of 2001 with the publication of two independent draft versions of the human genome sequence and the identifi-cation of >30,000 genes (Lander et al. 2001; Venter et al. 2001). However, it became apparent that extracting exonic sequences directly from the human genome is not straightforward and that a variety of complementary strategies are required for gene iden-tification and characterization.
In this context, microarrays (Penn et al. 2000; Dennis 2001; Schoemaker et al. 2001; Kapranov et al. 2002) and sequence com-parisons with other organisms at an appropriate evolutionary distance (Batzoglou et al. 2000; Roest et al. 2000) constitute pow-erful preliminary approaches to identifying transcribed regions within the genome sequence. Nevertheless, transcript sequenc-ing is necessary both for the final proof of the existence of an expressed gene and for the precise identification of intron/exon boundaries and alternatively spliced forms (Camargo et al. 2002). A full-length cDNA sequence, ideally including a transcrip-tion initiatranscrip-tion site and a polyadenylatranscrip-tion site, is the gold stan-dard for transcript definition. Considerable progress has been made in the generation of representative full-length cDNA se-quences (Strausberg et al. 1999, 2002; Wiemann et al. 2001; Kikuno et al. 2002; Nakajima et al. 2002), especially following the development of sophisticated protocols for obtaining full-length transcript molecules and to correct for transcript expression bias (Bonaldo et al. 1996, Carninci et al. 2000).
Expressed sequence tags (ESTs) are another major source of transcript sequence. ESTs either are single-pass, partial sequences
derived either from the 5⬘and 3⬘ extremities of cDNA clones (Adams et al. 1991) or are specifically directed towards the central coding regions of transcripts, in the case of open reading frame ESTs (ORESTES; Dias et al. 2000; Camargo et al. 2001). Initially, ESTs were exploited as a source for gene discovery (Adams et al. 1992, 1993), but they have also been widely used to build tissue-specific transcript profiles (Bortoluzzi et al. 2000a,b,c; Hu-miniecki and Bicknell, 2000; Phillips et al. 2000; Yu et al. 2001; Katsanis et al. 2002; Megy et al. 2003), to construct gene-based physical maps (Hudson et al. 1994), to compare genomes of dif-ferent organisms (Tugendreich et al. 1994; Lee et al. 2002), to accurately identify transcripts in genomic sequences (Bailey et al. 1998; Jiang and Jacob 1998; Kan et al. 2001), and to study aspects of mRNA structure, such as splicing variants (Hide et al. 2001; Modrek et al. 2001; Clark and Thanaraj 2002; Kan et al. 2002; Xie et al. 2002; Xu et al. 2002; Wang et al. 2003), alternative poly-adenylation (Gautheret et al. 1998; Beaudoing and Gautheret 2001; Iseli et al. 2002), and single nucleotide polymorphisms (Garg et al. 1999; Picoult-Newberg et al. 1999; Clifford et al. 2000; Irizarry et al. 2000; Hu et al. 2002).
To date, >5,200,000 human ESTs have been generated from different organs and tissues, deriving mainly from the Merck Gene Index Project (Williamson 1999), the Cancer Genome Anatomy Project (CGAP; Strausberg et al. 2000), and the Human Cancer Genome Project Ludwig/FAPESP (HCGP; Dias et al. 2000; Camargo et al. 2001). Nevertheless, it is widely recognized that EST databases are subjected to artifacts related to the partial, low-quality nature of the sequences and the presence of various kinds of contamination (Sorek and Safer 2003). In addition, because of the large differences in abundance between RNA species, the cov-erage of individual transcripts by ESTs is highly variable. Despite that, it is believed that the vast majority of transcripts have been sampled at least once by either a full-length cDNA or EST se-quence (Ewing and Green 2000; Liang et al. 2000).
Although the amount of transcript data currently available is not sufficient to identify all human genes, the judicious use of 1A complete list of authors appears at the end of this manuscript.
2Corresponding authors.
E-MAIL [email protected]; FAX 55-11-3207-7001. E-MAIL [email protected]; FAX 55-11-3091-3820.
this data set, in conjunction with the draft sequences of the hu-man genome, has been highly informative in the characteriza-tion of new human genes (Reymond et al. 2002; Silva et al. 2003). Here we describe the utilization of a transcriptome database to guide the generation of novel human transcript sequences on a genome-wide basis. By using the genomic sequence as a scaffold for EST mapping and clustering, we have used RT-PCR to bridge gaps between EST clusters that we judged as likely to be derived from the same genes. The resulting novel sequence confirms that the ESTs from different clusters are, in fact, derived from a com-mon transcript and defines the intervening region between them.
Because this process is very similar to the finishing phase of genome projects, we called it transcript finishing (TF). This pow-erful, albeit laborious, approach allows the characterization of novel human transcripts and splicing isoforms, which appear to be generally expressed at a low abundance level and/or in a re-stricted set of tissues and avoids the necessity of a full-length cDNA clone in order to confirm the structure of a gene.
RESULTS
Generation of the Transcriptome Database and EST
Cluster Selection for Experimental Validation
We have used the publicly available human genome and tran-script sequences to identify and experimentally validate
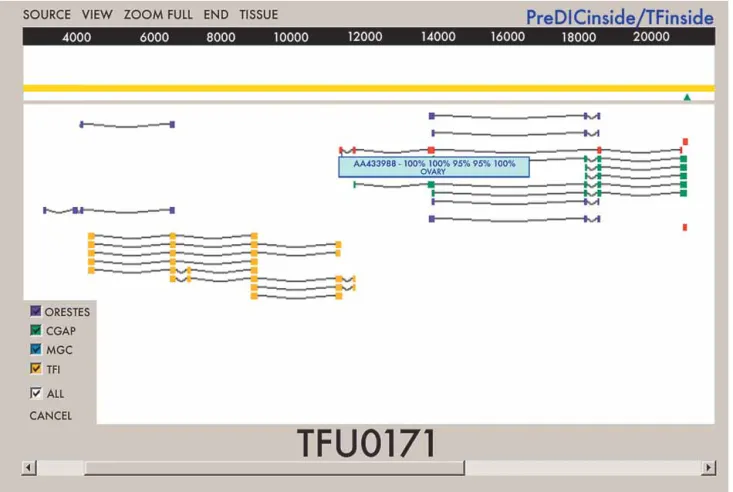
addi-tional transcribed regions in the human genome. The two data sets were integrated into the transcriptome database by using the BLASTN program to map all transcript sequences onto the as-sembled version of the human genome available from the Na-tional Center for Biotechonology Information (NCBI). We have also mapped to the genome, using the raw data generated by EST sequencing projects, a set of trusted 3⬘tags that provide unique identifiers for transcript 3⬘ends (Iseli et al. 2002). The tags were used for positional orientation and as a start point for transcript reconstruction. To facilitate visualization of the alignments and the access to information such as project and tissue source of the sequences, alignment scores, and the position of 3⬘tags, a graphi-cal interface was also developed (Fig. 1).
We identified 244,148 human transcript clusters, of which 14,598 contained at least one full-length cDNA sequence, and 229,550 clusters that were composed exclusively of partial tran-script sequences. Of the set of 14,598 clusters containing full-length sequences, 13,149 (90%) had at least one corresponding EST, and the remaining 1449 (10%) were composed only of full-length cDNA sequences. These data demonstrate that, despite the fact that >5 million EST sequences are available, they do not fully cover the human transcriptome and that the generation of addi-tional transcribed sequences is still required.
It is noteworthy that clusters composed exclusively by ESTs have a reduced number of sequences (average, 5.9 sequences) derived from fewer different tissues (average, 3.0), compared with clusters containing a full-length cDNA, which have an average of
65.5 sequences derived from eight different tissues. Based on these observations, we conclude that the human transcripts that remain to be defined are expressed at low levels in a restricted set of tissues and that their characterization will benefit from a direct approach such as the TF.
Because EST databases contain a significant fraction of arti-factual and contaminant sequences, we selected, for experimen-tal validation, pairs of clusters that consist of ESTs that align noncontiguously to the genome, consistent with the presence of a splicing structure. We also restricted our validation to pairs of clusters that map at a maximum distance of 10 kb from each other, in order to increase the probability that these clusters be-long to the same transcript. By using these criteria, a total of 2373 pairs of clusters (∼2% of the total number of clusters composed of
partial sequences) were initially selected and subjected to manual inspection using our graphical interface.
Manual inspection allowed the assessment of similarity and extension of the alignments, as well as the position of the se-lected pair of clusters relative to the 3’tags. Following this proce-dure, a subset of 489 pairs of clusters was initially selected for experimental validation. The number of clusters eliminated by manual inspection was very low; therefore, the 489 pairs of clus-ters selected for experimental validation can be considered an unbiased sample of the 2373 initially selected clusters. Clusters selected for validation were separated from each other by an av-erage 2879 bp of intervening genomic sequence and were com-posed by an average of 5.92 EST sequences derived from an av-erage of three distinct tissues. Each pair of EST clusters selected for experimental validation was designated as a single TF unit (TFU). Information related to the 489 TFUs selected for validation can be accessed at http://200.18.51.201/viewtfi.
Experimental Validation and the Generation of New
Transcribed Sequences
A general overview of the computational and experimental vali-dation strategies is presented in Figure 2. A total of two
coordi-nation groups, four bioinformatics groups, and 29 validation laboratories, linked through the Internet, participated in the computational and experimental phase of the project (http:// 200.18.51.201/transcript/Participants.html). Following cluster selection and manual inspection, primers for RT-PCR validation of each TFU were designed automatically. The genomic sequence was chosen as a template for primer design because it is generally of a higher quality than are EST sequences. cDNA preparation was also a critical issue, because both the quality and the repre-sentation of different tissues directly influence the validation ef-ficiency. As an indicator of genomic DNA contamination, the total RNA preparations were subjected to PCR amplification by using primers within intronic sequences flanking the exon 12 of the MLH1 gene and found to be negative. The quality of the cDNA product was demonstrated by PCR amplification of se-quences located at the 5⬘extremity of theNOTCH2 transcript (a long transcript of 11.4 Kb). A total of 22 cDNA preparations, derived from a number of cell lines and representing 18 distinct tissues, were used.
The total of 3019 sequences, generated during the project, was subjected to an automated cleaning protocol. High-quality sequences were aligned against the genomic sequence, and the alignment coordinates and scores for validated sequences were loaded into the transcriptome database and displayed on the graphical interface (Fig. 1). We successfully validated 211 of the 489 TFUs that were distributed, yielding an overall validation efficiency of 43.1%.
A single pair of primers was tested for each TFU, and experi-mental validation was undertaken in a high-throughput single-pass format. Few modifications were adopted when a positive amplification was not achieved (see Methods). To estimate the false-negative amplification rate of the TF strategy, we deter-mined the number of the nonvalidated TFUs for which a full-length cDNA sequence had been made available by other se-quencing projects during the course of our project. For 40 of the nonvalidated TFUs, we were able to identify a full-length se-quence linking the two EST clusters initially selected for validation. Thus, these cases can be considered to be false-negative am-plifications. For 118 of the nonvalidated TFUs, the existence of a full-length quence matching just one of the two se-lected clusters allowed us to conclude that the two clusters were in fact part of differ-ent transcripts. For these cases, the absence of an RT-PCR product thus reflects true negatives. For the 120 of the remaining nonvalidated TFUs, a conclusive result could not identify any corresponding full-length sequence. Therefore, based on these results, we can estimate that the rate of false-negative amplifications in the TF strat-egy is∼25% (40/158 nonvalidated TFUs).
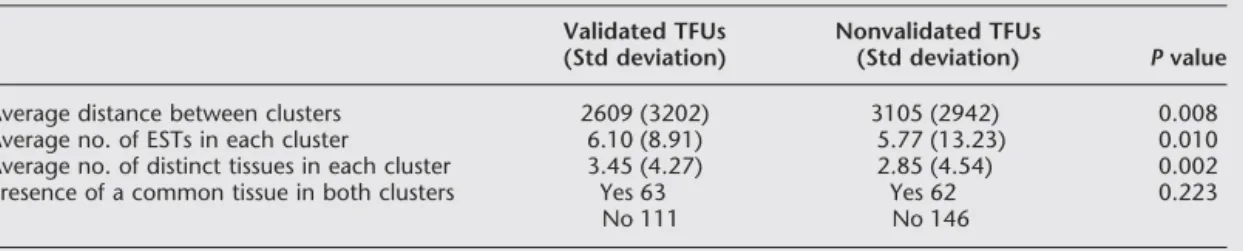
In addition, to identify variables re-lated to the expression pattern of the novel transcripts that influence the efficiency of validation, two sets composed of 174 vali-dated TFUs and 208 nonvalivali-dated TFUs were compared. As shown in Table 1, the validated TFUs had, on average, more ESTs in each cluster derived from a larger num-ber of different tissues. Both of these differ-ences were statistically significant accord-ing to Mann-Whitney tests, indicataccord-ing that a higher expression level and a broader ex-pression pattern of the selected transcripts Figure 2 General scheme of the TFI strategy. Schematic outline of the strategy used for
favored validation. The presence of ESTs derived from the same tissue in both clusters did not influence the likelihood of valida-tion according to2tests.
A total of 59,975 bp of transcribed sequence, organized into 432 exons, were generated, contributing to the definition of the structure of 211 distinct human transcripts. Each validated TFU had a mean of 281.6 bp and a median of 207 bp of novel se-quence not represented by the original EST clusters and a mean of 2.03 and a median of two newly defined exons. The validated TFU sequences have been submitted to GenBank under the ac-cession numbers CF272536 to CF272733, which are provided as Supplemental Table 1.
Consensus Sequences Generation and Annotation
of the Validated Human Transcripts
Consensus sequences produced by assembling the sequences de-rived from the validation fragment and the sequences from all ESTs in both clusters were obtained for 186 of the 211 validated TFUs. Assembly of a consensus sequence was not possible for 25 TFUs, due mainly to the presence of repetitive sequences and alternative splicing forms. Consensus sequences, with an average of 1240 bp, can be accessed at (http://200.18.51.201/ viewconsensus/).
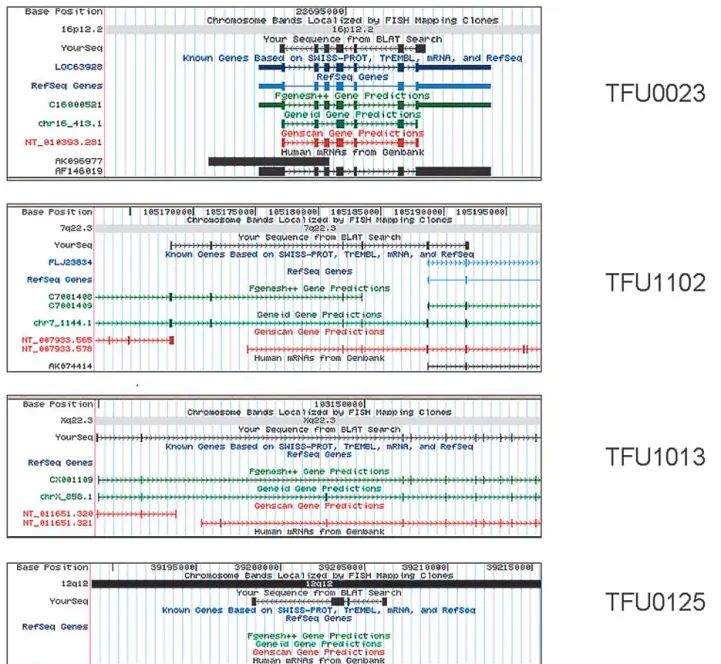
Consensus sequences derived from the validated TFUs were aligned to the July 2003 version of human genome sequence assembly provided by the University of California, Santa Cruz (UCSC), using the BLAT search tool (http://genome.ucsc.edu/cgi-bin/hgBlat) to compare the validated consensus sequences with known genes and gene predictions (Table 2). A significant frac-tion (68.8%) of the validated transcripts completely overlapped with the alignment coordinates of a known gene or full-length human mRNA submitted to the GenBank during the course of our project (Fig. 3A), and a smaller fraction (10.2%) represented extensions (mostly 5⬘) to partial cDNA sequences deposited in public databases (Fig. 3B). However, for 21% of the validated TFUs, a full-length cDNA sequence was not available in public databases as of July 2003. The structure of the majority (69.2%) of the validated TFUS without a corresponding full-length cDNA
sequence had not been correctly predicted by ab initio gene pre-diction programs such as Fgenesh++, Geneid, and GenScan. These TFUs can thus be considered as new human transcripts.
The consensus sequences corresponding to new human transcripts were further characterized by BLASTX analysis, and protein domains were predicted by using the Pfam and Prosite databases. Of the 39 consensus sequences representing new hu-man transcripts, 27 (69.2%) contained an ORF of at least 100 amino acids, and eight (20.5%) contained a clearly defined pro-tein domain including three IG-like domains and a propro-tein ki-nase. Complete information on the characterization of the vali-dated TFUs, including consensus size, annotation, chromosomal location, and expression pattern based on ESTs distribution, are provided as Supplemental Table 2.
The validated transcripts that completely overlapped with the alignment coordinates of a known gene containing a defined ORF were used to estimate the percentage of consensus sequences that represent complete transcripts. Only a small fraction (9.7%) of the 93 validated TFUs analyzed contained a complete ORF. The low percentage obtained was expected because, in the TF strategy, RT-PCR is used to brigde gaps between partial transcript sequences.
Identification and Experimental Validation
of Alternatively Spliced Isoforms
Several reports have suggested that at least 30% to 35% of human genes undergo alternative splicing (Brett et al. 2000; Modrek et al. 2001); nevertheless, this value is probably underestimated be-cause many cell types have not yet been fully explored by cDNA sequencing. The use of different cDNA sources during the experi-mental validation phase of the new human transcripts allowed us to identify many new splicing variants. We explored the degree of sequence variability due to alternative splicing in the set of 186 consensus sequences that we generated and found evidence for alternative splicing in 22 (12%) cases (Table 3). Intron reten-tion was observed in 11 TFUs, and alternative exon usage was detected in 11 of the 22 TFUs with alternative splicing. Con-served GT-AG splice junctions were present in all TFUs with al-ternative exon usage. The possibility of genomic DNA contami-nation, in those cases in which we have observed the retention of an intron, was excluded due to the presence of processed introns in the same cDNA molecule containing the retained intron. Moreover, the RNAs used for experimental validation of the al-ternatively spliced forms have been treated with DNase and tested for the absence of intronic sequences, as described in Methods.
We selected six TFUs with alternative exon usage, represent-ing a total of 14 splicrepresent-ing isoforms, for further experimental vali-dation. Each pair of primers used for experimental validation of the alternatively spliced forms was assayed against all 22 cDNA sources, without pooling. Touchdown PCR confirmed 10 (83%) of the putative investigated isoforms. No PCR amplification was achieved for one TFU. Some splicing isoforms were expressed in Table 1. Comparison Between Validated and Nonvalidated TFUs
Validated TFUs (Std deviation)
Nonvalidated TFUs
(Std deviation) Pvalue
Average distance between clusters 2609 (3202) 3105 (2942) 0.008
Average no. of ESTs in each cluster 6.10 (8.91) 5.77 (13.23) 0.010
Average no. of distinct tissues in each cluster 3.45 (4.27) 2.85 (4.54) 0.002
Presence of a common tissue in both clusters Yes 63 Yes 62 0.223
No 111 No 146
Table 2. Annotation of Validated Consensus
Categories
Number of consensus sequences
Percentage (%)
Known gene 128 68.8
Extension of a known gene 19 10.2
New transcript w/total prediction 12 6.5 New transcript w/partial prediction 15 8.0
New transcript w/o prediction 12 6.5
a restricted pattern, being detected in one or a few of the tissues analyzed by RT-PCR (data not shown). None of these splicing isoforms had been previously identified, highlighting the poten-tial use of the TF strategy for uncovering the genetic variability generated at the transcriptome level.
A typical example of this experimental validation is illus-trated in Figure 4. In this case, we were able to identify two alternative exons, one of which presents an extra exon of 138 bp and the other a 21-bp extension of an exon already represented by EST sequences. The possible combination of these variants results in four splicing isoforms. Figure 4 shows a 388-bp product (obtained with primers P1 and P2) corresponding to the proto-type isoform, a 370-bp product (primers P2 and P3) correspond-ing to the isoform containcorrespond-ing the additional exon, a 314-bp product (primers P1 and P4) corresponding to the isoform with the extended exon, and a 452-bp product corresponding to the
isoform containing both the additional exon and the extended exon.
DISCUSSION
Currently, intense activity is directed toward defining the com-plete set of genes and their derived transcripts in the human genome. This information will have a profound impact in diverse areas of biology such as human evolution, structural genomics, and medicine. However, because of the highly dispersed and complex structure of human genes, it is extremely difficult to correctly identify transcribed regions within the genome (Ca-margo et al. 2002).
Estimates based on gene prediction both within individual finished chromosomes (Dunham et al. 1999; Hattori et al. 2000), as well as in the draft human genome sequences (Lander et al. Figure 3 Characterization and annotation of validated TFUs. Alignment of four consensus sequences, derived from the validated TFUs, to the July 2003 version of the UCSC human genome sequence assembly, using the BLAT search tool. (A) TFU00023 corresponds to YourSeq (black) completely
overlapping with known genes based on SWISS-PROT, TrEMBL, mRNA, and RefSeq (dark blue). (B) TFU01102 represents a 5⬘extension of a partial cDNA (FLJ23834). (C) TFU01013 represents a new human transcript structure that was correctly predicted by ab initio gene predition transcripts, such as
2001; Venter et al. 2001), have uniformly concluded that the human genome possesses <35,000 genes. This number has been supported by a preliminary analysis of EST coverage of known genes (Ewing and Green 2000) as well as comparative genomics analysis (Roest et al. 2000). Most of these 35,000 genes are al-ready represented by a full-length cDNA sequence in transcript databases. In UniGene (http://www.ncbi.nlm.nih.gov/entrez/ query.fcgi?db=unigene), for example, there are currently 28,412 transcript clusters represented by at least one full-length cDNA sequence.
Here we have proposed and validated the use of the TF strat-egy for characterization of new human transcripts that are only partially represented by ESTs. Because EST databases contain a significant fraction of artifactual and contaminant sequences, we selected pairs of clusters for experimental validation that exhib-ited a clear splicing structure when aligned to the genome. By requiring the occurrence of splicing, the level of contamination in the EST databases is significantly reduced, although at the expense of eliminating many genuine 3⬘ESTs. The selection cri-teria used in our initial analysis are very restrictive, and the adop-tion of less stringent criteria (including clusters without a splic-ing structure) will certainly be required to complete the catalog of human genes using the strategy we described. Given the 2373 initially selected clusters, of which 489 were subjected to experi-mental validation, 1884 pairs of clusters remain to be validated. If we assume an overall validation efficiency of 43%, we can estimate that the TF strategy might contribute to the definition of at least 791 additional genes in the human genome.
Several factors may have influenced our validation effi-ciency, including experimental limitations related to primer and cDNA synthesis, the particular characteristics of human tran-scripts such as low expression level, and the existence of a sig-nificant proportion of sense-antisense transcriptional units on opposite DNA strands of the same genomic locus (Yelin et al 2003). A 25% false-negative amplification rate was estimated for
the TF strategy and is probably related to the high-throughput single-pass format adopted for the experimental validation. In this context, the use of additional primer pairs and modifications of cycling parameters that would favor the amplification of dif-ficult targets could be added to the process to reduce the negative amplification rate.
We found that validation efficiency was enhanced by imple-mentation of quality controls for cDNA synthesis, the use of polyA+-derived cDNA, a combination of both oligo dT and ran-dom primers for cDNA synthesis, and also the use of nested RT-PCR. We also observed that validated pairs of clusters had a higher average number of ESTs per cluster and a higher number of different tissues represented by the clusters compared with pairs of clusters that we were not able to validate. Validated TFUs had, on average, 6.1 ESTs in each cluster derived, on average, from 3.45 distinct tissues. Noteworthy, in 41% of the validated TFUs, one of the two EST clusters was composed of a single EST, and in 13% of the cases, both clusters corresponded to singleton ESTs, indicating the often overlooked importance of this kind of data.
For a reasonable fraction (21%) of the validated TFUs, a full-length cDNA sequence was not yet available in public databases. The structure of the majority (69.2%) of these validated TFUs had not been correctly predicted by ab initio gene prediction pro-grams and, consequently, was not annotated in the human ge-nome. In addition, the use of different cDNA sources in the vali-dation process allowed us to identify many splicing variants that were further validated by RT-PCR. As for 21% of validated se-quences, none of these splicing variants had been previously identified.
We conclude that the TF strategy provides a convenient and unique means for delineating gene boundaries and new tran-scribed sequences. The TF strategy permits the characterization of new human transcripts and splicing isoforms expressed at a low level and in a restricted set of tissues and will certainly continue to contribute to the definition of the complete catalog of human genes and transcripts.
METHODS
Cell Culture
Human cell lines were obtained from the American Type Culture Collection (ATCC) and cultured as recommended (http:// www.atcc.org). The following cell lines were used in order to generate a cDNA panel representing different tissues: A172 glio-blastoma; T98G multiform glioglio-blastoma; FaDu squamous cell carcinoma; SW480 colorectal adenocarcinoma; Skmel-25 malig-nant melanoma; DU145 prostate carcinoma; HeLa cervix adeno-carcinoma; XP Xeroderma pigmentosum fibroblasts; ZR-75-1, MCF-7, and Hs578T breast ductal carcinoma; IM9 B transformed lymphoblasts; TT thyroid carcinoma; U937 histyocytic lym-phoma; Hs1.Tes normal testis; Hs732.PL normal placenta; Hep G2 hepatocarcinoma; NCI-H1155 and H358 lung carcinoma; SCaBER urinary bladder carcinoma; SAOS 2 osteosarcoma; and Tu-rim primary culture of a kidney tumor.
RNA Extraction and cDNA Synthesis
Total RNA was prepared from cultured cells seeded in four 150-mm-diameter (P150) plates by using the cesium chloride cushion technique (Chirgwin et al. 1979). Poly A+
RNA was isolated from 200 µg total RNA with the PolyAttract mRNA isolation kit (Pro-mega), and the total yield of this purification was used for cDNA synthesis. For cDNA synthesis, 100 to 200 µg total RNA or the corresponding purified mRNA were treated with 100 U DNAse I (FPLC-pure, Amersham) and reverse-transcribed by using oli-go(dT)12-18, random primer andSuperScriptII (Invitrogen), fol-lowing the manufacturer’s instructions. The resulting cDNA was then subjected to RNase H treatment and distributed among the Table 3. Alternative Splicing Forms Within Validated TFs
Validated consensus
Type of alternative
splicing
Presence of conserved
acceptor and donor
sites
No. of alternative
isoforms
No. of validated
isoforms
TFU0118 Exon usage Yes 2 1
TFU0200 Exon usage Yes 4 4
TFU0274 Exon usage Yes 2 2
TFU0351 Exon usage Yes 2 2
TFU1004 Exon usage Yes 2 1
TFU1058 Exon usage Yes 3 0
TFU0155 Exon usage Yes 2 nd
TFU0238 Exon usage Yes 2 nd
TFU0308 Exon usage Yes 2 nd
TFU0003 Intron retention nd nd nd
TFU0019 Intron retention nd nd nd
TFU0035 Intron retention nd nd nd
TFU0052 Intron retention nd nd nd
TFU0099 Intron retention nd nd nd
TFU0112 Intron retention nd nd nd
TFU0125 Intron retention nd nd nd
TFU0131 Intron retention nd nd nd
TFU0209 Intron retention nd nd nd
TFU0285 Intron retention nd nd nd
TFU0371 Intron retention nd nd nd
TFU0148 Exon skipping nd nd nd
TFU1061 Exon skipping nd nd nd
31 validation laboratories involved in the project. The quality of the cDNA synthesis and the absence of genomic DNA contami-nation were evaluated for each preparation. Total RNA was sub-jected to PCR amplification by using primers within intronic se-quences flanking exon 12 of the MLH1 gene (forward, 5⬘ -TGGTGTCTCTAGTTCTGG-3⬘; reverse, 5⬘-CATTGTTGTAG TAGCTCTGC-3⬘). The quality of the cDNA product was also tested by PCR amplification of sequences located at the 5⬘ ex-tremity of theNOTCH2 transcript (a long transcript of 11.4Kb; forward, 5⬘-ACTGTGGCCAACCAGTTCTC-3⬘; reverse, 5-⬘CTCT CACAGGTGCTCCCTTC-3⬘).
RT-PCR and Sequencing
RT-PCR was carried out in 25 µL reaction mixtures containing 1 µL cDNA, 10⳯Taq DNA polymerase buffer, 200 µM dNTP, 6 pmoles of primers, 1.5 mM MgCl2, and 1 UTaqDNA polymerase
(GIBCO BRL). Standard PCR conditions were as follows: 4 min at 94°C (initial denaturation), 40 sec at 94°C, 40 sec at 55°C, and 1 min at 72°C for 35 cycles and a final extension step of 10 min at 72°C. Modifications of the standard protocol included annealing temperature, MgCl2 concentration, addition of PCR enhancers
such as betaine, and the use of polymerases with hot start activ-ity. PCR products were directly sequenced with the same primers used for RT-PCR or cloned before sequencing. If more than one fragment was obtained for the same TFU using different cDNA sources, all fragments were sequenced. This was also the case if multiple bands were obtained in PCR amplifications using a single cDNA source. Sequencing different fragments obtained for a specific TFU allowed us to characterize a number of alterna-tively spliced transcripts. Sequencing reactions were carried out by using the DYEnamic ET terminator Cycle Sequencing Kit (Am-ersham Pharmacia) and separated by electrophoresis using an ABI 377 Prism Sequencer (Applied Biosystems) according to sup-plier’s recommendations.
Transcriptome Database and Graphical Interface
BLASTN was used to identify pair-wise similarities between all known transcript sequences and the draft genome sequence de-posited in release 66 (March 2001) of the European Molecular Biology Laboratory (EMBL) database. Transcribed sequence data were extracted from several sources: (1) the human EST section of EMBL release 66, (2) human mRNA documented in the human section of EMBL release 66, (3) ORESTES sequences from the Lud-wig Institute for Cancer Research (LICR)/FAPESP Human Cancer Genome project, and (4) human mRNAs documented in the NCBI curated RefSeq database (http://www.ncbi.nlm.nih.gov/ refseq). For genomic sequence, we used contigs of at least 10 kb
deposited in the HUM and HTG sections. Those HTG entries that had not been fully assembled were split into individual compo-nents. Therefore, the human genome data set used is highly redun-dant but can easily be reduced to one of the available assemblies. The transcript sequences were filtered for contaminants, and repetitive elements were masked out by using the PFP soft-ware package (Paracel). For each pair of matching transcribed and genomic sequences, local alignments were generated by using Sim4 (Florea et al. 1998), with parameters W = 15, R = 0, A = 4, and P = 1. The output of Sim4 was filtered to eliminate all align-ments that did not contain at least one matching region within the genome with at least 95% identity over 30 nt. The alignment coordinates and related information were uploaded into a MySQL relational database. We used the data stored in the rela-tional database to create clusters of transcribed sequences, based on their position within individual genomic contigs. The coor-dinates of the putative exons on the genome sequence were used to determine membership in a cluster. If coordinates of at least one exon were common to two transcripts, then these were con-sidered to be part of the same cluster.
The 3⬘tags were generated as previously described (Iseli et al. 2002). Briefly, poly(A) or poly(T) were identified from original sequence trace files, and the 50 nucleotides immediately adjacent to it were recorded as a candidate tag (after obtaining the reverse complement for poly(T) tracts). Duplicate tags were eliminated, as were the tags matching LINE and Alu repetitive elements, ri-bosomal or mitochondrial sequences, and those containing simple repeats. Matches for the remaining tags were mapped to the genome, and the 50 nucleotides found downstream of the match were also recorded. Individual tags were incorporated into the MySQL database. A graphical interface was developed in TCL/ TK language in order to visualize the 3⬘tags, EST alignments and related information, such as tissue origin and project source of the sequences.
By querying the transcriptome database, we were able to select EST clusters that do not correspond to known full-length mRNA for validation. These were at a maximum of 10 kb apart from each other and exhibited a clear splicing structure when aligned to the genome. Clusters selected for validation were vi-sually inspected before ordering primers. All systems used in this work were developed by using PERL and PHP programming lan-guages on a Linux-based server running the MySQL database management system and the Apache Web server.
Cluster Selection and Primers Design
The automated primer protocol received a fixed format file con-taining the accession number of the genomic clones and the Figure 4 Experimental validation of MGC5601 gene alternative splicing isoforms. (A) Gene structure for exons XVI-XIX (boxes) of the MGC5601 gene
located on chromosome 12. Introns are represented by lines. Two alternative exons are shown on TFU reads, and a hypothetical combination of these two exons is also shown. Sequence F07R has an extra exon between exon XVII and XVIII. Sequence A01R has an extended exon XIX. Four primers were designed for validation tests, as indicated in the figure (P1–P4), and each pair of primers were assayed against all 22 cDNA preparations without pooling. (B) We detected all four of these alternative splicing isoforms in MGC5601. Numbers one through four indicate the tissues from which the cDNA was
genomic interval where the two noncontiguous EST clusters map and where the system searched for primers. A single pair of prim-ers was designed for each TFU, which usually targeted the two exons flanking the putative gap. In a few cases, in which the presence of repetitive sequences or atypical base composition prevented the design of primers, adjacent exons were used. The Primer3 program (version 0.9) developed by the Whitehead In-stitute for Biomedical Research was used for primer design, adopting the following parameters: primer size of a minimum of 17 bp, optimal 18 bp and maximum 21 bp; melting temperature of a minimum of 55°C, optimal 60°C and maximum 65°C; and GC clamp set to one. The output of Primer3 was processed in order to filter primers that had alternate annealing sites in the given genomic sequence. The system uses a Web-based interface that allows submission of files containing information on primer design, retrieval of primers found, and the modification of de-fault parameters for primer picking.
Sequence Analysis and Database Update
Sequences were subjected to an automated protocol to (1) assess sequence quality, (2) trim vector sequences, (3) mask repetitive elements, and (4) remove undesirable sequences such as bacte-rial, mitochondbacte-rial, and fungi sequences. The sequence quality was determined by Phred analysis using a trimCutOff of 0.06171 (Ewing and Green 1998; Ewing et al. 1998). Sequences with <100 bases were excluded. Mitochondrial, bacterial, and fungi se-quences were identified by BLAST searches against the GenBank entry corresponding to the human mitochondrial complete ge-nome sequence and against a locally developed bacterial and fungal database, respectively. Significant hits were determined by using an E value of 10ⳮ5for searches against mitochondrial
ge-nome and an E value of 10ⳮ30
for searches against bacterial da-tabases. Masking of repetitive elements was undertaken by using the RepeatMasker (http://www.repeatmasker.org) under default parameters. The remaining high-quality sequences were aligned against the original genomic clone by using the BLASTN pro-gram, and alignment coordinates and scores were loaded into the MySQL database on a daily basis.
Consensus Assembly
The reads corresponding to validated TFs were assembled into a contig by using the PhredPhrap. The contig sequence was aligned with both EST clusters by using the BLASTN program, and alignment coordinates were used for consensus generation. A Web-based interface was developed to monitor the assembly and access the consensus sequences (http://200.18.51.201/ viewconsensus/).
Characterization of Validated Transcripts
Characterization of validated transcripts was pursued by using the UCSC Genome Browser (Kent et al. 2002), which is available at http://genome.ucsc.edu. This allowed determination of se-quence overlap between the validated consensus sese-quences, known genes, and gene predictions. Consensus sequences de-rived from the validated TFUs were aligned to the July 2003 ver-sion of the human genome sequence assembly provided by UCSC using the BLAT search tool. The annotation tracks used for comparison to already known genes were known genes, RefSeq genes, and human mRNAs from the GenBank. A validated tran-script was considered a new gene if its alignment coordinates did not match the coordinates of any other sequence available through the known genes, RefSeq genes, or human mRNA anno-tation tracks. For comparison to gene predictions, the following tracks were used: Fgenesh++, Geneid, and GenScan predictions. The prediction of individual exons instead of the full transcript prediction was considered. A validated exon was considered as predicted if it aligned within the coordinates defined by any of the three gene prediction programs (not necessarily sharing bor-ders) and a new validated transcript was considered not predicted if all exons were not predicted by the computer programs. The consensus sequences corresponding to new validated transcripts
were further characterized by BLASTX analysis, and protein do-mains were determined by using the Pfam and Prosite databases.
Characterization and Validation of Alternatively
Splicing Forms
The individual sequences generated during the process of valida-tion of each TFU were aligned to the human genome assembly by using the BLAT search tool, together with the final consensus sequence and representative sequences derived from both EST clusters. Alternatively spliced isoforms were visually identified by using the UCSC browser. To eliminate alignment artifacts caused by sequencing errors and problems in the genome assembly, we have considered as alternatively spliced forms only exons de-fined by conserved acceptor and donor splicing sites (GT/AG). Primers for validation of predicted alternative splicing isoforms were designed by using Primer3 with default parameters. The presence of alternative isoforms was analyzed by using a cDNA panel composed of 20 different normal and tumor tissues.GAPD
amplification was used as a control for integrity and quantifica-tion of the RNA used for cDNA synthesis. RT-PCR products ob-tained in touchdown reactions were analyzed on 1.5% agarose gels.
Complete List of Authors
Coordination Group Ludwig Institute
Fabiana Bettoni,3
Dirce Maria Carraro,3
Lilian C. Pires,3
Raphael B. Parmigiani,3Elisa N. Ferreira,3Eloı´sa de Sa´ Moreira,3,32Maria
do Rosa´rio D. de O. Latorre,4Andrew J.G. Simpson,3and
Ana-maria A. Camargo3
Coordination Group University of Sa˜o Paulo
Chemistry Institute
Luciana Oliveira Cruz,5Theri Leica Degaki,5Fernanda Festa,5
Kat-lin B. Massirer,5
and Mari C. Sogayar5
Bioinformatics Groups
Fernando Camargo Filho,6
Luiz Paulo Camargo,6
Marco A.V. Cunha,7Sandro J. De Souza,8Milton Faria Junior,6Silvana
Giu-liatti,6
Leonardo Kopp,9
Paulo S.L. de Oliveira,9
Paulo B. Paiva,10
Anderson A. Pereira,6Daniel G. Pinheiro,7Renato D. Puga,6and
Jorge Estefano S. de Souza8
Validation Groups
Dulcineia M. Albuquerque,11
Luı´s E.C. Andrade,12
Gilson S. Baia,13Marcelo R.S. Briones,14Ana M.S. Cavaleiro–Luna,15Janete
3Ludwig Institute for Cancer Research, Sa˜o Paulo, SP, 01509–010, Brazil
4Department of Epidemiology, School of Public Health, University of Sa˜o Paulo, SP, 01246–904, Brazil
5Instituto de Quı´mica, Universidade de Sa˜o Paulo, Sa˜o Paulo, SP, 05513–970, Brazil
6Dep. de Eng. Quı´mica e de Informa´tica, Bioinforma´tica, Universi-dade de Ribeira˜o Preto, Ribeira˜o Preto, SP, 14096–380, Brazil 7Centro de Terapia Celular, Hemocentro e Departamento de Clı´nica Me´dica, Faculdade de Medicina de Ribeira˜o Preto, Universidade de Sa˜o Paulo, Ribeira˜o Preto, SP, 14051–140, Brazil
8Laborato´rio de Biologia Computacional, Instituto Ludwig, Sa˜o Paulo, SP, 01509–010, Brazil
9Laborato´rio de Gene´tica e Cardiologia Molecular, Instituto do Cora-c¸a˜o, Universidade de Sa˜o Paulo, Sa˜o Paulo, SP, 05403–000, Brazil 10Bioinformatics Laboratory, Health Informatics Department, Fed-eral University of Sa˜o Paulo, Sa˜o Paulo, SP, 04039–032, Brazil 11Departamento de Clı´nica Me´dica, Hemocentro, Faculdade de Cie ˆn-cias Me´dicas, Universidade Estadual de Campinas, Campinas, SP, 13083–970, Brazil
12Rheumatology Division, Federal University of Sa˜o Paulo, Sa˜o Paulo, SP, 04113–001, Brazil
13Departamento de Histologia e Embriologia, Instituto de Cieˆncias Biome´dicas, Universidade de Sa˜o Paulo, Sa˜o Paulo, SP, 05508–900, Brazil
M. Cerutti,16 Fernando F. Costa,11 Eugenia Costanzi-Strauss,17
Enilza M. Espreafico,18
Adriana C. Ferrasi,19
Emer S. Ferro,13
Maria A.H.Z. Fortes,15 Joelma R.F. Furchi,20 Daniel
Giannella-Neto,15
Gustavo H. Goldman,21
Maria H.S. Goldman,22
Arthur Gruber,23 Gustavo S. Guimara˜es,16 Christine Hackel,24 Flavio
Henrique-Silva,20
Edna T. Kimura,13
Suzana G. Leoni,11
Cla´udia Macedo,25Bettina Malnic,26Carina V. Manzini B.,26Suely K.N.
Marie,27
Nilce M. Martinez-Rossi,25
Marcelo Menossi,28,29
Elisa-bete C. Miracca,30Maria A. Nagai,30Francisco G. Nobrega,31
Ma-rina P. Nobrega,31
Sueli M. Oba-Shinjo,27
Ma´rika K. Oliveira,18
Guilherme M. Orabona,32
Audrey Y. Otsuka,33
Maria L. Pac¸o-Larson,18Beatriz M.C. Paixa˜o,7Jose R.C. Pandolfi,34Maria I.M.C.
Pardini,19
Maria R. Passos Bueno,32
Geraldo A.S. Passos,35
Joao B. Pesquero,36 Juliana G. Pessoa,36 Paula Rahal,37 Cla´udia A.
Rainho,38
Caroline P. Reis,28
Tatiana I. Ricca,14
Vanderlei Rod-rigues,39Silvia R. Rogatto,38 Camila M. Romano,23 Janaı´na G.
Romeiro,37
Antonio Rossi,39
Renata G. Sa´,39
Magaly M. Sales,19
Simone C. Sant’Anna,24 Patrı´cia L. Santarosa,40 Fernando
Se-gato,25 Wilson A. Silva Jr.,7,25Ismael D.C.G. Silva,33 Neusa P.
Silva,12
Andrea Soares-Costa,20
Maria F. Sonati,41
Bryan E. Strauss,42 Eloiza H. Tajara,37 Sandro R. Valentini,34 Fabiola E.
Villanova,33
Laura S. Ward,40
and Dalila L. Zanette7
ACKNOWLEDGMENTS
We dedicate this work to Dr. Ricardo R. Brentani (Director of the Ludwig Institute-Sa˜o Paulo Branch and of the A.C. Camargo Hos-pital) and Dr. Jose´ Fernando Perez (Scientific Director of the Sa˜o Paulo Research Foundation-FAPESP) for unconditional support and constant incentive to the Brazilian Genome Initiative. We thank Fernanda G. Barbuzano, Ma´rio H. Bengtson, Ana P. Bogos-sian, Miriam S. Carmo, Christian Colin, De´bora C.J. Costa, Leslie E. Ferreira, Cristiane A. Ferreira, Mariana C. Frigieri, Hellen T. Fuzii, Augusto D. Luchessi, Claudia R. Madella, Adriana A. Marques, Zizi de Mendonc¸a, Camila C.B.O. Menezes, Alessandra Splendore, Flavia I.V. Errera, Julio C. Moreira, Irenice C. Silva, Sandra R. Souza, and Fabiana Granja for dedicated and expert technical assistance and/or critical discussions. We also thank Dr. Winston Hide and Dr. Helena Brentani for important comments and corrections on the manuscript and Juc¸ara Parra for acting as the administrative coordinator of this project. The work was equally supported by the Ludwig Institute for Cancer Research and Fundac¸a˜o de Amparo a` Pesquisa do Estado de Sa˜o Paulo (FAPESP).
The publication costs of this article were defrayed in part by payment of page charges. This article must therefore be hereby marked “advertisement” in accordance with 18 USC section 1734 solely to indicate this fact.
REFERENCES
Adams, M.D., Kelley, J.M., Gocayne, J.D., Dubnick, M., Polymeropoulos, M.H., Xiao, H., Merril, C.R., Wu, A., Olde, B., and Moreno, R.F. 1991. Complementary DNA sequencing: Expressed sequence tags and human genome project.Science252:1651–1656.
Adams, M.D., Dubnick, M., Kerlavage, A.R., Moreno, R., Kelley, J.M., Utterback, T.R., Nagle, J.W., Fields, C., and Venter, J.C. 1992. Sequence identification of 2375 human brain genes.Nature 355:632–634.
Adams, M.D., Kerlavage, A.R., Fields, C., and Venter, J.C. 1993. 3,400 new expressed sequence tags identify diversity of transcripts in human brain.Nat. Genet.4:256–267.
Bailey, L.C., Searls Jr., D.B., and Overton, G.C. 1998. Analysis of EST-driven gene annotation in human genomic sequence.Genome Res.8:362–376.
Batzoglou, S., Pachter, L., Mesirov, J.P., Berger, B., and Lander, E.S. 2000. Human and mouse gene structure: Comparative analysis and application to exon prediction.Genome Res.10:950–958. Beaudoing, E. and Gautheret, D. 2001. Identification of alternate
polyadenylation sites and analysis of their tissue distribution using EST data.Genome Res.11:1520–1526.
Bonaldo, M.F., Lennon, G., and Soares, M.B. 1996. Normalization and subtraction: Two approaches to facilitate gene discovery.Genome Res. 6:791–806.
Bortoluzzi, S., d’Alessi, F., and Danieli, G.A. 2000a. A computational reconstruction of the adult human heart transcriptional profile.J. Mol. Cell. Cardiol.32:1931–1938.
———. 2000b. A novel resource for the study of genes expressed in the adult human retina.Invest. Ophthalmol. Vis. Sci.41:3305–3308. Bortoluzzi, S., d’Alessi, F., Romualdi, C., and Danieli, G.A. 2000c. The
human adult skeletal muscle transcriptional profile reconstructed by a novel computational approach.Genome Res.10:344–349. Brett, D., Hanke, J., Lehmann, G., Haase, S., Delbruck, S., Krueger, S.,
Reich, J., and Bork, P. 2000. EST comparison indicates 38% of human mRNAs contain possible alternative splice forms.FEBS Lett. 474:83–86.
Camargo, A.A., Samaia, H.P., Dias-Neto, E., Simao, D.F., Migotto, I.A.,
16Laborato´rio de Endocrinologia Molecular, Disciplina de Endocrino-logia, Departamento de Medicina, Universidade Federal de Sa˜o Paulo, Sa˜o Paulo, 04039–002, Brazil
17Laborato´rio de Transfereˆncia Geˆnica, Instituto de Cieˆncias Bio-me´dicas, Universidade de Sa˜o Paulo, Sa˜o Paulo, SP, 05508–900, Bra-zil
18Departamento de Biologia Celular e Molecular e Bioagentes Pato-geˆnicos, Faculdade de Medicina de Ribeira˜o Preto, Universidade de Sa˜o Paulo, Ribeira˜o Preto, SP, 14049–900, Brazil
19Laborato´rio de Biologia Molecular, Hemocentro, Faculdade de Me-dicina, Universidade Estadual Paulista, Botucatu, SP, 18618–970, Brazil
20Departamento de Gene´tica e Evoluc¸a˜o, Universidade Federal de Sa˜o Carlos, Sa˜o Carlos, SP, 13565–905, Brazil
21Faculdade de Cieˆncias Farmaceˆuticas de Ribeira˜o Preto, Universi-dade de Sa˜o Paulo, Ribeira˜o Preto, SP, 14040–903, Brazil
22Faculdade de Filosofia, Cieˆncias e Letras de Ribeira˜o Preto, Univer-sidade de Sa˜o Paulo, Ribeira˜o Preto, SP, 14040–901, Brazil 23Depto. de Patologia, Faculdade de Medicina Veterina´ria e Zootec-nia, Universidade de Sa˜o Paulo, Sa˜o Paulo, SP, 05508–000, Brazil 24Departamento de Gene´tica Me´dica, Faculdade de Cieˆncias Me´di-cas, Universidade Estadual de Campinas, Campinas, SP, 13081–970, Brazil
25Departamento de Gene´tica, Faculdade de Medicina de Ribeira˜o Preto, Universidade de Sa˜o Paulo, Ribeira˜o Preto, SP, 14040–900, Brazil
26Departamento de Bioquı´mica, Instituto de Quı´mica, Universidade de Sa˜o Paulo, Sa˜o Paulo, SP, 05599–970, Brazil
27Departamento de Neurologia, Faculdade de Medicina, Universi-dade de Sa˜o Paulo, Sa˜o Paulo, SP, 01246–903, Brazil
28Laborato´rio de Genoma Funcional, Centro de Biologia Molecular e Engenharia Gene´tica, Universidade Estadual de Campinas, Campi-nas, SP, 13083–970, Brazil
29Departamento de Gene´tica e Evoluc¸a˜o, Instituto de Biologia, Uni-versidade Estadual de Campinas, Campinas, SP, 13084–971, Brazil 30Departamento de Radiologia, Disciplina de Oncologia, Faculdade de Medicina, Universidade de Sa˜o Paulo, Sa˜o Paulo, SP, 01246–903, Brazil
31Instituto de Pesquisa e Desenvolvimento, Universidade do Vale do Paraı´ba, Sa˜o Jose´ dos Campos, SP, 12244–000, Brazil
32Departamento de Biologia, Centro de Estudos do Genoma Hu-mano, Instituto de Biocieˆncias, Universidade de Sa˜o Paulo, Sa˜o Paulo, SP, 05508–900, Brazil
33Molecular Gynecology Laboratory, Gynecology Department, Fed-eral University of Sa˜o Paulo, Sa˜o Paulo, SP, 04039–001, Brazil 34Department of Biological Sciences, School of Pharmacy, Sa˜o Paulo State University, Araraquara, SP, 14801–902, Brazil
35Disciplina de Gene´tica, Faculdade de Odontologia, Universidade de Sa˜o Paulo, Ribeira˜o Preto, SP, 14040–900, Brazil
36Departamento de Biofı´sica, Universidade Federal de Sa˜o Paulo, Sa˜o Paulo, SP, 04023–062, Brazil
37Departamento de Biologia, Instituto de Biocieˆncias, Letras e Cie ˆn-cias Exatas, Universidade Estadual Paulista, Sa˜o Jose do Rio Preto, SP 15054–000, Brazil
38Departamento de Gene´tica, Instituto de Biocieˆncias, Universidade Estadual Paulista, Botucatu, SP, 18618–000, Brazil
39Departamento de Bioquı´mica e Imunologia, Faculdade de Me-dicina de Ribeira˜o Preto, Universidade de Sa˜o Paulo, Ribeira˜o Preto, SP, 14049–900, Brazil
40Laborato´rio de Gene´tica Molecular do Caˆncer, Departamento de
Clı´nica Me´dica, Faculdade de Cieˆncias Me´dicas, Universidade Es-tadual de Campinas, Campinas, SP, 13083–970, Brazil
41Departamento de Patologia Clı´nica, Faculdade de Cieˆncias Me´di-cas, Universidade Estadual de Campinas, Campinas, SP, 13083–970, Brazil
Briones, M.R., Costa, F.F., Nagai, M.A., Verjovski-Almeida, S., Zago, M.A., et al. 2001. The contribution of 700,000 ORF sequence tags to the definition of the human transcriptome.Proc. Natl. Acad. Sci. 98:12103–12108.
Camargo, A.A., de Souza, S.J., Brentani, R.R., and Simpson, A.J. 2002. Human gene discovery through experimental definition of transcribed regions of the human genome.Curr. Opin. Chem. Biol. 6:13–16.
Carninci, P., Shibata, Y., Hayatsu, N., Sugahara, Y., Shibata, K., Itoh, M., Konno, H., Okazaki, Y., Muramatsu, M., and Hayashizaki, Y. 2000. Normalization and subtraction of cap-trapper-selected cDNAs to prepare full-length cDNA libraries for rapid discovery of new genes. Genome Res.10:1617–1630.
Chirgwin, J.M., Przybyla, A.E., MacDonald, R.J., and Rutter WJ. 1979. Isolation of biologically active ribonucleic acid from sources enriched in ribonuclease.Biochemistry18:5294–5299.
Clark, F. and Thanaraj, T.A. 2002. Categorization and characterization of transcript-confirmed constitutively and alternatively spliced introns and exons from human.Hum. Mol. Genet.11:451–464. Clifford, R., Edmonson, M., Hu, Y., Nguyen, C., Scherpbier, T., and Buetow, K.H. 2000. Expression-based genetic/physical maps of single-nucleotide polymorphisms identified by the cancer genome anatomy project.Genome Res.10:1259–1265.
Dennis, C. 2001. Tiled arrays for gene hunting.Nat. Rev. Genet.2:161. Dias, N.E., Garcia, C.R., Verjovski-Almeida, S., Briones, M.R., Nagai,
M.A., da Silva Jr., W., Zago, M.A., Bordin, S., Costa, F.F., Goldman, G.H., et al. 2000. Shotgun sequencing of the human transcriptome with ORF expressed sequence tags.Proc. Natl. Acad. Sci.
97:3491–3496.
Dunham, I., Shimizu, N., Roe, B.A., Chissoe, S., Hunt, A.R., Collins, J.E., Bruskiewich, R., Beare, D.M., Clamp, M., Smink, L.J., et al. 1999. The DNA sequence of human chromosome 22.Nature402:489–495. Ewing, B. and Green, P. 1998. Base-calling of automated sequencer
traces using phred, II: Error probabilities.Genome Res.8:186–194. ———. 2000. Analysis of expressed sequence tags indicates 35,000
human genes.Nat. Genet.25:232–234.
Ewing, B., Hillier, L., Wendl, M.C., and Green, P. 1998. Base-calling of automated sequencer traces using phred, I: Accuracy assessment. Genome Res.8:175–185.
Florea, L., Hartzell, G., Zhang, Z., Rubin, G.M., and Miller, W. 1998. A computer program for aligning a cDNA sequence with a genomic DNA sequence.Genome Res.8:967–974.
Garg, K., Green, P., and Nickerson, D.A. 1999. Identification of candidate coding region single nucleotide polymorphisms in 165 human genes using assembled expressed sequence tags.Genome Res. 9:1087–1092.
Gautheret, D., Poirot, O., Lopez, F., Audic, S., and Claverie, J.M. 1998. Alternate polyadenylation in human mRNAs: A large-scale analysis by EST clustering.Genome Res.8:524–530.
Hattori, M., Fujiyama, A., Taylor, T.D., Watanabe, H., Yada, T., Park, H.S., Toyoda, A., Ishii, K., Totoki, Y., Choi, D.K., et al. 2000. The DNA sequence of human chromosome 21.Nature405:311–319. Hide, W.A., Babenko, V.N., van Heusden, P.A., Seoighe, C., and Kelso,
J.F. 2001. The contribution of exon-skipping events on chromosome 22 to protein coding diversity.Genome Res.11:1848–1853. Hu, G., Modrek, B., Riise Stensland, H.M., Saarela, J., Pajukanta, P.,
Kustanovich, V., Peltonen, L., Nelson, S.F., and Lee, C. 2002. Efficient discovery of single-nucleotide polymorphisms in coding regions of human genes.Pharmacogenomics J.2:236–242.
Hudson, T.J., Colbert, A.M., Reeve, M.P., Bae, J.S., Lee, M.K., Nussbaum, R.L., Budarf, M.L., Emanuel, B.S., and Foote, S. 1994. Isolation and regional mapping of 110 chromosome 22 STSs.Genomics 24:588–592.
Huminiecki, L. and Bicknell, R. 2000. In silico cloning of novel endothelial-specific genes.Genome Res.10:1796–1806.
Irizarry, K., Kustanovich, V., Li, C., Brown, N., Nelson, S., Wong, W., and Lee, C.J. 2000. Genome-wide analysis of single-nucleotide polymorphisms in human expressed sequences.Nat. Genet. 26:233–236.
Iseli, C., Stevenson, B.J., de Souza, S.J., Samaia, H.B., Camargo, A.A., Buetow, K.H., Strausberg, R.L., Simpson, A.J., Bucher, P., and Jongeneel, C.V. 2002. Long-range heterogeneity at the 3⬘ends of human mRNAs.Genome Res.12:1068–1074.
Jiang, J. and Jacob, H.J. 1998. EbEST: An automated tool using expressed sequence tags to delineate gene structure.Genome Res.8:268–275. Kan, Z., Rouchka, E.C., Gish, W.R., and States, D.J. 2001. Gene structure
prediction and alternative splicing analysis using genomically aligned ESTs.Genome Res.11:889–900.
Kan, Z., States, D., and Gish, W. 2002. Selecting for functional alternative splices in ESTs.Genome Res.12:1837–1845.
Kapranov, P., Cawley, S.E., Drenkow, J., Bekiranov, S., Strausberg, R.L., Fodor, S.P., and Gingeras, T.R. 2002. Large-scale transcriptional
activity in chromosomes 21 and 22.Science296:916–919. Katsanis, N., Worley, K.C., Gonzalez, G., Ansley, S.J., and Lupski, J.R.
2002. A computational/functional genomics approach for the enrichment of the retinal transcriptome and the identification of positional candidate retinopathy genes.Proc. Natl. Acad. Sci. 99:14326–14331.
Kent, W.J., Sugnet, C.W., Furey, T.S., Roskin, K.M., Pringle, T.H., Zahler, A.M., and Haussler, D. 2002. The human genome browser at UCSC. Genome Res.12:996–1006.
Kikuno, R., Nagase, T., Waki, M., and Ohara, O. 2002. HUGE: A database for human large proteins identified in the Kazusa cDNA sequencing project.Nucleic Acids Res.30:166–168.
Lander, E.S., Linton, L.M., Birren, B., Nusbaum, C., Zody, M.C., Baldwin, J., Devon, K., Dewar, K., Doyle, M., FitzHugh, W., et al. 2001. Initial sequencing and analysis of the human genome.Nature 409:860–921.
Lee, Y., Sultana, R., Pertea, G., Cho, J., Karamycheva, S., Tsai, J., Parvizi, B., Cheung, F., Antonescu, V., White, J., et al. 2002.
Cross-referencing eukaryotic genomes: TIGR Orthologous Gene Alignments (TOGA).Genome Res.12:493–502.
Liang, F., Holt, I., Pertea, G., Karamycheva, S., Salzberg, S.L., and Quackenbush, J. 2000. Gene index analysis of the human genome estimates approximately 120,000 genes.Nat. Genet.25:239–240. Megy, K., Audic, S., and Claverie, J.M. 2003. Positional clustering of differentially expressed genes on human chromosomes 20, 21 and 22.Genome Biol.4:P1.
Modrek, B., Resch, A., Grasso, C., and Lee, C. 2001. Genome-wide detection of alternative splicing in expressed sequences of human genes.Nucleic Acids Res.29:2850–2859.
Nakajima, D., Okazaki, N., Yamakawa, H., Kikuno, R., Ohara, O., and Nagase, T. 2002. Construction of expression-ready cDNA clones for KIAA genes: Manual curation of 330 KIAA cDNA clones.DNA Res. 9:99–106.
Penn, S.G., Rank, D.R., Hanzel, D.K., and Barker, D.L. 2000. Mining the human genome using microarrays of open reading frames.Nat. Genet.26:315–318.
Phillips, R.L., Ernst, R.E., Brunk, B., Ivanova, N., Mahan, M.A., Deanehan, J.K., Moore, K.A., Overton, G.C., and Lemischka, I.R. 2000. The genetic program of hematopoietic stem cells.Science 288:1635–1640.
Picoult-Newberg, L., Ideker, T.E., Pohl, M.G., Taylor, S.L., Donaldson, M.A., Nickerson, D.A., and Boyce-Jacino, M. 1999. Mining SNPs from EST databases.Genome Res.9:167–174.
Reymond, A., Camargo, A.A., Deutsch, S., Stevenson, B.J., Parmigiani, R.B., Ucla, C., Bettoni, F., Rossier, C., Lyle, R., Guipponi, M., et al. 2002. Nineteen additional unpredicted transcripts from human chromosome 21.Genomics79:824–832.
Roest, C.H., Jaillon, O., Bernot, A., Dasilva, C., Bouneau, L., Fischer, C., Fizames, C., Wincker, P., Brottier, P., Quetier, F., et al. 2000. Estimate of human gene number provided by genome-wide analysis usingTetraodon nigroviridisDNA sequence.Nat. Genet.25:235–238. Shoemaker, D.D., Schadt, E.E., Armour, C.D., He, Y.D., Garrett-Engele,
P., McDonagh, P.D., Loerch, P.M., Leonardson, A., Lum, P.Y., Cavet, G., et al. 2001. Experimental annotation of the human genome using microarray technology.Nature409:922–927.
Silva, A.P., Salim, A.C., Bulgarelli, A., de Souza, J.E., Osorio, E., Caballero, O.L., Iseli, C., Stevenson, B.J., Jongeneel, C.V., de Souza, S.J., et al. 2003. Identification of 9 novel transcripts and two RGSL genes within the hereditary prostate cancer region (HPC1) at 1q25. Gene310:49–57.
Sorek, R. and Safer, H.M. 2003. A novel algorithm for computational identification of contaminated EST libraries.Nucleic Acids Res. 31:1067–1074.
Strausberg, R.L., Feingold, E.A., Klausner, R.D., and Collins, F.S. 1999. The mammalian gene collection.Science286:455–457.
Strausberg, R.L., Buetow, K.H., Emmert-Buck, M.R., and Klausner, R.D. 2000. The cancer genome anatomy project: Building an annotated gene index.Trends Genet.16:103–106.
Strausberg, R.L., Feingold, E.A., Grouse, L.H., Derge, J.G., Klausner, R.D., Collins, F.S., Wagner, L., Shenmen, C.M., Schuler, G.D., Altschul, S.F., et al. 2002. Generation and initial analysis of more than 15,000 full-length human and mouse cDNA sequences.Proc. Natl. Acad. Sci. 99:16899–16903.
Tugendreich, S., Bassett Jr., D.E., McKusick, V.A., Boguski, M.S., and Hieter, P. 1994. Genes conserved in yeast and humans.Hum. Mol. Genet.3:1509–1517.
Venter, J.C., Adams, M.D., Myers, E.W., Li, P.W., Mural, R.J., Sutton, G.G., Smith, H.O., Yandell, M., Evans, C.A., Holt, R.A., et al. 2001. The sequence of the human genome.Science291:1304–1351. Wang, Z., Lo, H.S., Yang, H., Gere, S., Hu, Y., Buetow, K.H., and Lee,
Res.63:655–657.
Wiemann, S., Weil, B., Wellenreuther, R., Gassenhuber, J., Glassl, S., Ansorge, W., Bocher, M., Blocker, H., Bauersachs, S., Blum, H., et al. 2001. Toward a catalog of human genes and proteins: Sequencing and analysis of 500 novel complete protein coding human cDNAs. Genome Res.11:422–435.
Williamson, A.R. 1999. The Merck Gene Index project.Drug Discov. Today4:115–122.
Xie, H., Zhu, W.Y., Wasserman, A., Grebinskiy, V., Olson, A., and Mintz, L. 2002. Computational analysis of alternative splicing using EST tissue information.Genomics80:326–330.
Xu, Q., Modrek, B., and Lee, C. 2002. Genome-wide detection of tissue-specific alternative splicing in the human transcriptome. Nucleic Acids Res.30:3754–3766.
Yelin, R., Dahary, D., Sorek, R., Levanon, E.Y., Goldstein, O., Shoshan, A., Diber, A., Biton, S., Tamir, Y., Khosravi, R., et al. 2003. Widespread occurrence of antisense transcription in the human genome.Nat. Biotechnol.21:379–386.
Yu, Y., Zhang, C., Zhou, G., Wu, S., Qu, X., Wei, H., Xing, G., Dong, C., Zhai, Y., Wan, J., et al. 2001. Gene expression profiling in human fetal liver and identification of tissue- and
developmental-stage-specific genes through compiled expression
profiles and efficient cloning of full-length cDNAs.Genome Res. 11:1392–1403.
WEB SITE REFERENCES
http://www.ncbi.nlm.nih.gov/entrez/query.fcgi?db=unigene; Unigene home page.
http://www.atcc.org; American Type Culture Collection home page. http://www.ncbi.nlm.nih.gov/refseq; RefSeq home page.
http://www.repeatmasker.org; RepeatMasker program.
http://genome.ucsc.edu/cgi-bin/hgBlat; University of California Santa Cruz, Genome Browser.
http://200.18.51.201/viewtfi; Information related to TFUs selected for experimental validation.
http://200.18.51.201/transcript/Participants.html; Full list of participant groups of The Ludwig-FAPESP Transcript Finishing Initiative. http://200.18.51.201/viewconsensus; Access to consensus sequences
generated for validated TFUs.