Health Econ. : 533 – 544 (1998)
ECONOMICS OF HEALTH CARE SYSTEMS
THE BLACK BOX OF HEALTH CARE
EXPENDITURE GROWTH DETERMINANTS
PEDRO PITA BARROSa,b,*
aUni6ersidade No6a de Lisboa,Lisboa,Portugal bCentre for Economic Policy Research(CEPR),London
SUMMARY
In this paper, the determinants of growth of aggregate health expenditures are investigated. The study departs from previous literature in that it looks at differences across countries in growth (and not levels) of health care expenditures. Estimation is made for 24 OECD countries. Health system characteristics usually believed to influence health expenditures growth, like population ageing, the type of health system (public reimbursement, public contract or integrate) and existence of gatekeepers, are found to be non-significant. Nevertheless, there is evidence that health expenditures experienced a clear slower growth in the last decade. The explanation for this slowdown could not be found in the proposed model and should stimulate further research. © 1998 John Wiley & Sons, Ltd.
KEY WORDS— expenditures growth; health care spending
INTRODUCTION
The health economics literature has seen, over the last two decades or so, a considerable number of studies trying to explain cross-country variations in health spending. Better databases have allowed for increased sophistication of analysis and more robust inferences (and policy implications). A good example of this line of research is found in Gerdtham et al. [1], which summarizes in a very clear way previous contributions and uses a larger pooled sample to perform new hypothesis tests.
However, surprisingly enough no attention has been given to explanations for health care expen-ditures growth differences across countries. This paper contributes (at least, partially) to a better understanding of growth in health care expendi-tures on the basis of cross-country and time-series variations. It is argued that existing literature on explanations of cross-country differences in health
care expenditures and the relative success of dis-tinct health systems in cost-containment must be complemented with studies looking directly at growth rates of health care expenditure and its determinants. The analysis should, therefore, be understood as complementary to previous studies of level differences in health spending.
On theoretical grounds, the analysis of expendi-ture level differences explains what factors charac-terize less costly health care systems at a certain point in time, while analysis of growth rates indi-cates which systems favour a greater growth of health spending (even if the system converges to a lower steady-state value than other systems).
Policy recommendations on health system orga-nization should not be based solely on studies on the level of health care expenditures. Understand-ing the pace of growth of health spendUnderstand-ing can be as important as understanding of level differences across health systems. For example, the analysis
* Correspondence to: Faculdade de Economia, Universidade Nova de Lisboa, Travessa Esteˆva˜o Pinto, P-1070 Lisboa, Portugal. Tel:+351 13833624; Fax: +351 13886073; ppbarros@fe.unl.pt
in levels may find that certain characteristics of health systems favour lower costs. However, to say it also implies a lowergrowthrate is a differ-ent matter.
A study somewhat close to this paper is due to Newhouse [2]. Newhouse presents a health expen-ditures growth accounting analysis for the US. He concludes that about 50% of the increase in costs could not be explained by traditional factors and attributed it to technological progress.
The methodology of analysis is borrowed from recent empirical growth theory, namely works focusing on convergence. (Barro and Sala-i-Mar-tin [3] provide a review of the most important studies in chapters 11 and 12.) It should be stressed that health-related variables (typically life expectancy type of variables) have been employed as regressors in GDP growth equations. Also, there is empirical evidence on the link between life expectancy at birth and GDP levels, where a positive but decreasing relation between life ex-pectancy and per capita GDP is found. (See Barro and Sala-i-Martin [3], chapter 12.) There is, how-ever, no received knowledge on the contribution of GDP growth to health expenditures growth. Therefore, we depart from the new growth empir-ical studies in this respect.
Before proceeding to the analysis and in order to motivate the reader, it is useful to look at dispersion of health expenditures per capita and how it has evolved over the least three decades. Only the countries for which a complete data set is available are included. There was, in the past 30 years, an increase in dispersion (measured by the S.D. in health expenditures per capita), showing that countries are moving apart on this matter.
However, average health expenditures per cap-ita have also increased substantially, making the ratio of S.D. over the mean fairly stable since the mid 1970s (Figure 1), with a slight downward trend. From 1960 to 1975, there is a clear decrease in relative dispersion across countries. The same evolution pattern occurs in the dispersion of the share of health care expenditures on GDP, even if S.D. over the mean has remained stable. Compu-tation of regressions of each variable on a con-stant term and a time trend, gives statistical support to the assertions made.
These basic stylized facts pose two interesting questions for researchers to answer. First, what causes this dispersion across countries (GDP level, characteristics of health systems, etc.)? The
exist-ing literature has mainly addressed this issue. Second, what lies behind the upward trend in health care expenditures and what are the best arrangements to act upon it? This question has seldom been analyzed and motivates the present paper.
Cost-containment goals are at the heart of most, if not all, reform proposals in the OECD countries (see OECD [7]). A recurrent theme in the literature is the relative success of different organizational frameworks for health care sys-tems. Hence, it seems desirable to test which systems did promote a lower rise in health care expenditure. This test may yield different results from hypothesis tests based on levels of health care spending. It can be the case that for some structural reason a country has, at a given point in time, a higher level of health care expenditure, without any relation to the health system in place. In cross-country level analysis this effect may be, at least partially, attributed to the type of the health system instead of being identified with country characteristics. The recent work of Gerdtham et al. [1,4,5] deals with this issue in a different way. The use of pooled, cross-section time-series data in expenditure levels, with enough data in both dimensions, allows for the identifica-tion of country-specific effects in their work. Of course, these are not the only studies. Another example of work on this line is due to McGuireet al. [8].
The distinction between determinants of level and growth of health expenditures is by no means a trivial one. It is not possible, a priori, to
lish a unique link saying that factors explaining cross-countries and over-time differences in the level of health care expenditures should also be the relevant ones to explain differences in growth rates. A health system that has a lower level of health expenditures may experience faster growth, for example. Also, health systems that performed relatively well in the sense of keeping health care spending at a low level may (or may not) be more vulnerable to growth, in a changing socio-eco-nomic environment. Systems that perform better in a certain moment may become, in the future, dominated.
Despite the small sample size our approach reveals some interesting results which, we hope, will stimulate further research. In particular, we found that the type of the health system, existence of a gatekeeping procedure and ageing of popula-tion are unable to explain average growth rates of health care expenditures. This leaves largely unex-plained the slowdown in growth rates observed in the 1980s.
The paper is organized as follows. The second section describes the methodology followed. Next, the third section discusses the database used. The fourth section presents the empirical results. Fi-nally, the fifth section concludes.
METHODOLOGY
The aim of the paper is quite simple, and so is the empirical approach followed. Due to the small sample size, only a limited number of hypothesis can be tested. We focus on health system features that may have contributed to cost-containment.
Judging cost-containment measures is a tricky business. Besides evaluating whether or not cost-containment measures are desirable (or to which extent should be pursued), targeting a value for health care expenditures is more a political issue than an economic one. Nevertheless, evaluation of effectiveness of such measures (let aside efficiency considerations for the time being) is warranted. If such evaluation is made on a cross-section basis alone, it is probably not possible to tell what is due to reforms and measures undertaken and what should be attributed to other factors (like country characteristics). Looking at growth rates of health care expenditures and their determinants yields, potentially, useful knowledge on this ground.
The first hypothesis to be tested is whether or not those countries that already spent relatively more in health care were also the ones where expenditure grew more.
The dissemination of medical knowledge (which is made at an increasingly faster pace) and wide availability of new drugs and equipment suggests that countries may experience a tendency to have similar per capita expenditures. (This notion is close to the concept of b-convergence in growth theory. Note, however, that the reasoning under-lying convergence theories cannot be applied to health care expenditure.) If this holds true, one should observe a higher growth rate in countries with initial lower expenditures level as they catch up with other countries. To test for the presence of a significant impact of the starting point, be-ginning of period values of the dependent variable are included in the econometric specifications.
Another important factor for health expendi-ture growth is, probably, GDP growth. In cross-country explanations of health care expenditure differences, GDP has been singled out as the most important explanatory variable. In fact, empirical studies systematically found that GDP accounts for more than 90% of the observed variation. Thus, cast in terms of growth rates, a positive association between GDP growth and health ex-penditure growth is expected.
Institutional features of health systems may influence health care expenditures growth rate. For example, fee-for-service rules do imply, in general, higher expenditures in health care than capitation schemes. Nonetheless, we cannot state that growth rates of health care expenditures will differ substantially in both systems.
To test for the importance of institutional ar-rangements on growth of health care expenditures two characteristics of health systems were in-cluded as possible determinants. The first is the OECD characterization of the health system as public reimbursement, public contract or public integrated. The second is the use of physicians/
demographic evolution (ageing of population, more precisely) has any bearing on the growth of overall health care spending. Existing studies es-sentially look at spending for different age co-horts and are based on micro data. The main finding is that population ageing is of less impor-tance for health care expenditures than usually held. Ageing has a strong impact on other aspects of the welfare state, like retirement pensions. Some extrapolation to health care services of this demographic pressure may have been made. Our direct test on growth rates complements these earlier studies.
The role of government financing has gener-ated some controversy, as both positive and neg-ative effects on total health care expenditure have
been reported. Gerdtham et al. [1] provide a
useful discussion of the empirical findings. More-over, Gouveia [11] has argued, theoretically and empirically, against the notion of perfect substitu-tion of public and private health care expendi-tures. This suggests the inclusion of the pro-portion of state-financed expenditure as a regres-sor to investigate whether or not systems with a larger state financing have experienced higher ex-penditures growth. A pioneer study on the rela-tion between the share of public expenditure in health and spending levels is due to Leu [12]. Our approach gives a panel data structure to the anal-ysis and time (decade) specific effects are added to the econometric specification. The panel data structure of the sample also allows for the intro-duction of country-specific effects but the small time dimension makes overall estimates reflect essentially cross-country differences, rendering imprecise estimates of the country effects. There-fore, we do not compute country-specific effects.
Since our interest lies in expenditure growth over time, the dependent variables are average growth rates over a decade. Three decades —
1960 – 1970, 1970 – 1980 and 1980 – 1990 — are
considered. The decision to use growth rates over a decade is, of course, open to criticism. There is a clear cost relative to alternatives like year-to-year or 5-year-to-year average growth rates: it consumes degrees of freedom. On the other hand, lower-fre-quency average growth rates have disadvantages of their own. The most important one is that some variables used in the analysis move slowly over time. Decade-wide averages capture broad trends instead of short-term variations, which would become more important sources of
varia-tion if shorter period averages were considered. Computation of the basic model with 5-year av-erage or year-to-year growth rates have the same qualitative results. The interested reader can find these estimates in Appendix B.
Besides growth analysis of health care expendi-tures, determinants for level differences are also investigated as a check for the data used. In this case, pooled data cover four points in time (1960, 1970, 1980 and 1990). The results are then dis-cussed with reference to existing studies, espe-cially the recent work of Gerdtham et al. [1].
THE DATA
All variables are extracted from the CREDES-OECD database [13]. The data set covers 24 OECD countries, although for longer periods non-availability of information dictates exclusion of some countries in the first two decades.
The set of countries in the sample is consti-tuted by Australia, Austria, Belgium, Canada, Denmark, Finland, France, Germany, Greece, Iceland, Ireland, Italy, Japan, Luxembourg, The Netherlands, New Zealand, Norway, Portugal, Spain, Sweden, Switzerland, Turkey, the UK and the US.
The dependent variable used is per capita health expenditure growth, averaged across a decade. This variable is valued at constant 1990 prices (in national currency units) and converted to the same basis by PPPs at the base year. (The same procedure was followed in Gerdtham et al. [1].) An alternative dependent variable would be the average growth of health expenditures over GDP. However, in growth regression equations, the two alternative dependent variables are linked by a simple linear transformation and, therefore, we should expect similar results from the analy-sis. The growth rate of the share of health care expenditures on GDP is equal to the growth rate of per capita health expenditures minus the growth rate of per capita GDP, which should be included as an explanatory variable (if the depen-dent variable is per capita health spending). It is thus clear that the empirical specifications are essentially the same when cast in terms of growth rates. Note this is not true for analysis in levels of health care expenditures.
To reflect initial conditions, the dependent
variable evaluated at its level value in the first year of the period is included. This variable is
denoted by TE per capita–T for per capita
expenditures;
A dummy variable controls for the existence of
gatekeeping, GK. It assumes value 1 if the
system has gatekeepers, zero otherwise. The countries for which gatekeeping is considered are Austria, Canada, Denmark, Germany, Ice-land, IreIce-land, Italy, The Netherlands, New Zealand, Norway, Portugal, Spain and the UK. The remaining countries are Australia, Belgium, Finland, France, Greece, Japan, Lux-embourg, Sweden, Switzerland, Turkey and the US;
Two dummy variables reflect the system’s type:
PR for public reimbursement (Australia,
Bel-gium, France, Italy (up to 1978), Japan,
Lux-embourg, Switzerland and US) and PI for
integrated (Denmark, Finland, Greece (from 1983), Iceland, Ireland, Italy (from 1979), New Zealand, Norway, Portugal (from 1978), Spain (from 1984), Sweden and the UK). The remain-ing case is the baseline system, public contract (Austria, Canada, Germany, Greece (up to 1982), The Netherlands, Portugal (up to 1977), Spain (up to 1983) and Turkey). For those countries which recently (last two decades) changed the nature of the system the procedure was to include them in the system to which they belong most of the period. This definition of systems’ types follows the characterization of OCDE. It is, of course, open to criticism. Health systems are sufficiently complex and diversity of institutional arrangements suffi-ciently large to make it impossible to have a simple, manageable, classification that is uni-versally accepted. Instead of engaging in the debate over the proper classification, we opt to use the one of OECD;
The income variable employed is GDP average
growth rate over the period, GDPGR;
ageing of population is measured simply by the
change in the percentage of population over 65,
AGE65;
Dummies variable for the decades 1970 – 1980
and 1980 – 1990, respectivelyD7080andD8090, are also included. Each of the variables takes value 1 if the observation belongs to the decade, zero otherwise. The decade 1960 – 1970 is taken as the baseline case. This procedure corresponds to fixed time effects.
The role of state-financed expenditures is
prox-ied by the share of state financing on overall health care expenditures, as in previous work.
Summing up, the equation to be estimated has the linear form
y;i=aXi+ei (1)
wherey;idenotes growth rate ofyi,Xidenotes the
vector of exogenous variables described above and ei is an error term following a NID(0, s
2
) process. Results for a log – log form are essentially the same. For regressions in levels, the double logarithmic form has performed better (Gerdtham
et al. [4]). Since results do not differ qualitatively from the linear specification, the latter is retained (regressions not shown).
RESULTS
Table 1 presents the estimated effects of exoge-nous variables on growth of total health care expenditure (per capita). The first column pre-sents the preferred specification. Substantial ex-perimentation with the model resulted in several simplifications. Individual and joint significance tests were performed using likelihood ratio tests.
From the factors outlined, the dummy variable for the decade 1980 – 1990 and GDP per capita have a significant impact.
Table 1. Results for growth rate equations
Growth rate of health expenditures per capita
Constant 7.62 7.61 7.94 5.84 4.51
(6.45) (6.10) (4.93) (3.52) (4.23)
GDPGR 0.62 0.65 0.65 0.85 0.92
(3.69) (3.82) (3.35) (3.73) (4.69)
PR 0.24 −0.56 (0.31) (−0.07)
PI −0.04 −1.62 (−0.01) (−0.22)
GK −0.36 −0.71 (−0.57) (−1.21)
D8090 −0.89 −0.51 −0.92
(−1.86) (−0.49) (−0.01)
D7080 0.48 −0.09 (0.57) (0.10)
AGE65 −0.27 −0.31 (−1.15) (−1.15)
PUBFIN −0.02 −0.07 (−0.11) (0.39)
TE per capita–T −0.096 −0.102 −0.099 −0.033 −0.035 (−4.34) (−4.65) (−3.75) (−2.80) (−3.51)
(TE per capita–T)2 0.037 0.037 0.036
(2.96) (3.24) (2.70)
AdjustedR2 0.704 0.710 0.688 0.417 0.627
Number of obs. 65 65 65 65 65
The values shown in parenthesis aret-ratios, based on White’s robust S.E.s.
1300.) At the highest values in the sample, the relation exhibits already a positive marginal ef-fect. It is, however, rather small (the maximum value is not even a S.E. way from a zero value).
These figures corroborate the inference that a catching-up effect in health care expenditures seems to exist, as countries tend to converge to similar per capita spending levels.
The negative sign associated with the dummy variableD8090shows that in the 1980s a common trend to the OECD countries was a lower growth rate. This may be due to cost-containment efforts, which had some success relative to growth in the previous two decades. OECD [7] describes mea-sures undertaken in a selected sample of OECD countries. Since none of the other proposed ex-planatory variables turn out to be significant, the slowdown in the growth rate remains largely un-explained. The identification of factors that suc-cessfully contributed to a lower growth of health care expenditure should be pursued in future research.
The non-significance of all other variables means that, apparently, the existence of gatekeep-ers or the type of health system (public reimburse-ment, public contract or integrated) have played no significant role to contain health expenditure
Table 2. The effect of initial conditions
Marginal effect of Initial values initial values
Maximum 0.010 1435.000
Minimum −0.091 53.389
Average −0.047 664.945
growth. This finding suggests that the type of health system may have implications for the ex-planation of the level of health care expenditures
across countries, but not on growth rates. The
main specifications were also estimated separately for each time period. No change in the qualitative inferences has resulted from the exercise.
On the other hand, ageing of population and the relative size of state financing have not con-tributed to growth of health spending. The first finding runs against common wisdom but it is in line with previous studies, which have found no significant impact of population ageing [9,10].
Another interesting result was that economy’s growth, measured by per capita GDP growth, had a significant bearing on health expenditure in-creases. This suggests an income elasticity lower than but close to unity, which is not far apart from existing estimates.
A final word with respect to the adjusted R2.
Irrespective of whether the obtained value should be considered high or low, it is worth noting that the unexplained residual amounts to roughly 30%. This is below Newhouse’s [2] estimate of a techno-logical progress residual in health care rising costs in the US. Since no control for technology pro-gress was made, we cannot exclude expensive new technology as the main driving force behind health expenditures growth, carrying onto inter-national comparison of health care systems the same consideration that have been put forward by Newhouse for the US. Of course, many other factors may be lying behind this finding. Future research, as better data becomes available, should improve our understanding of the role of techno-logical change. It is not claimed that technology is accountable for the large residual. It is, however, the case that our results do not run against an important role of technology in the growth of health care spending.
The somewhat striking results obtained strongly advises to perform some misspecification tests. The application of the RESET test in the pre-ferred linear specification has led to the inclusion of quadratic terms of exogenous variables. After extensive testing of individual and joint signifi-cance, the maintained specification is presented in the first column of Table 1. A description of the tests performed, as well as further information on the results can be found in Appendix A. Essen-tially, the qualitative results show robustness across specifications, the major difference being
Table 3. Results for level equations
Health expenditures per capita
63.33 35.12
Constant
(0.32) (0.65)
GDP 0.106 0.108
(20.19) (24.70)
GK 15.45
(0.30)
PI −13.00
(−0.24)
−121.55
−14.73
PR
(−1.71) (−2.82)
AGE65 4.78 (0.50)
PUBFIN −6.38 −6.18 (−3.75) (−4.75)
AdjustedR2 0.877 0.880
89
Number of obs. 89
The values shown in parenthesis are t-ratios based on robust S.E.s.
the introduction of a quadratic term on the initial value of health expenditures. Additional tests for non-normality of error terms and exogeneity of GDP growth were also performed, and the null hypothesis was not rejected in either case. Ap-pendix A describes in more detail the procedures and the results of the tests.
previous model, no misspecification tests were performed. This is justified by the objective of sticking as close as possible to earlier work on level differences across countries in total per capita health spending.
The result is in contradiction with the earlier study of OECD [14], which has found that pub-lic reimbursement systems are more expensive than public contract or integrated systems.
On the other hand, the recent study of Gerdtham et al. [1] presents the same qualitative
results. Our estimates show that Gerdtham et
al.’s [1] findings of public reimbursement being the least costly system is robust to larger time-dimension variation. Since variables present in this type of studies evolve slowly over time, the cross-section times-series data for contiguous years tends to reflect essentially the cross-coun-try variation. Our approach of using
observa-tions spaced in time (decade) allows time
variation to play a bigger role in determining estimates.
In addition, we have the negative effect of public financing of health case services, which was a result already present in Gerdtham et al. [1]. The effect results from budgetary pressures on most OECD countries. In fact, public financ-ing of health expenditures as a share of total expenditures has decreased in most countries but so have the weight of public health expenditures on government’s budget. (The correlation coeffi-cient between change in public health expendi-tures as a fraction of total health expendiexpendi-tures and as a fraction of total public expenditure is about 0.6.) This suggests that priority setting at the budget table is probably the explanation for this effect (which does not correspond to a gen-eral trend of lower role for the public sector).
As in growth rate analysis, the presence of gatekeepers and ageing of population have no explanatory power of health care expenditures.
Overall, these estimates are qualitatively simi-lar to the ones present in recent studies, suggest-ing that no significant bias emerges from the database used and that results on growth rates will probably hold in other data sets as well.
FINAL REMARKS
Making inferences about health care expenditure patterns, based on broad aggregates over
coun-tries and time, is risky, especially if they are not in accordance with received wisdom of previous
work. Hence, results should be interpreted
carefully.
Using decade-average growth to isolate the analysis from short-run random influences, we found that variables believed to influence health
expenditures increases are essentially
non-significant.
This is a mix of good news (as it corroborates earlier findings for the effects of ageing popula-tion) and bad news (as gatekeepers are usually seen as a way to achieve cost-containment).
We detect, nevertheless, a clear slowdown in health care expenditures (as GDP share) growth in the decade 1980 – 1990 relative to the average evolution in the two previous decades. The de-terminants of this slowdown are not identified by our model and the issue clearly calls for fur-ther research.
These seemingly ‘negative’ results are not contradictory with existing analysis of determi-nants of health care expenditure (in levels). This
is true both on empirical and theoretical
grounds.
On the empirical side, we performed typical estimations in levels, which gave qualitative re-sults consistent with those of, for example, Gerdtham et al. [1].
Combining both types of investigation — level differences and growth rates — we may say that even if some systems were able to sustain a lower spending in health care, increases in ex-penditures have hit in a roughly similar way all systems (thus preserving the level differences be-tween countries). This also gives a partial justifi-cation to why panel data analysis embodying contiguous yearly observations may yield esti-mates consistent with pure cross-section studies. The analysis is a little more refined than this, as initial position is negatively related to growth. That is, more costly systems tended to grow less. The magnitude of the effect is, however, small.
Finding the determinants of expenditure
ACKNOWLEDGEMENTS
I have benefited from the comments and suggestions of two referees. The usual disclaimer applies.
APPENDIX A: SPECIFICATION TESTS
The RESET test
A simple RESET test was applied to test for misspecification in the functional form. The RE-SET test assumes that the effect of omitted vari-ables can be proxied by some function of the original regressors. Being the function unknown, a polynomial approximation with coefficients re-placed by the estimates obtained under the null model was employed. The equation estimated was:
y;=aX+ % 4
j=2
bjyˆ j
+ei (2)
where yˆ denotes the fitted value under the null model. For a more detailed description of the test, see Godfrey [15].
The results of the test are presented in Table 4. The first line of the table presents the variables that were included in each regression. For exam-ple, in the third column, only the constant term, the GDP growth rate and the initial value of per capita expenditures were included.
The results show that there is a clear misspecifi-cation problem in the regression without the quadratic term in the initial position, while this is no longer true in the other two cases (the likeli-hood ratio test does not reject the null hypothesis of no misspecification).
Table 5. Exogeneity tests
Const. 8.588 5.034 (5.07) (2.97)
GDPGR 0.457 0.811 (1.73) (2.61)
−0.110
y–T −0.038
(−2.83) (−4.60)
0.038
y2 –T
(3.43)
z 0.420 0.248
(0.49) (0.97)
AdjustedR2 0.696070 0.622504 Log. Likelihood 174.228 167.146
Test for exogeneity of GDP growth
From the set of exogenous variables, one may argue that GDP growth is not exogenous. To test for it, a type of ‘omitted variables’ test was per-formed. (For the details, see Godfrey [15].) The regression equation was augmented by the resid-ual estimate of the value of GDP growth on a set of instruments. The instruments were GDP level (at the end of previous period), country dummies and health expenditure to GDP at the end of previous period.
As the statistical significance of z is low (the coefficient is not statistically different from zero), we conclude that the hypothesis of exogeneity is not rejected (Table 5).
Non-normality tests
Finally, we also tested for non-normal error terms, using the statistic:
Table 4. RESET tests
Variables (const,GDPGR,y–T) y2–T,D9080 y2–T bj=0
0.704275
AdjustedR2 0.710380 0.626903
Log. likelihood 175.618 174.198 166.999
bj"0
0.690770 0.707533
AdjustedR2 0.714051
175.268
177.645 174.613
n
S 26 +
(k−3)2
24
x(2)2 (3)
where S is skewness and k is kurtosis of the
residual. The main inference from application of the test to the various regressions is that we do not reject the null hypothesis of normality. For example, for the maintained model, S= −0.558,
k=3.744, the value of the statistic being 4.87, which is below the critical level of thex2
distribu-tion with two degrees of freedom, at the usual 5% significance level (which is 5.99).
APPENDIX B: FURTHER ESTIMATES
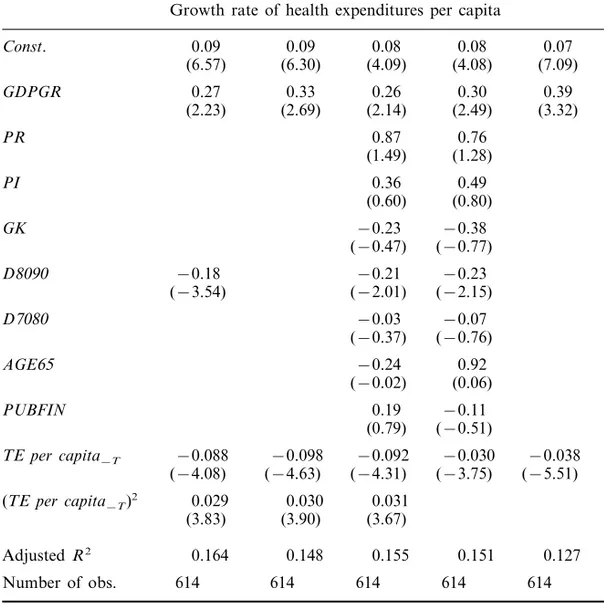
The reader may ask how much of the results is dependent on the use of 10-year average growth rates. To cope with that question, Table 6 pre-sents estimates based on 5-year average growth rates. Similarly, Table 7 reports estimates using year-to-year average growth rates. (Data for all countries and periods was not available. The most complete set of data available was used.) In the former case, as we consider a 5-year period,
quin-Table 6. Five-year average growth rate estimates
Growth rate of health expenditures per capita
4.37
Const. 7.33 6.88 5.33 4.28 (3.23)
(4.29) (3.96) (2.72) (2.53)
0.88 0.76
0.79 0.96
0.68
GDPGR
(3.57)
(2.52) (3.03) (2.45) (2.71)
PR 0.72 0.61
(0.85) (0.99)
PI 0.54 0.66
(0.80) (0.94)
GK −0.13 −0.33 (−0.22) (−0.58)
1.50 1.28
D7065
(1.27) (1.04)
D7570 2.08 1.75 (1.70) (1.41)
−0.45 0.004
D8075
(0.04) (−0.37)
−1.63 −0.81
D8580 −1.03
(−0.57) (−0.73) (−2.62)
−0.29 −0.44
−1.09
D9085
(−1.75) (−0.21) (−0.32)
AGE65 −0.18 −0.11 (−0.43) (−0.25)
−0.10
−0.09
PUBFIN
(−0.40) (−0.49)
−0.030
−0.024
−0.084
−0.088
−0.083
TE per capita–T
(−3.57) (−3.87)
(−3.82) (−3.23) (−3.53)
(TE per capita–T)2 0.030 0.030 0.032
(3.10) (3.21) (2.75)
AdjustedR2 0.496 0.481 0.511 0.468 0.441
125 125
Number of obs. 125 125 125
Table 7. Year-to-year average growth rate estimates
Growth rate of health expenditures per capita
Const. 0.09 0.09 0.08 0.08 0.07
(6.57) (6.30) (4.09) (4.08) (7.09)
GDPGR 0.27 0.33 0.26 0.30 0.39
(2.23) (2.69) (2.14) (2.49) (3.32)
PR 0.87 0.76
(1.49) (1.28)
PI 0.36 0.49
(0.60) (0.80)
GK −0.23 −0.38 (−0.47) (−0.77)
D8090 −0.18 −0.21 −0.23
(−3.54) (−2.01) (−2.15)
D7080 −0.03 −0.07 (−0.37) (−0.76)
AGE65 −0.24 0.92 (−0.02) (0.06)
PUBFIN 0.19 −0.11 (0.79) (−0.51)
TE per capita–T −0.088 −0.098 −0.092 −0.030 −0.038 (−4.08) (−4.63) (−4.31) (−3.75) (−5.51)
(TE per capita–T)2 0.029 0.030 0.031
(3.83) (3.90) (3.67)
AdjustedR2 0.164 0.148 0.155 0.151 0.127
Number of obs. 614 614 614 614 614
The values shown in parenthesis aret-ratios, based on White’s robust S.E.s.
quennial dummy variables were included. Com-parison with Table 1 reveals the same qualitative features are common to all sets of estimates.
REFERENCES
1. Gerdtham, U.-G., Jonsson, B., MacFarlan, M. and Oxley, H. The determinants of health care expendi-ture in OECD countries: a pooled data analysis. Paper presented at the Third European Congress in Health Economics, Stockholm, August 1995. 2. Newhouse, J. Medical care costs: how much
wel-fare loss?Journal of Economic Perspecti6es1992;6:
3 – 21.
3. Barro, R. and Sala-i-Martin, X.Economic Growth. New York: McGraw-Hill, 1995.
4. Gerdtham, U.-G. Pooling international health care expenditure data.Health Economics1992;11: 217 –
231.
5. Gerdtham, U.-G., Sogaard, J., Jonsson, B. and Andersson, F. A pooled cross-section analysis of the health care expenditures of the OECD coun-tries. In: Zweifel, P. and Frech, II H.E. (eds.)
Health economics worldwide. Dordrecht: Kluwer Academic Publishers, 1992: 287 – 310.
7. OECD. The reform of health care systems — a re-view of seventeen OECD countries. Health Policy Studies No. 5, Paris 1994.
8. McGuire, A., Parkin, D. and Hughes, D. Econo-metric analyses of national health expenditures: can positive economics answer normative questions?
Health Economics1993;13: 113 – 126.
9. Zweifel, P., Felder, S. and Meier, M. Ageing of population and health care expenditure: a red her-ring? Paper presented at the Third European Con-gress in Health Economics, Stockholm, August 1995.
II H.E. (eds.) Health economics worldwide. Dor-drecht: Kluwer Academic Publishers, 1992. 11. Gouveia, M. The public sector and health care: an
empirical analysis. Paper presented at the 51st Con-gress of the International Institute of Public Fi-nance, Lisbon 1995.
12. Leu, R.E. The public-private mix and international health care costs. In: Culyer, A.J. and Jonsson, B. (eds.) Public and pri6ate health ser6ices. London:
Basil Blackwell, 1986.
13. CREDES-OECD. OECD health data 1996. Paris, 1996.
14. OECD. The reform of health care: comparati6e
analysis of se6en OECD countries. Health Policy
Studies No. 2, Paris 1992.
15. Godfrey, L.G. Misspecification tests in econo