AR
TICLE
1 Departamento de Saúde Coletiva, Centro de Pesquisas Aggeu Magalhães, Fiocruz. Av. Moraes Rego s/n, Cidade Universitária. 50670-420 Recife PE Brasil. kmedeiros@ cpqam.fiocruz.br 2 Instituto de Medicina Social, Universidade do Estado do Rio de Janeiro. Rio de Janeiro RJ Brasil.
Fiscal Responsibility Law and expenditure on health personnel:
an analysis of the condition of Brazilian municipalities
from 2004 to 2009
Abstract The limits for expenditure on personnel that were imposed by the Fiscal Responsibility Act (FRA) have been considered by local health man-agers as an obstacle to health sector policies. This paper analyzes the linear trend for the personnel expenses indicators and the correlation of this with the profile of spending on health care person-nel in 5,356 Brazilian municipalities from 2004 to 2009. The study of the time series used data from the ‘Finanças do Brasil’ (Finbra) and data from the Information System on Public Health Budgets (SIOPS). There was a trend towards an increase of 1.3% in the annual average of total personnel expenditure in the municipalities, but the cost of health care staff did not follow that growth. There were no correlations between the indicators, and this result is contrary to the arguments given by the health managers. They attribute the problems with hiring workers and the expansion of health systems to the FRA. The availability of data from the Finbra and the Siops system is associated with a lack of knowledge on these issues. This makes it an opportune time for conducting new research.
Key words Health expenditure, Information
sys-tem, Health policy, Fiscal policy Katia Rejane de Medeiros 1
Paulette Cavalcanti de Albuquerque 1
Ricardo Antônio Wanderley Tavares 2
M
ed
eir
os KR
Introduction
As has been observed in other countries, in Bra-zil in the 1990s, measures were introduced which had a neo-liberal character in the economic plan that required a more conservative fiscal position
on the part of the Central Government1. In this
context, in the final period, the Fiscal Responsi-bility Law (FRA) emerged which reflects a group of standards covering public finances with the aim of fostering more accountability in fiscal management. This is supported by the pillars of: planning, transparency, control and accountabil-ity in the use of public resources. The FRA aims to act in strengthening national federalism which permits an isonomic approach by the Federal Government, States and/or municipalities in the country.
Based on its pillars and its aim of fostering fiscal accountability as well as curbing the use of public finances to meet immediate priorities, the FRA has been said to have constructed a new fis-cal accountability policy that inhibits the adop-tion of irresponsible populist practices in
rela-tion to the public accounts2,3.
As a major attempt of “framing” sub-nation-al finances which is the major reason behind the disequilibrium in public national accounts, the FRA aims to provide equilibrium between tax receipts and spending in the three spheres with special attention being dedicated to limiting and
controlling expenditure on personnel4,5.
The reasons for this attention and the rela-tive measures taken for this type of expenditure is due to the fact that the high costs of those in the public sector, means that there is a reduction in the available tax receipts and the capacity of governments to offer basic public services such as education, health and public security. It also means there being restrictions on investment in
infrastructure6. In addition to this aspect, this
area is the main and current area of expenditure. Historically speaking, Brazilian states have spent a high sum on personnel. Between 1996 and 2000, the states spent on average 67% of its net and current income revenue (RCL) on their pub-lic-sector personnel. This contributed to their
disequilibrium and public debts6,7.
In this context, the FRA set limits regarding expenditure on personnel that applies to the three divisions of government. The limits are cal-culated as a percentage on the RCL meaning:
[...] the sum of the expenditure by entities of
the Federation on: working personnel, non-work-ing personnel and those that receive government
pay outs as a pension (or due to the death of a close family member or a disability), elected mem-bers with terms, roles, positions or jobs, civil and military personnel, and members of the governing administration covering any form of remuneration from personnel salaries and personnel benefits of any nature (fixed and variable) to pensions and social costs and the costs of outsourcing contracts that refer to the replacement of public officials, just to give some examples8.
For the municipal executive administration, the FRA set out the total spending limits on per-sonnel to be 54% of 60% of the RCL. Thus, the so
called prudential limit in the municipal sphere is
equivalent to 51.3% of the total costs on
person-nel9. Non-compliance with this limit would make
municipalities more vulnerable to not meeting their financial objectives and they may be subject to the imposition of penalties as set out in the
FRA9.
The implementation of this law on Brazilian public finances slowly started to raise interest in the academic community. Repercussions were felt at events on administration and accounting so that between 2000 and 2010, 153 studies were conducted of which 60% analyzed the effects of
the FRA in the municipalities10.
Others studies showed that there is a margin for expenditure on personnel amongst Brazilians
municipalities1,6.
Giuberti6 conducted a study into the
spend-ing on personnel by a group of non-paired Bra-zilian municipalities between 1997 and 2003 and concluded that the spending limit set out by
law, did not affect it. In a similar vein, Menezes1
(2006) conducted an analysis of the period be-tween 1998 to 2004 for the same group of munic-ipalities, revealing that the number of those that exceeded the spending limits on personnel as set out in the FRA, was insignificant.
In spite of the proof, some sectors state that
the FRA has caused administrative “plastering”8,
which is notable in the face of the challenge for public policies in areas such as health. Where one considers the specific nature of the health sector where most personnel work together in multi-professional teams dividing their tasks and there being a high level of dependency amongst each professional and the high dependence on the
obtaining of personnel human resources11, any
draconian limits on the contracting of staff will affected the health services for the population.
person-aúd
e C
ole
tiv
a,
22(6):1759-1769,
2017
nel imposed by the FRA, arguing that they im-pede the development of the Brazilian National Health System (SUS) in the municipal ambit, par-ticularly with regards to the contracting of staff.
The complaints related to the FRA impeding the contracting of staff between 2004 and 2012 was spotlighted in 23 letters, three newspapers in
addition to 19 Conasems’ magazines12.
It has been noted that the FRA was related to
the crisis in governing in the sector13. For Silva and
Silva14, in the health remit it can be said that the
FRA created a paradox as: “[...] at the same time in which the state holds accountable the managers in SUS for the provision of complete and universal health services, it stops them from hiring staff for
the execution of these public policies.”14.
Within this climate, from the congresses held by Conasems between 2006 and 2008, some stud-ies were conducted that shed some light on the resulting problems with the statutory limits and the implications of the FRA in the hiring of staff in health. In 2008 the need for knowledge on the impact of the FRA in the allocation of human resources in health, was included in the national
agenda as a priority for health research15.
However, the incorporation of the issues to be discussed still did not permit, in a satisfactory way, the identification of responses or definitive solutions to the problem.
There are no publications that have investi-gated the effects of the FRA in the remit of health policies, recognizing the specific nature of this sector and using tax revenue data and data on spending which is available on the public ac-counts information systems in studies.
Considering the need to understand the im-pact of the FRA on the spending on personnel in health care in Brazilian municipalities, this paper presents an analysis of the time trends for the spending indicators on personnel and the cor-relation between this and the spending profile on health staff as well as the capacity to raise tax rev-enue and the dependency situation that existed between 2004 and 2009.
Methods
Conducting a time series study. In this “[...] the same area or population is investigated at distinct
moments in time[...]”16.
The Financial System of Brazil (Finbra) and the total spending indicator on personnel (DTP) were analyzed. On the Information System on Public Health Budgets (Siops), the spending
in-dicator on health staff (DPS) was used as well as the capacity to raise tax revenue by the munici-pality (CAM) and the proportion of inter-gov-ernmental transferences (PTI).
The information systems, respectively, fall within the remit of the Secretary of the Nation-al Finances (STN) and the Ministry of HeNation-alth whose public presence and access is made pos-sible through the following sites: http://www. tesouro.fazenda.gov.br and http://www.siops. datasus.gov.br. From these sites, information is obtained on tax receipts and the spending of
mu-nicipalities17,18.
On the Finbra, amongst other indicators, it is possible to identify the total volume of spend-ing on staff in the government spheres as well as investigating the compliance with the limit set out in the FRA. From Siops it was possible to ex-amine the proportion of the health budget spent on personnel in addition to the indicators of the capacity to raise tax revenue and the dependen-cy on the transference of inter-governmental re-sources which are applicable to purpose of
eval-uating the fiscal situation of the municipalities19.
The indicators researched on Finbra and Siops, their composition and what was measured, is ex-plained in Chart 1.
The criteria for defining the universe of the municipalities and the study period was: regu-larly updating the information systems and the continuous availability of the selected indicators for the highest paired number of possible munic-ipalities which resulted in the analysis of 4,356 municipal units between 2004 to 2009.
Without the objective of carrying out ad-justments or projections meaning searching to only analyze the tendencies of these indicators during the studied period, simple linear models were built (y = a + b. t) with the view to check-ing the significance of the inclination (b) for each
straight line20.
On the model, the independent variable was time (t = 1, 2, 3..,6) and with the dependent vari-able (y) which took the yearly average for the dis-tribution of each indicator by municipality.
The correlation coefficient was calculated for the total spending indicators on personnel cov-ering spending on health staff and the municipal autonomy indicator. This last one was created based on the ratio amongst the indicators that measure the capacity to raise tax revenue with the indicator that measures the municipal depen-dency on the transference of resources.
M
ed
eir
os KR
Chart 1. What the municipal indicators cover based on the data on FINBRA and SIOPS.
Indicator What is Covered by the
Indicator What is the response? SI
Percentage of the expenditure on personnel based on the net and current tax revenue in the municipality
PERSONNEL ASSETS (Personnel and Social Contributions - Pensions and Reforms - Government social payouts - Contributions to Closed Social Security Funds-Salary-Family- Employer Obligations-Other Personnel Expenditure due to Outsourced Contracts- Compulsory Deposits-Judicial Sentences- Costs from Past Financial Years-Employment Compensation Payouts-Reimbursement of Costs of Required Temporary Personnel) + Pension and Reforms + Government Social Payouts + Other Expenditure on Personnel due to Third Party Contracts
CURRENT REVENUE – SOCIAL CONTRIBUTIONS – DEDUCTIONS FROM CURRENT REVENUE
The limits/possibilities of expenditure on personnel. Investigate compliance with the legal limit for the municipalities in accordance with the FRA LC 101/2000.
Total Expenditure on Personnel=DTP
FINBRR
A
The percentage of tax receipts from the municipalities, total revenue excluding deductions.
TAX+ Fines and Interest on Arrears (MJM) on the Tax on Rural Territorial Property – (ITR)+ MJM on Property Tax (IPTU)+ MJM on Property Transfer Tax (ITBI)+ MJM on Services Tax (ISS)/ Tax on any Types of Services - (ISSQN)+ MJM of other taxes + MJM of the Outstanding Debt on ITR+ MJM of the Outstanding Debt on IPTU+ MJM of the Outstanding Debt on ITBI+ MJM of the Outstanding Debt on ISS/ ISQN, MJM of the Outstanding Debt on other Taxes+ Revenue from the Outstanding Debt of ITR+ Revenue from the Outstanding Debt of the IPTU+ Revenue from the Outstanding Debt of ITBI+ Revenue from the Outstanding Debt of ISSISS/ISQN+ Revenue from the Outstanding Debt of other taxes + TAX on Property and Income (Intra-budgetary) + TAX on Production and Circulation of Goods (Intra-Budgetary)+ Other Taxes (Intra-Budgetary)
CURRENT REVENUE+CAPITAL REVENUE + CURRENT REVENUE (intra-budgetary)
( - ) DEDUCTIONS FROM CURRENT REVENUE
Capacity for raising funds by the municipality
Capacity for raising funds by the
Municipalities = CAM
SIOPS
The percentage of inter-governmental transferences on the total revenue from the municipalities, excluding deductions.
Inter-governmental Transferences (Transf. Current) +Inter-governmental Transferences (Transf. of Capital)
CURRENT REVENUE+ CAPITAL REVENUE + CURRENT REVENUE (intra-budgetary)
( - ) DEDUCTIONS FROM CURRENT REVENUE
Degree of dependence by the municipalities in relation to the transferences from other government spheres
Proportion of inter-governmental Transferences = PTI
SIOPS
Percentage of the expenditure on personnel based on the total health care expenditure.
Personnel and Social Contributions (-) Pensions ( - ) Government Social Payouts (-)Family Salaries (-) Wages and Fixed Advantages (Military Personnel)(-)+ Other Variables Costs (Military Personnel)+ Judicial Verdicts + Past Financial Year´s Expenditure (-) Judicial Verdicts (-) Past Annual Expenditure
CURRENT EXPENDITURE ON HEALTH + CAPITAL EXPENDITURE ON HEALTH ( - ) PENSIONS( - ) GOVERNMENT SOCIAL PAYOUTS( - )
The percentage % amount of spending from the total amount spent on health.
Expenditure on Personnel in Health = DPS
aúd
e C
ole
tiv
a,
22(6):1759-1769,
2017
following the macro-regions and the popula-tion size in the municipality, we used the Kru-skal-Wallis test. This is a non-parametric test aimed at comparing independent samples and it
is recommended for small samples21.
Results
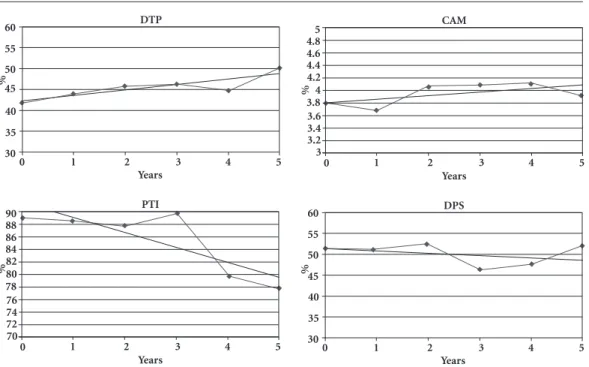
Figure 1 and Table 1 show, respectively, the av-erages of the past series of researched indicators and the analysis of indicator trends.
Observing the DTP of the analyzed munic-ipalities in Brazil, between 2004 to 2009 we saw that for this one, there was an increase from 2008. This aspect is reinforced in Table 1 when growth in the averages of the indicator from 1.3% in the year was observed (p = 0.032). What was also shown was that a major commitment of the tax receipts of the Brazilian municipalities occurred for this type of expenditure during the period.
In spite of the indicator that measures CAM not having shown any significant reduction (p = 0.248), we noted a discrete reduction in the last
Figure 1. The averages for the past series of indicators of Total Expenditure on Personnel, the Capacity of the Municipalities to Raise Tax Revenue, the Proportion of inter-governmental transferences and Expenditure on personnel in health in the municipalities, Brazil 2004 – 2009.
Years
%
DTP 60
55
50
45
40
35
30
0 1 2 3 4 5
Years
%
CAM 5
4.8 4.6 4.4 4.2 4 3.8
0 1 2 3 4 5
3.6 3.4 3.2 3
Years
%
PTI 90
88 86 84 82 80 78
0 1 2 3 4 5
76 74 72 70
Years
%
DPS 60
55
50
45
40
35
30
0 1 2 3 4 5
Table 1. Analysis of the Tendency (linear) of the indicators of Total Expenditure on Personnel, the Capacity of the Municipalities to Raise Tax Revenue, the Proportion of inter-governmental transferences and Expenditure on personnel in health in the municipalities, Brazil 2004 – 2009.
Indicador Model R2 p*** Tendency
a (intercept) b
Total Expenditure on Personnel 41,09 1,26 0,72 0,032 Growth
Capacity of the Municipalities to Raise Tax Revenue (CAM) 3,76 0,05 0,31 0,248 Stable Proportion of inter-governmental transferences (PIT) 93,56 -2,30 0,68 0,045 Decrease
Expenditure on personnel in health (DPS) 51,56 -0,43 0,11 0,528 Stable
Note: Model y = a b t where t (1) = 2004……t(6) = 2009 R² = Determination Coefficient
M
ed
eir
os KR
two years (2008 and 2009) suggesting a decrease in the amount of tax revenue obtained by the municipal administrations (Figure 1).
Also in Figure 1, the indicator measuring the PTI which means the dependency of the munic-ipalities on the transference of resources showed, from 2007, a smaller contribution from this source. This was also an aspect shown in Table 1 that during the period, there was a reduction in the averages of -2.3 in the year (p = 0.045).
In the analysis of the tendency regression for personnel costs in health for the municipal-ities as shown in Figure 1, there was no evidence showing any increase or decrease between 2004 and 2009. Therefore, we did not observe the same elevated tendency for the indicator covering the total costs on personnel.
The application of the correlation test (Table 2) showed an absence of any correlation between the three indicators being: total personnel costs, spending on health personnel and the indicator on municipal autonomy.
This absence of any correlation between the selected indicators during the period from 2004 to 2009 indicated that the municipalities that spent the most on personnel in health, were not always those that got the closest to the spending limit on personnel as set out in the FRA.
The indicator of the total expenditure on per-sonnel and the Kruskal-Wallis test, revealed dif-ferences per regions or population strata in the municipalities meaning the biggest proportions of DTP (p = < 0.1%) was identified and in relation to the population strata, the municipalities with populations above 500,000 inhabitants showed a greater proportion of expenditure (p = < 0.1%).
With reference to the municipal autonomy indicator per region, we identified that the Cen-tral-Western, South-Eastern and Southern re-gions had more autonomy (p = < 0,1%), when contrasted with the Northeast of Brazil. For the expenditure on health staff indicator, no signif-icant differences were shown for both the mac-ro-regions and the population size.
Discussion
Santos et al.10 affirmed that the FRA is currently
the main instrument for management control in relation to public finances. Its creation saw the widening of access demands to information on tax revenues and municipal expenditure and the monitoring and control of spending on
person-nel22.
The evidence of an increase in personnel expenditure by the municipal administrations identified in this study, is in accordance with the
findings of other research9,23-26.
As checked in this study, Nogueira and
Ro-drigues9 noted that in a sample of 3,215
Brazil-ians municipalities, since 2000 there has been evidence of an increase in personnel costs princi-pally in the biggest municipalities.
Zuccolotto et al.23 analyzed five capital groups
according to their wealth, measured by their Gross Domestic Product (GDP). In the period from 1998 to 2006, the research showed that spending on personnel had the highest percent-age participation for total expenditure with an average increase of 20.84% at the detriment of
the other costs22.
Table 2. Correlation between the indicators for Personnel Costs, Personnel Costs in Health and the indicator of the Municipal Autonomy in the Brazilian Municipalities.
Personnel Costs in Health
Personnel Costs
Indicator of Municipal Autonomy
Personnel Costs in Health Correlation 1 0,02 -0,07
- 0,083 0,644
N 4356 4356 4356
Personnel Costs Correlation 0,02 1 0,011
0,883 - 0,457
N 4356 4356 4356
Indicator of Municipal Autonomy Correlation -0,07 0,011 1
0,644 0,457
aúd
e C
ole
tiv
a,
22(6):1759-1769,
2017
Oliveira et al.24, in a study that focused on
mu-nicipalities in the region of Bahia identified that between 1998 and 2008, there was an increase in the net average expenditure on personnel.
Santolin et al.25 and Linhares et al.26 analyzed,
the before and after the law in the municipalities of Minas Gerais and Piauí. They concluded that the effects of the FRA increased spending on per-sonnel.
Supported by the evidence, some of the au-thors warned that if the municipal administra-tions continue doing what they have been do-ing, personnel expenditure will have a tendency to converge to proportions that will commit a greater share of the RCL, which will undoubtedly result in fiscal restrictions and in limits for the
compliance with other public policies9,23.
The analysis of indicator trends that measure the capacity to raise funds and the proportion of inter-governmental transferences make it an op-portune time to provide clarity that the budget-ary revenue is classified in themselves or through coming from the transferences.
The first result of the municipal sources re-flects the capacity of the municipalities in ex-ploiting what they own with a view to raising tax revenue or the expropriation of third party resources through taxation. The source of
trans-ferences can be intra or inter-governmental27. In
Brazil, the budgetary revenues of the
municipali-ties notably come from two sources19.
We identified that during the period that was studied, the Brazilian municipalities did not show any improvements in the use of taxes which offers the potential for an increase of the CAM. This is similar to the observations of Carneiro
and Brasil28. These authors highlighted that
de-spite the 1988 Constitution having widened the competencies and the necessity for the expan-sion of municipalities raising of tax revenue, it was not able to promote the materialization of these measures nor was it able to substantially bolster the municipalities’ finances. This can be explained by the fact that the Constitution, even attributing the power of imposing taxes to the municipalities, did not make the measure
man-datory29.
For Santos30, it is important to highlight that
despite the municipality being a federative enti-ty, this hard-won autonomy has been limited by constitutional reforms that affect the capacity of governments in the development of public pol-icies. Up until 2011, meaning after 23 years of the Constitution having been in force, there have been 67 constitutional amendments and of these
26 affected positively or negatively, the autono-my of the municipalities. From 1995 to 2002, 14 amendments were approved and between 2003
to 2010, 12 were approved30.
The importance and dependency of the mu-nicipalities on the transference of resources has been notable which permits the affirmation that such resources continue to be the “spinal col-umn” of the municipalities public finances. This result is comparable with the research conducted
in 200031, 200729, 200925, making it an opportune
moment to reflect on the division criteria for the resources amongst the spheres.
After the 1988 Constitution, in the process of decentralization there was a form of decen-tralization of resources. This had negative effects as the dependency of the municipalities on the sources from the Union and the State can pro-duce “complacency” from the administrations thus reinforcing the low use of raised resources. In small municipalities, the main revenue comes
from transferences from States or the Union25.
Lima32 comments that due to the absence
of designated fiscal criteria, the current system of the sharing of revenue of the Union towards sub-national entities, has the effect of creating a shortage of stimulus for those that raise the most amount of funds or that show better
perfor-mance in relation to their finance departments32.
However, in spite of being an important source of resources for the municipalities, a con-siderable part of these transferences is considered as sectoral redistribution and because of this, they are restricted to specific functions. This does not have a direct affect on the general capacity of
government spending that receive them33.
Thus, the fact that resources are connected to the programs that require their being applied in specific functions, this fact reinforces even more this dependence since such connection surpasses the municipal autonomy in relation to its
spend-ing27. In the case of health, for being generally
resources whose destination has been pre-de-termined or called “stamped”, such sources end up forcing the municipalities to adopt a vertical policy whose characteristics meet the needs of agreements and programs which reflect the local
epidemiological reality34.
For Giroldo and Kempfer35, in spite of the
M
ed
eir
os KR
circumstances the administrative and politically autonomous entities, in the face of an absence of financial autonomy in the municipalities,
be-come compromised35.
Having the knowledge that the total expendi-ture calculation on personnel has a RCL denomi-nator (Chart 1) and that this is influenced by the capacity to raise tax revenues, the assumption is that the increase in the total expenditure averages on personnel, may be directly related to the small change in the raising of funds by the municipali-ties in the period from 2004 to 2009. This relates to the contracting of personnel occurring with-out any proportional increase in the financial au-tonomy of the municipalities.
Under these conditions, the municipal ad-ministrations will have limits for maintaining or widening their public policies in view of the fact that spending on personnel will not be accompa-nied by further tax revenue. In this way, they will be more susceptible to imposition of penalties under the FRA. It is relevant to remember that spending on personnel has a tendency to be con-stant and to grow. This aspect has become prob-lematic in the face of the revenue trajectory that is vulnerable at conjunctions or cycles of eco-nomic crises. During these periods the amount of tax revenue that is their own or which comes from other transferences, falls, which makes the keeping to a rigid expenditure in relation to per-sonnel, problematic and this makes it difficult to
comply with the FRA36. However, the findings of
this research are still only partial which suggests that new studies are required on this theme.
With reference to the behavior of the mu-nicipalities with their spending on personnel in health, it is appropriate to emphasize that in the last years, due to the intensive use of personnel in health services, we noted an important increase in the proportion of workers linked to the mu-nicipalities and they have become the main
pub-lic sector workers8,36-38. Despite the relevancy of
such considerations, this study did not identify any growth tendencies in the annual averages of the indicators for expenditure on personnel in health between 2004 to 2009.
The urgency of the debate on the implica-tions of the FRA on the hiring of health care workers noted in the Conasems publications, was
investigated by Medeiros and Albuquerque12. The
authors showed that since the 2000 Conasems congress, these issues have been debated and they deserve attention from the relevant stakeholders. However, it was from 2005 that the FRA switched to being connected to the hiring of health care
staff as a limiting inducer and as an obstacle to
the development of SUS12.
The absence of a correlation between the studied indicators contradicts and puts into check the argument contained in the publica-tions of the health care managers which attri-bute the governing crisis in the health sector to the spending limits on personnel as set out in the
FRA14.
Considering the frequency of the issue on the Conasems agenda and the importance of the findings of this research, some considerations on the total expenditure indicators covering person-nel and spending on health care personperson-nel have become necessary.
Dias39 warns that in spite of the FRA being
careful in exhaustively defining personnel costs and the way how they should be calculated, we observed that the sub-national spheres used methods to adhere to the expenditure limits and
to avoid, the application of fiscal penalties39.
In the experience of the municipalities,
Car-valho40 highlights some ways out that have been
used such as: calculating the spending for the ad-ministration as a whole and not just for health, legitimately outsourcing half of the activities done by personnel, reducing positions and re-organizing the remaining roles and outsourc-ing possible activities for legal persons such as building works, cleaning and security. Another important aspect is the exclusion of precarious contract in calculating the personnel costs in the municipalities.
The use of different methods of registering personnel costs by municipal administrations with the view of lessening the risks of penalties set out in the FRA, may affect the fiscal indicator meaning the use of the “different other methods” which may omit the real conditions and thus re-flect the fragility in the quality of the indicators. However, the confirmation or refuting of this argument suggests the need to develop investi-gations that are objective and increase the trust-worthiness and validity of the Finbra indicators or exploring them through other perspectives.
For Ernandez et al.41
, the availability of
Bra-aúd
e C
ole
tiv
a,
22(6):1759-1769,
2017
zilian national databases suggests innumerable possibilities to be investigated.
With reference to the Sipos indicator, Lima
et al.42 affirm that trustworthy information is
being used. However, Gonçalves et al.43 identified
problems relating to the uniformity between the register of the Siops data and the Financial Audit-ing Court for the State of Pernambuco. Based on these, the authors reinforce the need for studies that investigate the trustworthiness of the
sys-tem29,31.
As noted, there are different position on the trustworthy nature of the Siops data which de-pends on the indicator type and the base to be used for comparability. The evidence and the absence of studies that explore the indicators for the expenditure on health care personnel, makes it fundamental that research be carried out that investigates the trustworthiness and validity of the indicators. But these considerations do not invalidate the recognition that Siops and Fin-bra are important sources for registering the
ac-counts of sub-national entities17.
The findings identified with the application of the Kruskal-Wallis test are comparable to the
Giuberti6 study that showed that between 2002
and 2003 the largest amount of expenditure on personnel in the southeastern region. However, with reference to the population strata analysis, the results of this paper go up against that which the author cited and noted between 1997 and 2003 being a reduction in the spending propor-tion on personnel in the municipalities with a population that had less than 50,000 inhabitants.
In a similar vein, for the findings of this study, the importance of personnel expenditure in large municipalities was also observed between 1998 to
2006 by Macedo and Cobari7. This had the effect
on the aspects revealed here concerning
munici-pal autonomy which backs up past studies6,19,31.
Conclusions
We concluded that in the tendency analysis there was a rise in the expenditure on personnel of 1.3% in the year as well as a discrete reduction in the standard of dependency for the municipali-ties on the transference of resources. The raising of tax revenue profiles observed in the munici-palities in the period, suggests that if the same conditions are kept in the municipalities in the coming years, the margins of vulnerability to the fiscal penalties will be widened.
Both the trend analysis on spending on health personnel and the correlation tests, reveal the lack of agreement in the discussions that are still present in the health municipal secretaries that connect the governing crisis in the sector to the FRA.
Although the limits are presented, Finbra is the main and primary source of data on public
finances in the Brazilian municipalities44.
Me-deiros45 investigated the quality of Finbra with
reference to accessibility, opportunity and cover-age and concluded that the system has been well evaluated in the first two areas. However, the au-thor spotlighted that there are restrictions with reference to the coverage. This is because in the treatment of data declared by the municipalities, we checked compliance to the legal requirements and when there were incoherent registers of the data for the past periods, this produced a list of municipalities “known” as inconsistent. In oth-er words, thoth-ere are no means of accessing their data in the year, reducing the coverage of the
sys-tem. Orair et al.44 also identified the variability
of Finbra’s coverage. However, these aspects did not make compliance with the objectives of this study impossible, which defends the importance of Finbra in the study on public finances on
mu-nicipalities45.
Also, due to the lack of studies that analyze both the Finbra and Siops systems and the ur-gent need for responses to questions based on the FRA, new studies that explore the dimensions of trustworthiness and validity of these indicators in the above systems, have become necessary.
Collaborations
M
ed
eir
os KR
References
1. Menezes RT. Efeitos da LRF sobre as categorias e fun-ções de despesas dosmunicípios brasileiros (1998 a 2004)
[dissertação]. São Paulo: Universidade de São Paulo; 2006.
2. Santos SRT, Alves TW. O impacto da lei de responsabi-lidade fiscal no desempenho financeiro e na execução orçamentária dos municípios do Rio Grande do Sul de 1997 a 2004. Rev Adm Publ 2011; 45(1):181-208. 3. Loureiro MR, Abrúcio FL. Política e reforma fiscal no
Brasil recente. Rev EconPol 2004; 24(1):50-71. 4. Afonso JR. Federalismo fiscal: receita municipal: a
im-portância das transferências do FPM e do SUS.
Infor-me-se [Internet] 2001; 28:1-8. [acessado 2012 jan 15].
Disponível em: http://www.bndes.gov.br/SiteBNDES/ export/sites/default/bndes_pt/Galerias/ Arquivos/co-nhecimento/informesf/inf_28.pdf
5. Figueiredo CM, Nóbrega MAR. A LRF: a experiência
brasileira, o caso doTribunal de Contas do Estado de
Pernambuco, 2001. [acessado 2006 ago 23]. Disponível
em: www.federativo.bndes.gov.br/lrf_opinioes_estu-dos.htm
6. Giuberti AC. Efeitos da lei de responsabilidade fiscal so-bre os gastos dosmunicípios brasileiros [dissertação]. São Paulo: Universidade de São Paulo; 2005.
7. Macedo JJ, Corbari EC. Efeitos da lei de responsabilida-de fiscal no endividamento dos municípios brasileiros: uma análise de dados em painéis. Rev Contab Finanç
2009; 20(51):44-60.
8. Braga DG, Amorim JCM, Teixeira M. Responsabilida-de fiscal e conflitos Responsabilida-de trabalho. In: Braga DG, Amo-rim JCM, Santos L, Teixeira M. organizadores. Curso
de negociação do trabalhono SUS. Rio de Janeiro: EAD,
ENSP; 2008. p. 114-118. (Cadernos de Textos). 9. Nogueira RP, Rodrigues VA. Despesa com pessoal e lei
de responsabilidade fiscal: uma análise da situação na União, nas Unidades Federadas e nos Municípios. In: Duarte BC. Tendências na evolução do emprego e nas
relaçõesde trabalho em saúde: a dimensão econômica
na gestão de recursos humanos no Brasil. Brasília: UnB;
2010. p. 71-108.
10. Santos PSA, Dani AC, Rausch RB. Finanças públicas e Lei de Responsabilidade Fiscal: reflexos na produção científica nos principais congressos brasileiros de ad-ministração e contabilidade no período de 2000 a 2010. Rev Infor Contábil 2012; 6(3):74-94.
11. Scherer MDA, Pires D, Schwartz Y. Trabalho coletivo: um desafio para a gestão em saúde. Rev Saude Publica
2009; 43(4):721-725.
12. Medeiros KR, Albuquerque PC. A precarização dos vínculos trabalhistas no setor saúde brasileiro: um balanço do período de 2004 a 2012. In: Martins MIC, Marques AP, Costa NR, Matos A, organizadores.
Tra-balho em saúde, desigualdades e políticas públicas. Rio
de Janeiro, Braga: Centro de Investigação em Ciências Sociais (CICS-UM), Escola Nacional de Saúde; 2014. v. 1, p. 65-67.
13. Medeiros KR, Tavares RAW. Questões contemporâne-as da gestão do trabalho em saúde: em foco a Lei de Responsabilidade Fiscal. Divulg Saúde Debate 2012; (47):563-571.
14. Silva EVMO, Silva SF. Desafio da gestão municipal em relação á contratação da força de trabalho em saúde.
Divulg Saúde Debate 2007; (40):7-12.
15. Brasil. Ministério da Saúde (MS). Secretaria de Ciência, Tecnologia e Insumos Estratégicos. Agenda nacional de
prioridades de pesquisa em saúde. 2ª ed. Brasília: MS;
2008.
16. Almeida Filho N, Barreto ML. Desenhos de pesquisa em epidemiologia. In: Almeida Filho N, Barreto ML.
Epidemiologia & saúde: fundamentos, métodos, aplica-ções. Rio de Janeiro: Guanabara Koogan; 2011. p. 165-174.
17. Medeiros KR, Albuquerque PC, Diniz GTN, Alencar FL, Tavares RAW. Bases de dados orçamentários e qua-lidade da informação: uma avaliação do Finanças do Brasil (Finbra) e do Sistema de Informações sobre Or-çamentos Públicos em Saúde (Siops). Rev Adm. Públ
2014; 48(5):113-133.
18. Faveret ACSC. Prontuários de bases de dados: informa-ção sistematizada para ascontas de saúde do Brasil. Bra-sília: Ipea; 2009.
19. Pinheiro TC. Hierarquia urbana e situação fiscal dos municípios brasileiros. RevAss Bras Estud Reg Urb
2009; 3(1):107-127.
20. Vieira S. Introdução à bioestatística. 5ª ed. Rio de Janei-ro: Campus; 1991.
21. Hollander M, Wolfe DA. Nonparametric statistical methods. 2ª ed. New York: John Wiley & Sons; 1999. 22. Beuren IM, Zonato VCS. Perfil dos artigos sobre
con-trole interno no setor público em periódicos nacionais e internacionais. Rev Adm Públ 2014; 48(5):1135-1163. 23. Zuccolotto R, Ribeiro CPP, Abrantes LA. O compor-tamento das finanças públicas municipais nas capi-tais dos estados brasileiros. Enfoque (Maringá) 2009; 28(1):54-60.
24. Oliveira NR, Bruni AL, Dias Filho JM. O comportamen-to dos gascomportamen-tos públicos na era da responsabilidade fiscal: um estudo a luz da teoria institucional [Internet]. Sal-vador: UFBA; 2010. [acessado 2005 jun 21]. Disponível em: http://www.contabeis.ufba.br/Site/arquivos/Edi-tor/file/Mestrado/Artigos/2010/cbc2010%5B1%5D_ artigo_0182_.pdf
25. Santolin R, Jaime Júnior FG, Reis JC. Lei de Respon-sabilidade Fiscal e implicações das despesas de pesso-al e de investimentos nos municípios mineiros: um estudo com dados de painel dinâmico. Est Econ 2009; 39(4):895-923.
aúd
e C
ole
tiv
a,
22(6):1759-1769,
2017
27. Braga JP, Cruz CF, Mendes EL. Análise empírica da
autonomia financeira e daalocação de recursos de um
município da Região Nordeste do Brasil [Internet]. São
Paulo: USP; 2009. [acessado 2010 mar 15]. Disponí-vel em: http://www.congressousp.fipecafi.org/arti-gos92009/378.pdf
28. Carneiro R, Brasil PDF. Descentralização e financia-mento dos municípios no Brasil contemporâneo. Rev Adm 2010; 9(2):87-104.
29. Ferreira IFS, Bugarim MS. Transferências voluntárias e ciclo político orçamentário no federalismo fiscal brasi-leiro. Rev Bras Econ 2007; 61(3):271-300.
30. Santos AP. Autonomia municipal no contexto Federati-vo brasileiro. Rev ParanDes 2011; 120(1):209-230. 31. Tristão JAM. A administração tributária dos municípios
brasileiros: umaavaliação do desempenho da
arrecada-ção [tese]. São Paulo: Fundação Getúlio Vargas; 2003. 32. Lima LD. Conexões entre o federalismo fiscal e o
fi-nanciamento da política de saúde no Brasil. Cien Saude
Colet 2007; 12(2):511-522.
33. Lima LD. Federalismo fiscal e financiamento descen-tralizado do SUS: balanço de uma década expandida.
Trab Educ Saúde 2009; 6(3):573-597.
34. Silva KSB, Bezerra AFB, Sousa IMC, Goncalves RF. Conhecimento e uso do Sistema de Informações sobre Orçamentos Públicos em Saúde (SIOPS) pelos gestores municipais de Pernambuco, Brasil. Cad Saude Publica
2010; 26(2):373-382.
35. Giroldo CN, Kempfer M. Autonomia municipal e o federalismo fiscal brasileiro. Rev Dir Públ 2012; 7(3):3-20.
36. Gadelha SRB. Análise dos impactos da Lei de Respon-sabilidade Fiscal sobre a despesa de pessoal e a receita tributária nos municípios brasileiros: um estudo com modelo probit aplicado a dados em painel. Rev Bras
Econ Emp 2011; 11(1):65-77.
37. Moysés NMN, Machado MH. Políticas de gestão do trabalho no SUS: o desafio sempre presente. Divulg
Saúde Debate 2010; (45):33-41.
38. Junqueira TS, Cotta RMM, Gomes RC, Silveira SFR, Siqueira-Batista R, Pinheiro TMM. As relações labo-rais no âmbito da municipalização de gastos em saú-de e os dilemas da relação expansão/precarização do trabalho no contexto do SUS. Cad Saude Publica 2010; 26(5):918-928.
39. Dias FAC. O controle institucional das despesas com
pessoal. Brasília: Centro de Estudos da Consultoria do
Senado Federal; 2009.
40. Carvalho G. LRF: e o limite de gastos com pessoal da saú-de [Internet]. São Paulo: Idisa; 2011. [acessado 2015 fev 12]. Disponível em: http://www.idisa.org.br/site/do-cumento_5191_0__2011---27---569-- domingueira---lrf-e-limites-de-gastos-com-pessoal-saude.htmlhttp/ www.idisa.org.br
41. Ernandez P, Tan-Torres T, Evans DB. Quantificação das despesas com o pessoal de saúde: conceitos, fontes de dados e métodos. In: Dal Poz MR, Gupta N, Quain E, Soucat ALB. Manual para a monitorização e avaliação de recursos humanos de saúde com aplicação dedicada
aos países de rendimento baixo emédio. Geneva:
Orga-nização Mundial de Saúde; 2014. p. 73-90.
42. Lima CRA, Carvalho MS, Schramm JMA. Financia-mento público em saúde e confiabilidade dos bancos de dados nacionais: um estudo dos anos de 2001 e 2002. Cad Saude Publica 2006; 22(9):1855-1864. 43. Gonçalves RF, Bezerra AFB, Espírito Santo ACG, Sousa
IMC, Duarte-Neto PJ, Silva KSB. Confiabilidade dos dados relativos ao cumprimento da Emenda Consti-tucional nº 29 declarados ao Sistema de Informações sobre Orçamentos Públicos em Saúde pelos municí-pios de Pernambuco, Brasil. Cad Saude Publica 2009; 25(12):2612-2620.
44. Orair RO, Santos CHM, Silva WJ, Brito JMM, Silva HL, Rocha WS, Ferreira AS. Uma metodologia de Constru-ção de séries de alta frequência das finanças municipais
no Brasil com aplicação para o IPTU e o ISS: 2004-2010.
Rio de Janeiro: IPEA; 2011. Texto para Discussão. 45. Medeiros KR. Lei de Responsabilidade Fiscal e despesas
com pessoal da saúde: um estudo dos municípios
brasi-leiros [tese]. Recife: Centro de Pesquisas Aggeu
Maga-lhães; 2011.
Article submitted 15/09/2016 Approved 23/11/2016