ISSN 0104-6632 Printed in Brazil
www.abeq.org.br/bjche
Vol. 30, No. 04, pp. 781 - 791, October - December, 2013
Brazilian Journal
of Chemical
Engineering
AN INVESTIGATION OF THE BEHAVIOR OF A
CLASSIFYING HYDROCYCLONE WITH
PSEUDOPLASTIC FLUIDS
C. M. Scheid
*, L. A. Calçada, R. S. A. Gonçalves and G. Massarani
gDEQ/IT/Federal Rural University of Rio de Janeiro, BR 465, km 7, CEP: 23890-000, Seropédica, RJ - Brazil.
E-mail: [email protected]
(Submitted: May 2, 2012 ; Revised: October 29, 2012 ; Accepted: November 5, 2012)
Abstract - The procedure usually employed for specifying a set of hydrocyclones used in Newtonian fluid-solid separation processes can be extended to the case of non-Newtonian fluids. The apparent viscosity, μapp,
is the link between the two cases, and can be evaluated from the knowledge of the shear stress function, S, and the characteristic rate of shear, λ*. In order to verify the validity of this, experiments using suspensions of different solids in an aqueous solution of carboxymethylcellulose (CMC), with pseudoplastic behavior, in an AKW commercial hydrocyclone have been performed. The results obtained in this work indicated that the separation process and the pressure drop in the hydrocyclone cannot be characterized by a single apparent viscosity associated parameter.
Keywords:Solid-fluid separation; Hydrocyclone; Non-Newtonian fluid.
INTRODUCTION
Several studies have been carried out in order to improve the analysis and design of the performance of hydrocyclones. Most of these have focused on the study of the equipment operation using Newtonian fluids. The classical formulation developed along several years establishes that the equipment per-formance depends upon its dimensions, the relative proportions among them (hydrocyclone configura-tion), the physical properties of the particle system (e.g., solid and fluid densities, fluid viscosity, and particle size distribution), and the operational conditions (e.g., fluid flow rate and feed solids concentration). Following the classical approach, the evaluation and characterization of hydrocyclones is generally performed by the separation cut diameter, the total and grade efficiencies, and the relation between flow rate and pressure drop (Bradley, 1965, and Svarovsky, 1981 and 1984).
The cut diameter represents the diameter of the particle that has a 50% probability of ending up in either the coarse or the fine product, and may be evaluated by the following equation, as proposed by Svarovsky (1981):
f v
1/2 c
f v
c s
f R 0
v
C 0
D * D
K f (R ) g(C )
D Q( )
lim f (R ) 1
lim g(C ) 1
→
→
⎡ μ ⎤
= ⎢ ⎥
ρ − ρ
⎣ ⎦
=
=
, (1)
where K is a constant which takes into account the
equipment geometry, Dc is the diameter of the
cylindrical part of the cyclone, Cv is the volumetric
concentration of solids in the feed, and Rf is the
as the ratio of the underflow to the feed flow volu-metric rates.
The function f(Rf) is related to the correction of
the stream splitting effect, in such a way that the value of D* obtained for the centrifugal separation is greater than the value of D* obtained considering the whole separation. This may be explained by the fact that the hydrocyclone efficiency is related to two phenomena: one being the centrifugal separation efficiency and other being the effect of dividing the main flow of the suspension in two (overflow and underflow), creating an inherent efficiency of the equipment, which has nothing to do with the field caused by centrifugal flow. Regarding the effect of the solids concentration in the feed, the correction is
performed by the function g(Cv). This is explained
by the fact that, in hydrocyclones as well as in other separation devices, the increase in the solids concen-tration results in a increase of the cut diameter and, therefore, a decrease in the total efficiency (Svarovsky, 1990).
The grade efficiency represents the efficiency with which each size of particle is separated, and it is evaluated based on the feed and underflow particle size distribution and the global efficiency. It is given by:
u X D
dX G(D)
dX =
= η , (2)
where η is the total efficiency, D is the particle
diameter, and X and Xu represent the weight fraction
of particles smaller then a given diameter for the feed and underflow, respectively. In order to analyze the efficiency of the centrifugal field alone, the reduced grade efficiency may be evaluated from:
' f
f
G(D) R
G (D)
1 R
− =
− , (3)
which takes into account the separation due to the centrifugal field alone.
In the study of hydrocyclone performance it is customary to work with reduced grade efficiency as a function of D / D *. This is because the efficiency curve obtained in this case is constant for geometrically similar cyclones. The efficiency curve is not a function of system operating conditions (Svarovsky, 1981) nor of the size distribution of solid particles in the hydrocyclone feed (Lynch and Rao, 1975). The literature also offers several empirical equations for G' as a function of D / D * (Bradley, 1965; Plitt, 1971; Lynch and Rao, 1968; Lynch et al., 1974; Rao et al., 1976).
The total efficiency is related to G (D) and ' R f
through the following equation:
1
f f
0
(1 R ) G '(D)dX R
η = −
∫
+ . (4)Finally, according to Svarovsky (1984), in order to complete the characterization of the hydrocyclone it is necessary to establish the relation between the flow rate and pressure drop, which is given by:
2 c
2 P u
Δ ψ =
ρ , (5)
where u is the fluid velocity in the cylindrical section c of the hydrocyclone.
Equations (1) to (5) establish the formulation developed for hydrocyclones when operating with Newtonian fluid-solid suspensions. The published literature on the operation of hydrocyclones using non-Newtonian fluids can be divided into two groups. The first group focuses on the experimental observa-tion of the separaobserva-tion phenomena that take place inside the equipment, presenting empirical equations for evaluation of its performance (Lynch and Rao,
1975; Plitt, 1971; Linch and Rao, 1968; Lynch et al.,
1974; Rao et al., 1976; Lilge, 1961, 1962;
Napier-Munn, 1980; Upadrashta and Venkateswarlu, 1983;
Walker et al., 1992; Horsley et al., 1992; Yoshida
et al., 2004). The second group focuses on the mathematical modeling of the fluid flow in the body of the hydrocyclone and also in the fluid boundary layer adjacent to the equipment internal walls. As a result of this approach, fluid velocity profiles are obtained by solving the momentum and continuity equations. These velocity profiles are used in the determination of the particle trajectory and, conse-quently, the collection efficiency of the equipment
(Upadrashta et al., 1987; Barrientos and Concha, 1992;
Dyakowski et al., 1994; Yablonskii, 2000; Tavares
et al., 2002; Yablonskii, 2004; Yablonskii, 2005;
Yablonskii and Ryabchuk, 2005; Brenan et.al., 2007;
Davailles et. al., 2012).
The present contribution aims at validating the classical formulation for operation of hydrocyclones using Newtonian fluids and to extend its applica-bility to the operation using non-Newtonian fluids. The strategy consists of replacing the fluid viscosity by an apparent viscosity, which can be calculated from the shear stress function S (which is a material property of the fluid), and the characteristic rate of
shear λ* (which is a kinematic property of the flow).
An Investigation of the Behavior of a Classifying Hydrocyclone with Pseudoplastic Fluids 783 *
app *
S(λ )
μ =
λ . (6)
Attempts to establish the expression of the flow characteristic rate of shear for this system, as well as for others, use mostly dimensional analysis combined with results from experiments with non-Newtonian fluids. We mention, for instance, the work developed by Massarani and Silva Telles (1978) and Laruccia (1990), on the study of non-Newtonian fluid flow in the surroundings of solid particles, which resulted in the following expression for λ*:
*
p
( , ) d
−
λ = θ φ β u v , (7)
where θ φ β( , ) is a function of the particle sphericity and the ratio of the particle to the tube diameter, u is the fluid velocity and v is the solid particle velocity,
−
u v is the relative fluid-particle flow velocity, and
dp is the diameter of a sphere with the same volume
as the particle.
For the case of separation in hydrocyclones, the establishment of the general form of the characteristic shear rate equation is based on Equation (7) for the particle with the cut diameter, i.e.,
t
v
* f ( )
D *
λ = φ , (8)
where vt is the terminal velocity in the centrifugal
field of a particle with the cut diameter D*. In Stokes’ flow, the terminal velocity of a particle of
diameter D* and sphericity φ under a centrifugal
field is given by:
2 2
s 1
t
( ) D * K r
v
18
ρ − ρ ⋅ ω
=
μ , (9)
where K1 is a shape factor which takes into account
the particle sphericity (Pettyjohn and Christiansen, 1948),
1 10
K 0.842 log
0.065
φ
⎛ ⎞
= ⎜ ⎟
⎝ ⎠, (10)
where the sphericity, φ, is defined as
Surface area of the sphere with the same particle volume
1 Superficial area of the particle
φ = ≤ (11)
and r is the particle radial position in the hydro-cyclone. In the present work, particles are considered to flow very close to the equipment wall (i.e.,
c
r=R ). The angular velocity ω can be expressed by:
e a
2 N Q V
π
ω = , (12)
where the parameters N , e V and also a R depend c
on the hydrocyclone geometry. The cut diameter D* is calculated as suggested by Svarovsky (1981) from the following equation:
1/2 c
f v
c s
D * D
K f (R )g(C )
D Q( )
⎡ μ ⎤
= ⎢ ⎥
ρ − ρ
⎣ ⎦ . (13)
Inserting Equations (10) and (12) into Equation (9), and the resulting equation into Equation (8), and
also noting that Q= πuc D / 42c , the following
expression for λ* is obtained:
2 5
2
c e c
1 c
a
D 2 N u
* f ( ) K R K
72 V D *
⎛ ⎞
π π
λ = φ ⎜ ⎟
⎝ ⎠ , (14)
or
c
u
* ( , geometry)
D *
λ = β φ . (15)
Equation (15) provides the form of the shear rate that characterizes globally the separation process of the particles in the centrifugal field established in the interior of the hydrocyclone. This equation is a function of the cut diameter, the fluid velocity in the cylindrical section of the equipment, and the
parame-ter β. This parameter, which is actually a function of
the particle sphericity and the cyclone geometry, should be determined experimentally using non-Newtonian fluids. Experiments showed that the
pa-rameter β apparently depends only upon the equipment
configuration.
EXPERIMENTAL
con-ducted using non-Newtonian fluids and the goal was to study the apparent viscosity so as to establish a link between the two situations under consideration
(i.e., Newtonian versus non-Newtonian fluid operation).
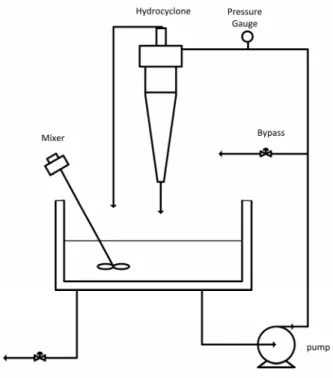
The experimental set-up is presented in Figure 1. The apparatus consisted basically of a tank for the suspension connected to a centrifugal pump, respon-sible for pumping the suspension to the hydrocy-clone. Mechanical stirrers were used in order to maintain the homogeneity of the suspension in the tank. The outlet flow rates of the system were redirected to the suspension tank in order to create a closed loop. A by-pass system was used to control the feed flow rate (see Figure 1). The pressure drop was measured by a pressure gauge installed in the feed tubing.
An AKW hydrocyclone (model KRS-98) was used in the experiments. The hydrocyclone presents a diameter of the cylindrical section of 4.5 cm and diameter of the underflow section of 1.4 cm (see Figure 2). The equipment was built of polyurethane.
Figure 1: Experimental set-up.
In order to quantify the hydrocyclone perform-ance in each experiment, the following variables were measured: temperature of the suspension, feed static pressure, feed solids concentration, underflow, overflow, feed and underflow particle size distribu-tion, and the fluid rheograms in the non-Newtonian fluid experiments. The concentration and flow rates were determined by using gravimetric analysis.
Figure 2: Dimensions of the AKW model KRS-98 hydrocyclone.
In the first part of this work, experiments using water and dolomite, hematite and alumina particles,
with densities of 2,800, 4,800 and 3,300 kg/m3,
An Investigation of the Behavior of a Classifying Hydrocyclone with Pseudoplastic Fluids 785
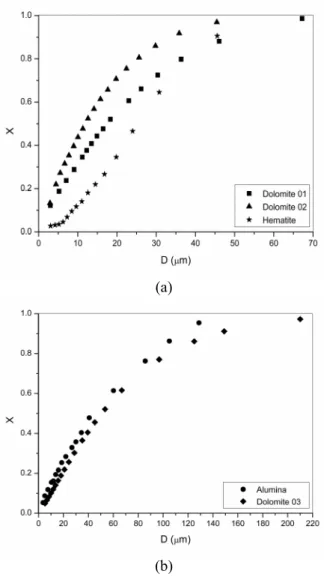
and then discarded. As solid particles we used dolomite and alumina. The particle-size distributions are shown in Figure 3.
(a)
(b)
Figure 3: (a) Particle size distribution range 1. (b) Particle size distribution range 2.
The particle size distribution of the solids in the flow streams was obtained from aqueous suspension tests in a modified Andreasen pipette. It was observed that all the experimental particle size distribution curves were well fitted by the Rosin-Rammler-Bennet (RRB) model, given by the follow-ing equation:
m
D
X 1 exp
D '
⎡ ⎛ ⎞ ⎤ = − ⎢−⎜ ⎟ ⎥
⎝ ⎠
⎢ ⎥
⎣ ⎦
, (16)
where X is the weight fraction of particles whose diameter is smaller than D. D ' and m are the model
parameters representing, respectively, the particle diameter corresponding to X=0.632 and the dispersion.
The non-Newtonian fluid rheology was deter-mined by a capillary viscometer. The rheology measurement was performed at the operation tem-perature of the hydrocyclone. The capillary viscometer consisted of a peristaltic pump that maintained a constant volumetric flow in a tube of known
diame-ter (diamediame-ter 2.39x10⁻³ m and length 1.268 m). The
non-Newtonian fluid flow laminar regime inside this tube, where the pressure drop (gauges) and mass flow (scale’s accuracy was 0.0001 g), were measured. With the volumetric flow and pressure drop data, we calculated the shear stress and shear rate by classical literature equations for fluid flow in pipelines. Table 1 shows the results obtained for the rheology of the non-Newtonian fluids used in this work. The shear stress and shear rate data given in Table 1 were
fit according to the power-law model (S=Mλn),
be-having as a pseudoplastic fluid and representing the aqueous solution of CMC without solid particles. The parameter M presents an average deviation of
0.0004 kg/ms2-n and n of 0.006. The symbol A was
used to identify the experiments performed with alumina and the symbol D with dolomite. The temperatures of the experiments ranged from 25 to 35 °C.
Table 1: Rheological properties of the non-Newtonian fluids used in this work.
Exp. μapp = Mλn-1
(Ns/m2)
a <λ<b (s-1)
ρ (kg/m3) A1 0.0067λ-0.091 6 <λ< 580 1010 A2 0.0065λ-0.090 6 <λ< 600 1010 A3 0.0061λ-0.085 6 <λ< 630 1010 A4 0.0046λ-0.069 4 <λ< 750 1020
A5 0.0044λ-0.067 3 <λ< 790 1020 A6 0.0042λ-0.067 4 <λ< 840 1020 D1 0.0042λ-0.058 4 <λ< 620 1010
D2 0.0040λ-0.058 5 <λ< 660 1010 D3 0.0037λ-0.057 5 <λ< 700 1010 D4 0.0033λ-0.038 5 <λ< 700 1010
D5 0.0029λ-0.028 6 <λ< 750 1010 D6 0.0028λ-0.032 7 <λ< 800 1010 D7 0.0140λ-0.217 540 <λ< 6200 1020
D8 0.0103λ-0.185 520 <λ< 6400 1020
D9 0.0131λ-0.217 570 <λ< 6600 1020 D10 0.0147λ-0.187 50 <λ< 470 1020 D11 0.0139λ-0.193 50 <λ< 520 1020
D12 0.0116λ-0.177 60 <λ< 560 1020
pseudo-plastic behavior. The following operational variable ranges were imposed on the hydrocyclone:
Pressure drop: 103 - 276 KPa;
Suspension temperature: 25- 35°C;
Feed volumetric solid concentration: 0.5 - 2.0%;
Feed volumetric flow rate: 5 - 11m3/h;
Underflow-to throughput (R ): 0.17 - 0.24. f
RESULTS AND DISCUSSION
Reduced Grade Efficiency
For each experiment, the reduced grade efficiency was calculated by Equation (2) and from the results of the grade analyses of the feed and underflow and total efficiency. In order to study the centrifugal separation alone, the particle reduced grade effi-ciency was calculated from Equation (3), and then the experimental cut diameter that corresponds to the
diameter for G = 50%. '
The experimental results of the reduced grade efficiency and cut diameter for both Newtonian and non-Newtonian fluid experiments are shown in Figure 4.
Figure 4: Reduced grade efficiency in AKW hydrocyclones.
From this figure it is possible to observe that the results obtained for the experiments with water and CMC are very similar to each other, and no clear distinction between the separation curves can be noticed. The dotted line in this figure gives the confidence interval of the fitted curve. Therefore, both Newtonian and non-Newtonian fluid
experi-mental data were used for fitting the curve shown in Figure 4. The dispersion observed in the data is expected and has already been reported in the literature (Svarovsky, 1990). The following expres-sion was obtained for the individual reduced grade efficiency:
0.7
D
G '(D) 0.5 for D/D* 2.7
D *
G '(D) 1.0 for D/D* 2.7
⎛ ⎞
= ⎜ ⎟ ≤
⎝ ⎠
= > (17)
The variances of the parameters 0.5 and 0.7 were on the order of 5%.
Cut Diameter
The results obtained for the cut diameter from the Newtonian fluid experiments were used for estimat-ing the constant K in Equation (1). The correlation of Damasceno, Clark and Massarani (1990) for the volumetric concentration of solids in the feed was adopted in the present work. Their empirical correla-tion was obtained by studying the fluid dynamics of dilute suspensions and is given by:
1/2 2
v v v
g(C )=⎡⎣4.8(1 C )− −3.8(1 C )− ⎤⎦− . (18)
This result seems not to depend upon the nature of the fluid and the particle’s shape.
A correlation to fix the influence of Rf on the cut
diameter, f (R ) , may be obtained from experiments f
by varying the underflow diameter under different operational conditions. Alternatively, it is possible to rearrange Equation (1) as:
1/2 c
f v
c s
D * D
K * (R ) g(C )
D Q( )
⎡ μ ⎤
= ⎢ ⎥
ρ − ρ
⎣ ⎦ , (19)
where K * (R )f =Kf (R )f . Therefore, from the
experimental data of D* using a Newtonian fluid and from the operational conditions of the hydrocyclone,
the following expression for K * (R ) was obtained: f
f f
f
K * (R ) 3.13R 0.48
0.17 R 0
2
( .2 )4 .
=
≤ ≤
−
(20)
Pressure Drop
An Investigation of the Behavior of a Classifying Hydrocyclone with Pseudoplastic Fluids 787 6
2 c
2 P 14.76 10
2.57 Re
u
Δ ×
ψ = = −
ρ , (21)
where 5.5 10 Re× 4〈 =D uc cρ〈 13 10× 4
μ .
where µ is the viscosity of the Newtonian fluid or the apparent viscosity of the non-Newtonian fluids.
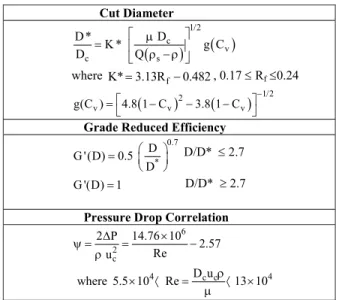
Table 2 summarizes the characterization of the AKW model KRS-98 hydrocyclone. It is worthwhile mentioning that the correlation given by Equation (17) is valid for both Newtonian and non-Newtonian fluid operation.
Table 2: Characterization of the AKW model KRS-98 hydrocyclone.
Cut Diameter
( ) ( )
1/2 c
v
c s
D * D
K * g C
D Q
⎡ μ ⎤
= ⎢ ⎥
ρ − ρ
⎣ ⎦
where K*=3.13Rf−0.482, 0.17 ≤ Rf≤0.24 ( )2 ( ) 1/2
v v v
g(C ) 4.8 1 C 3.8 1 C
−
⎡ ⎤
=⎣ − − − ⎦
Grade Reduced Efficiency
0.7 *
D G ' (D) 0.5
D
⎛ ⎞
= ⎜ ⎟
⎝ ⎠ D/D* ≤ 2.7
G '(D)=1 D/D* ≥ 2.7
Pressure Drop Correlation
6 2
c
2 P 14.76 10
2.57 Re
u
Δ ×
ψ = = −
ρ
4 D uc c 4
5.5 10 where × 〈 Re= ρ〈13 10×
μ
Apparent Viscosity – Centrifugal Separation
This section aims to extend the use of the equations developed for Newtonian fluids for the case of operation with non-Newtonian fluids. As mentioned previously, this may be performed by
defining an apparent viscosity, μapp, which is
intended to replace the fluid viscosity in the classical hydrocyclone modeling. It is necessary, however, to
establish the correlation for λ* (Equation (15)),
which relies directly on the particle sphericity and hydrocyclone geometry.
In the experiments using CMC, the cut diameter was obtained from the reduced grade efficiency results, obtained in the hydrocyclone characterization described in the previous sections. Equations (4) and (17), together with the total efficiency and the feed particle size distribution, given by Equation (16), were used in order to obtain D*. From the
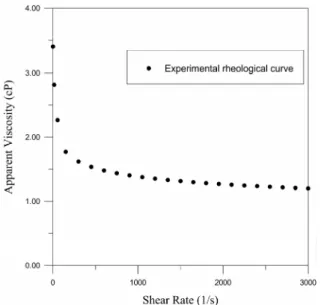
operational conditions and the knowledge of D*, Equation (19) and (20) were used in the calculation of the apparent viscosity given in Table 3. Finally, with the aid of the non-Newtonian fluid data (Table 1), like the typical rheological curve illustrated in Figure 5, the characteristic shear rate was obtained.
(a)
(b)
Figure 5: (a) Typical rheogram for a pseudoplastic non-Newtonian fluid. (b) Graphical determination of the characteristic shear rate.
Table 3 presents the characteristic shear rate results obtained from the non-Newtonian fluid experiments. It is possible to note that the apparent viscosities are larger than the water viscosity, which leads to low deformation rates. This result suggests that the separation takes place in the boundary layer near to the internal wall of the hydrocyclone under low rate of shear and high viscosities, as previously
suggested by Bloor et al. (1993) and Ingram and
shear rate calculated presented results beyond the range of the same variable obtained experimentally.
Table 3: Experimental results for determining β.
Exp. D*
(μm)
μapp (Ns/m2)
λ* (1/s)
Q (m3/h)
uc (m/s)
β
A3 49.30 5.18×10⁻³ 7.38 5.98 1.05 3.48×10⁻⁴ A4 22.52 3.85×10⁻³ 13.30 8.35 1.46 2.06×10⁻⁴ A5 20.81 3.68×10⁻³ 13.24 7.85 1.37 2.01×10⁻⁴ A6 22.48 3.49×10⁻³ 13.49 6.28 1.10 2.76×10⁻⁴
D1 24.75 3.69×10⁻³ 11.16 8.49 1.48 1.86×10⁻⁴ D2 20.08 3.48×10⁻³ 12.23 7.84 1.37 1.79×10⁻⁴
D3 20.40 3.25×10⁻³ 11.60 6.77 1.18 2.00×10⁻⁴ D4 21.24 2.96×10⁻³ 17.49 9.22 1.61 2.31×10⁻⁴
D5 24.20 2.65×10⁻³ 14.22 7.69 1.34 2.56×10⁻⁴ D6 30.30 2.56×10⁻³ 12.84 6.59 1.15 3.38×10⁻⁴
Regarding the non-Newtonian fluid experiments using dolomite and alumina particles, the arithmetic
average value of λ* was determined and is given by:
4 uc
* 2.42 10
D * −
λ = × . (22)
The total efficiency can be predicted by Equation (22) with the knowledge of the operational condi-tions of the experiment, the particle size distribution of the feed flow and the rheological curve of the non-Newtonian fluid.
Table 4 presents the comparison between experi-mental and calculated values of the total efficiency. One can observe a good fit between the experimental and calculated total efficiency with a deviation of less than 10%.
Table 4: Total efficiency: experimental and calculated values.
Exp. η exp η calc ηexp /ηcalc
A3 0.6327 0.6333 0.9991
A4 0.7262 0.7063 1.0281
A5 0.7217 0.7074 1.0202
A6 0.7233 0.7012 1.0316
D1 0.6988 0.6885 1.0150
D2 0.7240 0.7255 0.9979
D3 0.6788 0.7517 0.9030
D4 0.7316 0.7181 1.0188
D5 0.7008 0.6996 1.0017
D6 0.6719 0.6571 1.0226
Apparent Viscosity – Pressure Drop
The experimental pressure drop and fluid flow velocity data in the cylindrical section of the hydro-cyclone were used in order to determine the Reynolds number in the experiments using CMC (see Equation (21)). Then, the apparent viscosity was calculated from the definition of the Reynolds number:
c c app
D u Re
ρ
μ = . (23)
In Table 5 the estimates of μapp calculated from
Equation (23) are presented. The values obtained for the apparent viscosity are very close to the viscosity of water. This suggests that, as far as pressure drop is concerned, the viscosity is lower than that related to the separation process itself. This result has also been reported by Bloor, Ingram and Laverack (1980).
Table 5: Estimation of the apparent viscosity from ψ.
Exp. ψ uc (m/s) Re μapp (Ns/m2) Temp. (°C) μ
water (Ns/m2) μapp/μwater
A1 250.2 1.44 5.83×10⁴ 1.11×10⁻³ 27 0.85×10⁻³ 1.30
A2 212.8 1.33 6.85×10⁴ 0.88×10⁻³ 29 0.81×10⁻³ 1.08
A3 252.3 1.05 5.79×10⁴ 0.81×10⁻³ 31 0.78×10⁻³ 1.04
A4 243.1 1.46 6.01×10⁴ 1.09×10⁻³ 27 0.85×10⁻³ 1.29
A5 201.8 1.37 7.22×10⁴ 0.85×10⁻³ 31 0.78×10⁻³ 1.09
A6 229.3 1.10 6.37×10⁴ 0.78×10⁻³ 34 0.73×10⁻³ 1.06
D1 250.9 1.48 5.82×10⁴ 1.15×10⁻³ 29 0.81×10⁻³ 1.41
D2 220.4 1.37 6.62×10⁴ 0.93×10⁻³ 32 0.76×10⁻³ 1.22
D3 196.9 1.18 7.40×10⁴ 0.72×10⁻³ 35 0.72×10⁻³ 1.00
D4 185.9 1.61 8.07×10⁴ 0.90×10⁻³ 28 0.83×10⁻³ 1.08
D5 210.1 1.34 6.94×10⁴ 0.87×10⁻³ 32 0.76×10⁻³ 1.15
D6 208.4 1.15 6.99×10⁴ 0.74×10⁻³ 34 0.73×10⁻³ 1.01
D7 167.3 1.57 8.69×10⁴ 0.81×10⁻³ 30 0.80×10⁻³ 1.02
D8 158.8 1.47 9.15×10⁴ 0.73×10⁻³ 32 0.76×10⁻³ 0.95
D9 205.6 1.16 7.09×10⁴ 0.74×10⁻³ 34 0.73×10⁻³ 1.01
D10 145.9 1.68 9.94×10⁴ 0.76×10⁻³ 28 0.83×10⁻³ 0.92
D11 168.7 1.43 8.62×10⁴ 0.75×10⁻³ 31 0.80×10⁻³ 0.93
An Investigation of the Behavior of a Classifying Hydrocyclone with Pseudoplastic Fluids 789
In this case, the shear rate applied to the flow is high and leads to low apparent viscosity, which is in accord with pseudoplastic fluid behavior. From these results, it would be possible to determine an expression for the characteristic shear rate related to the pressure drop in the equipment, in analogy to the previous section. However, the apparent viscosities obtained from the Reynolds number calculations lead to very high values of the shear rate when calculated by the rheological equations given in Table 1, which were not determined experimentally.
In order to investigate the apparent viscosity behavior at high shear rate, a sample of an aqueous solution of CMC with the same concentration range and rheological behavior as the one employed in the experimental study of a non-Newtonian fluid was prepared. The fluid rheological curve was obtained at an average temperature of 30 °C. Figure 6 presents the results of this test. A continuous decrease can be observed in the apparent viscosity as the shear rate increases, ultimately approaching the viscosity of water. This result supports the behavior observed in the experimental data presented in Table 5.
Figure 6: Rheologic behavior at high deformation rates.
CONCLUSIONS
Regarding the operational conditions used in this work, an aqueous solution of CMC with a pseudo-plastic behavior (n<1), a low concentration of solid particles and the hydrocyclone model provided the theoretical and experimental results that led to the following conclusions:
The reduced grade efficiency curve as a function
of D/D* is not influenced by the non-Newtonian fluid behavior, and is also quite similar to the grade reduced efficiency curve obtained using a Newtonian fluid (see Figure 4);
The use of the concept of an apparent viscosity in
the separation of solid non-Newtonian fluid mixtures was found to be possible. Considering the rheological behavior of pseudoplastic fluids, it was found that the apparent viscosity determined for the cut diameter in the centrifugal separation is greater than the apparent viscosity determined for the study of the relationship between fluid flow and pressure drop;
Regarding the case of centrifugal separation, the characteristic shear rate may be computed from Equation (22). The separation takes place near the internal walls of the hydrocyclone at low deforma-tion rates and high viscosities. The total efficiency of each experiment can be calculated from the expression
for λ* and from the operational conditions, particle
size distribution, and fluid rheogram.
As far as the pressure drop is concerned, an
ex-pression for λ* could not be derived. The reason for this
lies in the fact that the apparent viscosities deter-mined from the Reynolds number led to high shear rates, which were outside of the rheological measure-ment range. It is worth measure-mentioning that, at a given pressure drop, the apparent viscosity results are con-siderably lower than those determined for the sepa-ration, and slightly greater than the viscosity of water.
ACKNOWLEDGMENTS
We gratefully acknowledge the financial support provided by CNPq and CAPES.
NOMENCLATURE
Cv Volumetric concentration of
solids
-D Particle diameter m
Dc Diameter of the cylindrical
section of the hydrocyclone
m
D’ RRB model parameter m
D* Cut diameter m
G Grade efficiency
-G’ Reduced grade efficiency
-K Hydrocyclone geometry factor
-K1 Shape factor
-M Ostwald-de Waele model
parameter
kg.sn-2/m
-n Ostwald-de Waele model parameter
-Ne Number of loops in the particle
trajectory
-Q Fluid volumetric flow rate m3/s
r Radius m
Rc Radius of the cylindrical part
of the hydrocyclone
m
Rf Underflow-to-throughput ratio
(by volume)
-S Shear stress function kg/m s2
u Fluid feed velocity m/s
uc Liquid velocity based upon the
cross section of the cylindrical part of the hydrocyclone
m/s
v Solid particle velocity m/s
vt Terminal velocity m/s
Va Hydrocyclone volume
neglecting the air core
m3
X Weight fraction of the particles
smaller than a diameter D
-Greek Letters
ω Fluid angular velocity m/s
φ Sphericity
-ψ Dimensionless coefficient
dependent on the hydrocyclone configuration, Euler number
-ΔP Pressure drop in the
hydrocyclone
kg/m s2
η Total efficiency
-λ Rate of shear 1/s
λ* Characteristic rate of shear 1/s
μ Fluid viscosity kg/m s
μapp Apparent fluid viscosity kg/m s
ρ Fluid density kg/m3
ρs Solid density kg/m3
REFERENCES
Barrientos, A. and Concha, F., Phenomenological Model of Classification in Conventional Hydro-cyclones. In: Comminution - Theory and Practice, American Institute of Mining, Metallurgical and Petroleum Engineers, New York, Chapter 21, p. 287-305 (1992).
Bloor, M. I. G., Ingham, D. B. and Laverack, S. D., An analysis of boundary layer effects in a
hydrocyclone. 1st International Conference on
Hydrocyclone, Cambridge, UK, p. 49 (1980). Bradley, D., The Hydrocyclone. Pergamon Press,
London (1965).
Brennan, M. S., Narasimha, M., Holtham, P. N., Multiphase modeling of hydrocyclones – predic-tion of cut-size. Minerals Engineering, 20(4), 395-406 (2007).
Damasceno, J. J. R., Clark, S. and Massarani, G., Rheology of suspension and the effects of particles concentration on the particle dynamic II. XVIII Brazilian Meeting in Porous Media, v. 1, p. 103, Nova Friburgo, Rio de Janeiro (1990). (In Portuguese).
Davailles, A., Climent, E., Bourgeois, F., Majumder, A. K., Analysis of swirling flow in hydrocyclones operating under dense regime. Minerals Engi-neering, 31, 32-41, (2012).
Dyakowsky, T., Hornung, G. and Williams, R. A., Simulation of non-Newtonian flow in a hydro-cyclone. Trans. IchemE, 72, 515 (1994).
Horsley, R. R., Tran, Q. and Reizes, J., The effect of
rheology on performance of hydrocyclone. 4th
International Conference on Hydrocyclone, Cambridge, UK, p. 215 (1992).
Lilge, E. O., Hydrocyclone fundamentals. Bulletin Institution of Mining and Metallurgy, London, 71, 285-337 (1961-1962).
Lynch, A. J. and Rao, T. C., Studies on the operating characteristics of hydrocyclone classifiers. Indian J. Technology, 6, 106-114 (1968).
Lynch, A. J., Rao, T. C. and Prisbey, K. A., The influence of hydrocyclone diameter on reduced efficiency curves. Int. J. Mineral Processing, 1, 173-181 (1974).
Lynch, A. J. and Rao, T. C. Modelling and scalle-up
of hydrocyclone classifiers. Proceedings 11th Int.
Mineral Processing Congress, Paper 9, p. 9-25 (1975).
Laruccia, M. B., Velocity sedimentation in non-Newtonian fluids; form and particles concentra-tion effects. Master Dissertaconcentra-tion, UNICAMP, Campinas, Brazil (1990). (In Portuguese).
Massarani, G. and Silva Telles, A., Non-Newtonian fluid flow in the neighborhood of solid particles. Brazilian Journal of Physics, 8(3), 550-562 (1978). (In Portuguese).
Napier-Munn, T. J., Influence of medium viscosity on the density separation of minerals in cyclones.
1st International Conference on Hydrocyclone,
Cambridge, UK, p. 63 (1980).
Pettyjohn E. S. and Christiansen, E. B., Effect of particle shape on free-settling rates of isometric particles. Chem. Eng. Progress, 44(2), 157-172 (1948).
An Investigation of the Behavior of a Classifying Hydrocyclone with Pseudoplastic Fluids 791
of feed inlet diameter on the hydrocyclone behavior. Int. J. of Mineral Processing, 3, 357-363 (1976).
Svarovsky, L., Solid-Liquid Separation. Butterworths, London (1981).
Svarosky, L., Hydrocyclone. Holt, Rinchart & Winston, London (1984).
Svarovsky, L., Solid-Liquid Separation. Butterworths &
Co. Ltd, 3rd Ed., London (1990).
Upadrashta, K. R. and Venkateswarlu, D., Tangential flow pattern of power-law fluids in a hydrocyclone. J. Powder Bulk Solids Tech., 7(4), 19-28 (1983). Upadrashta, K. R., Ketcham, V. J. and Miller, J. D.,
Tangential velocity profile for pseudoplastic power-law fluids in the hydrocyclone - A theoretical derivation. International Journal of Mineral Processing, 20, 309-318 (1987).
Walker, K. J., Veasey, T. J. and Moore, I. P. T., A parametric evaluation of the hydrocyclone separa-tion of drilling mud from drilled rock chippings.
4th International Conference on Hydrocyclone,
Cambridge, UK, p. 121 (1992).
Yasblonskii, V. O., Hydrodynamics of non-Newtonian fluid flow in hydrocyclone. Russian Journal Applied Chemistry, 73(1), 102-107 (2000).
Yasblonskii, V. O., Flow hydrodynamics of non-Newtonian fluid in a cylindrical-conical hydro-cyclone. Russian Journal Applied Chemistry, 77(6), 957-963 (2004).
Yasblonskii, V. O., Effect of rheological properties of the dispersion medium on separation of suspensions in hydrocyclones with various working space configurations. Russian Journal Applied Chemistry, 78(8), 1294-1300 (2005). Yasblonskii, V. O. and Ryabchuk, G. V., Flow of a
rheologically complex suspension in a cylindro-conical hydrocyclone. Theoretical Foundations of Chemical Engineering 39(4), 333-339 (2005). Yoshida, H., Takashina, T., Fukui, K., Iwanaga, T.,