*Corresponding author: Mohammadali Torbati, Fax: +98 41 33379529, Email: [email protected] ©
2016 The Authors. This is an Open Access article distributed under the terms of the Creative Commons Attribution (CC BY), which permits Adv Pharm Bull, 2016, 6(4), 597-606
doi: 10.15171/apb.2016.074 http://apb.tbzmed.ac.ir
Advanced
Pharmaceutical
Bulletin
Some Qualitative and Rheological Properties of Virgin Olive Oil-
Apple Vinegar Salad Dressing Stabilized With Xanthan Gum
Solmaz Abedinzadeh1, Mohammadali Torbati1*, Sodeif Azadmard-Damirchi2
1
Department of Food Science and Technology, Faculty of Nutrition, Tabriz University of Medical Sciences, Tabriz, Iran. 2
Department of Food Science and Technology, Faculty of Agriculture, University of Tabriz, Tabriz, Iran.
Introduction
Salad, usually served as a side dish or a full food, is a very fashionable food choice. Sauces are added to salads and other foods to improve or alter their flavor and make them more palatable.1
Olive oil is a part of the Meditrainian diet, and it has positive roles in the prevention of some illnesses. It has high oxidative stability because it is rich in monounsaturated fatty acids, antioxidants and phenolic compounds.2 In addition to having all these benefits, the popular taste of olive oil makes it the best candidate to be selected as oil base in the salad dressings.3
Apple vinegar has many bioactive compounds and has been shown to have many positive effects on health. This ingredient also decreases pH; therefore, it increases products shelf life and retard spoilage.4
Salad dressings are emulsions which need to have emulsifiers to be stable. Generally, egg yolk is used as an emulsifier in their production. Egg yolk has high cholesterol and saturated fatty acid content, which may promote cardiovascular diseases. Also, egg yolk can increase the risk of microbial contamination and reduce shelf life of products. For this reason, there is more interest to introduce new emulsifiers as alternatives to
egg yolk. Some suitable options are hydrocolloids and polysaccharides.5,6
Xanthan gum is one of the widely used hydrocolloids in food industry which is an anionic heteropolysaccharide
made by the “Xanthomonascampestris”.7 Xanthan solutions are highly semiplastic and show high viscosity, so they are used in oil-in-water emulsions so as to develop aqueous phase viscosity as well as to prevent them from creaming and phase separation.8,9
Lipid oxidation is a predominant reason for quality deterioration of oils, fats and foods with high content lipids during storage. The interaction between unsaturated lipids and oxygen-active compounds is the basis for this reaction. Different factors can affect oxidative stability of oil-in-water emulsions, including lipid types, oxygen concentrations, antioxidants, interfacial characteristics, droplet specification, interactions with aqueous phase components and the presence of prooxidants.10 The role of polysaccharides in
lipid oxidation in o/w emulsions system has been shown in some studies.11 The polysaccharide increases aqueous
phase’s viscosity and thus prevents oxygen dispersion
and reduces the oil droplet's motion, reducing their
Article History:
Received: 5 September 2016 Revised: 3 November 2016 Accepted: 7 November 2016 ePublished: 22 December 2016
Keywords: Lipid oxidation Xanthan gum Rheological behavior Emulsion stability Microstructure
Abstract
Purpose: Lipid oxidation and rheological properties are the main qualitative parameters
determined in food emulsions. Salad dressings are food emulsions important in our daily diet, but conventional salad dressings have high amounts of cholesterol and saturated fatty acids because of egg yolk in their formulations. There are many studies on the modification of salad dressing formulations to replace egg yolk and saturated fats. The present study describes new formulation of salad dressing with olive oil and apple vinegar to produce a functional food product.
Methods: This study investigated the qualitative properties, oxidative stability, rheological
behavior and microstructure of the salad dressing without egg yolk. Oil-in-water emulsions were prepared with virgin olive oil and apple vinegar stabilized with various percentages of
xanthan (T1: 0.25%, T2: 0.5%. T3: 0.75%). Samples were stored at refrigerator for 90 days
and experiments were performed at production day and during storage.
Results: The obtained results showed that peroxide value was increased for all samples
during storage, but it was at an acceptable level. Fatty acid changes were not significant during storage. Droplet size was reduced by increasing xanthan gum. T2 had the best rheological properties during storage. Generally, T2 and T3 had higher scores and were more acceptable in organoleptic assay.
Conclusion: Obtained results showed that T2 had suitable qualitative and rheological
properties and can be a proper egg yolk free salad dressing to introduce to the market.
Abedinzadeh et al.
collision possibility. Also, it chalets the metal ion and results in high oxidative stability.12
In this study, to produce healthy and nutritious salad dressings, xanthane was used to replace egg yolk. The purpose was studying the effect of xanthan gum on oxidative stability, physicochemical, rheological characteristics, microstructure and droplet size distribution of olive oil-in-water and apple cider vinegar emulsions.
Materials and Methods
Materials
Xanthan gum was purchased from Sigma Chemical Co. (USA). Virgin olive oil was produced by Iranian zeytoonak company (Alma). Apple vinegar was produced by the traditional method. Other ingredients included sugar, salt, garlic powder and mustard, which were purchased from local market. All chemicals were of reagent grade and were bought from Merck KGaA 64271 Darmstadt Germany.
Preparation of salad dressing
The researchers prepared oil-in-water emulsions (45% w/w) based on the method described by A. Paraskevopoulos et al as follows:13 half the olive oil was mixed with xanthan gum by stirring with a glass stirrer. Then all of the water, solid materials, apple vinegar and the remaining oil were mixed together in the mixer (Richmond) at the speed of 9500 rpm at room temperature for 3 minutes. Then, the mixture of oil and gum was added to the mixer.The emulsions were prepared by stirring for 1 minute in the same conditions. Xanthan gum concentration was 0.25% (T1), 0.5% (T2),
0.75% (T3).
All samples were kept at 4°C for 90 days, and PV were
tested on the first day and every 30 days, but rheological properties and fatty acid determination and organoleptic test were determined on the first day and each 90 days. Microstructure was evaluated on the first day of production.
Peroxide value
Peroxide value (PV) was determined by method (AOAC, 2000, Method Number 965.33b) on the oil extracted from salad dressing (by Jacoben et al method) during 90 days storage in intervals of 30 days.14
Fatty acid profile
Transformation of oil to fatty acid methyl ester was done by European official methods of Analysis (AOCS Ce 2-66(1997)). The profile of fatty acid was determined by gas chromatograph (GC-1000, DANI, Italy) with flame ionization detector in accordance with the method explained by Azadmard-Damirchi et al.15
Rheological measurements
The samples, steady and oscillatory shear rheological properties were measured through the use of a shear-rate
⁄ shear stress controlled Rheometer (Anton Paar,
MCR301, Austria) with concentric cylinder system (CC27: Ti, ø cup [mm]: 28.92, ø bob [mm]: 26.66) at 25°C ± 0.01). We measured shear stress as a function of shear rate over a wide range from 0 to 100 s-1. To clarify
the influence of different amounts of xanthan gum on the rheological behavior of emulsions, their shear stress vs. shear rate data were fitted with some reported mathematical models including;Power law (Eq. 1), Bingham (Eq. 2), Herschel-Bulkley (Eq. 3) and Casson (Eq. 4).
n
(1)0
)
(
pl
(2)0
n
(3) 5 . 0 0 5 . 0 5 . 0 1 5 .
0
(
)
(
)
(
)
)
(
(4)
[
represents shear stress (Pa);
, consistency coefficient (Pa.s)n;
, shear rate (s-1);pl
, plastic viscosity (Pa.s);
0, yield stress (Pa);
1, Casson plastic viscosity (Pa.s);n
, flow behavior index].R2 was used to evaluate the fitting of experimental data with models.16
Determination of the viscoelastic properties
Dynamic oscillatory test was performed over an angular
frequency (ω) in the range of 0.05–100 rad/s at constant strain. The obtained mechanical spectra were:
G : storage modulus G : loss modulus
tan δ= G / G : loss tangent components
η* = G*/ ω: complex viscosity
Then, the curves of G , G , η* and tan δ versus frequency
were obtained, as described by Steffe JF (1996).17 The
Bohlin’s parameters were determined from the equation: G* = Aω1/z
, where: z represents coordination number
(dimen-sionless) and A represents proportional
coefficient (Pa s1/z).18,19 The measurements were obtained
by doing three replicate experiments for each sample. Rheological parameters were specified on the first day of production and after 3 months storage.
Microstructure
The droplets of emulsions were observed with a light microscope (CETI,UK) according to the method described by S. Pei Ng et al. Images of the samples microstructures were taken by a digital camera (Sony, Zeiss, Japan) jointed to the microscope at a magnification of ×20.20
Droplet size distribution
Quality of Salad Dressing Stabilized With Xanthan Gum
by method of Karimi et al.20 Results were reported by Particle sizer device software and according to Fran Hofer model as the following parameters:
D[4,3] =Σnidi4 / Σnidi3 (6)
Span = Dv90 − Dv10 /Dv50 (7)
where Dv10, Dv50 and Dv90 represent 10%, 50% and 90%
of the droplets diameters in all the emulsion volumes with diameters smaller or equal to these values.
ni is the number of droplets of diameter di.20
Organoleptic evaluation
Sensory analysis was performed by quantitative descriptive test through a general panel consisting of 15 assessors. The features were assessed for color, flavor, texture and acceptance in terms of customer-friendliness and compared to similar products on the market. The ranking was as follows: (1: very weak, 2: weak, 3: average, 4:favorable, 5:very well). No information was given to the panelists and all of the samples were coded randomly.
Statistical analysis
All measurements were made in triplicate on samples. The data were analyzed using SPSS (version 20) and
results were stated as mean and standard error of mean. One-way analysis of variance (ANOVA) and LSD test were the data analysis tools used to establish the significance of the differences among the mean values at the 0.05 significance level. Repeated measure test was employed to express the significant difference between the mean values obtained in the course of time. MATLAB software (v. R2012a) was used for the rheological models.
Results and Discussion
Oxidative stability
Peroxide value
Lipid oxidation occurs on the surface layer of the oil droplets in oil-in-water emulsions. The interaction between lipid hydroperoxides at the droplet surface and transition metals, from the aqueous phase, is the popular reason for oxidative inconsistency which has been suggested by many studies.21
PV range for olive oil is 15 (meqO2/kg oil); therefore, all
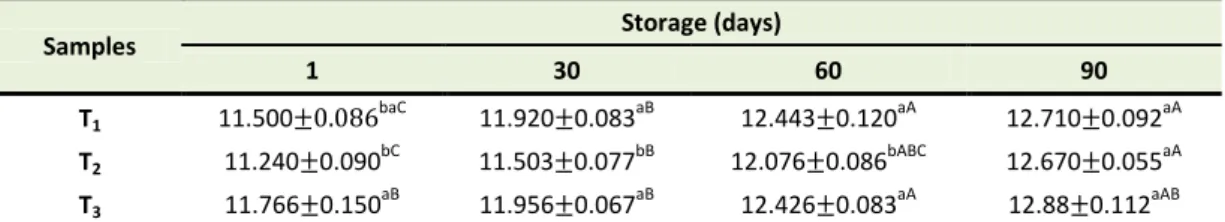
of the salad dressings PVs were acceptable. The sample with 0.5% of xanthan had a significantly lower PV (P<0.05) than the other samples. PV was increased in all samples and reached from 11.2 to maximum level of 12.88 during storage (Table 1).
Table 1. Peroxied value (meq O2/kg oil ) of olive oil– apple cider vinegar salad dressings during storage at 4oC
Samples Storage (days)
1 30 60 90
T1 11.500
baC
11.920 0.083aB 12.443 0.120aA 12.710 0.092aA
T2 11.240 0.090
bC
11.503 0.077bB 12.076 0.086bABC 12.670 0.055aA
T3 11.766 0.150
aB
11.956 0.067aB 12.426 0.083aA 12.88 0.112aAB
Mean Standard errors. Means within the same column (a, b, c) and the same row (A, B, C, D) with different letters are significantly different (p < 0.05).
Level of xanthan in samples: T1: 0.25%, T2: 0.5% and T3: 0.75%.
Fatty acid profile
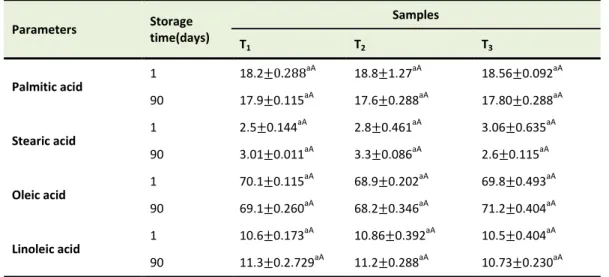
The main fatty acid in samples was oleic acid flowed by palmetic and linoleic acids. There were no significant differences among samples in fatty acid composition. Fatty acid profile results confirm that the new salad dressing formulation can be used successfully in the market without concern on fatty acid oxidation (Table 2). The oxidation of fatty acid and their changes were not significant. PV values also confirm these results. PV was not increased at high rate during storage (Table 1).
Rheological behavior
Flow behavior
The data obtained from the experiments for the shear stress (σ) and shear rate (γ_) at 25 °C were fitted with Power law, Herschel–Bulkley, Bingham and Casson models. The Herschel–Bulkley model with highest coefficients of determination [(R2 = 0.991–0.998)] was
chosen as the best model to describe the rheological behavior (Table 3).
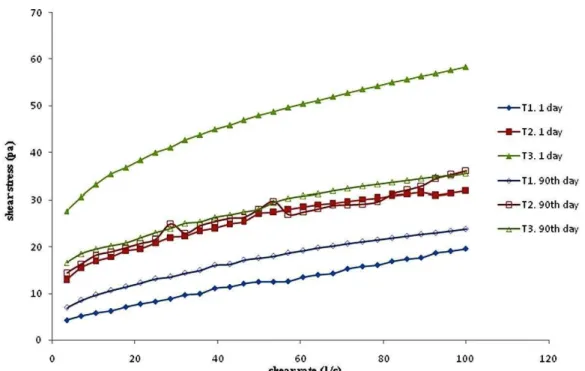
Trends of shear stress increase with raising the shear rate (Figure 1). In most instances, the flow curve is the first and the main rheological measurement. The value of the yield stress depends on the strength of the absorbing powers holding a droplet together (e.g., the stronger the attracting forces, the higher the yield stress).22 This means that by increasing the amount of xanthan gum in the treatment, the forces between the droplets also increase. In the comparison between the experiments of the first day and 90 days after storage, the charts are closer together and reach equilibrium. This indicates that the structure of T3 firmly declined over time. The
structure of T1 is stronger. Over time, the T2 did not show
great changes and kept its original structure.
The flow behavior indicator (n) is an index employed to recognize the properties of liquid product:
n=1: Newtonian fluid
n < 1 : indicates shear-thinning liquid n > 1 : shear-thickening or dilatant fluid.
Abedinzadeh et al.
shear-thinning behavior (non Bingham plastic). None of the samples displayed a linear relation between the shear
stress and the shear rate values (Figure 1), exhibiting their pseudoplastic behavior.
Table 2. Fatty acid composition (%) for xanthan gum stabilized olive oil-apple cider vinegar salad dressings during storage
Parameters Storage
time(days)
Samples
T1 T2 T3
Palmitic acid
1 18.2 aA 18.8 1.27aA 18.56 0.092aA
90 17.9 0.115aA 17.6 0.288aA 17.80 0.288aA
Stearic acid
1 2.5 0.144aA 2.8 0.461aA 3.06 0.635aA
90 3.01 0.011aA 3.3 0.086aA 2.6 0.115aA
Oleic acid
1 70.1 0.115aA 68.9 0.202aA 69.8 0.493aA
90 69.1 0.260aA 68.2 0.346aA 71.2 0.404aA
Linoleic acid
1 10.6 0.173aA 10.86 0.392aA 10.5 0.404aA
90 11.3 0.2.729aA 11.2 0.288aA 10.73 0.230aA
Mean Standard errors. Means within the same row (a, b, c) and the same column (A, B) with different letters are significantly different (p < 0.05). For treatments see Table 1.
Table 3. Rheological parameters from Hershel Balkly and viscoelastic behaviors according frequency sweep test for xanthan gum stabilized olive oil-apple cider vinegar salad dressings
S
amp
le
s
Parameters
k n ɕ0 (pa) R ηa50 A Z
Storage
time(days) 1 90 1 90 1 90 1 90 1 90 1 90 1 90
T1 0.286 cB 1.605 0.004 bA 0.866 0.003 aA 0.548 0.004 aB 3.518 0.009 cB 3.653 0.031 cA 0.9962 0.9992 0.2395 0.0005 cB 0.3468 0.0005 cA 6.2110 cB 17.0425 1.2567 bA 0.2429 0.0109 aA 0.2433 0.0118 aA T2 3.435 0.003 bA 2.326 0.003 aB 0.433 0.003 bB 0.512 0.011 aA 7.949 0.0527 bB 10.174 0.005 bA 0.9916 0.9533 0.5326 0.0006 bB 0.5481 0.0006 bA 31.7333 0.9907 bB 36.0888 0.5722 aA 0.1533 0.0054 cA 0.1534 0.0042 bA T3 4.845 0.004 aA 1.44 0.020 cB 0.450 0.001 cB 0.608 0.018 bA 18.962 0.051 aA 13.279 0.040 aB 0.9912 0.9955 0.9425 0.0004 aA 0.5763 0.0006 aB 59.9706 0.8770 aA 35.8374 2368 aB 0.1252 0.0059 bA 0.1333 0.0053 bA
Quality of Salad Dressing Stabilized With Xanthan Gum
Figure 1. Flow curves of various emulsion samples plotted with shear stress over shear rate for (I) one-day and (II) 90 days. For treatments see Table 1.
The reduction in the apparent viscosity of the samples with time at a constant shear for T1 and T2 was most
possible owing to the deformation and/or reformation of oil droplet flocs (Figure 2). The apparent viscosity values of the T1 and T2 (on the first day and after 90 days) at a
shear rate of 50 s−1 were in the range of 0.239 to 0.532 Pa s, whereas the T3 (on the first day) was 0.942Pa.s
(Table 3). The viscosity value increased as the percent of xanthan in the sauces increased from 0.25 to 0.75 wt.%, thereby lowering the ability of the emulsion to flow. In the emulsion with higher viscosity, the free movement of the oil droplets is delayed, so retarding creaming, flocculation, and coalescence of the oil droplets; our results are consistent with those formerly reported.23
Furthermore, the K values of O/W emulsion dressings depend on the relation of the oil fraction or the attendance of oil in the emulsion.24 The K index indicates the viscous nature of the emulsion samples (Table 3). Higher K values match up to a stronger emulsion structure. Moreover, the K index for all the salad dressings increases with increasing the percentage of xhanthan for the first day,but on the 90th day K value for T3 sample was lower than T2 sample. This result agrees
with the viscosity curve and T3 structure is more stable
during shelf life. Samples were not separated into two phases at the end of the storage.
Abedinzadeh et al.
Viscoelastic behaviors
A frequency sweep test is a functional technique for investigating the viscoelastic property of emulsions and is useful in perusing their chemical combination and physical structure.25 The values obtained from this test describe the behavior of the salad dressings and specify if viscouity or elasticity dominates, more than a given frequency range. The frequency dependence of the storage modulus (G ), loss modulus (G ), loss tangent
(tan δ), and complex viscosity of all samples on the first
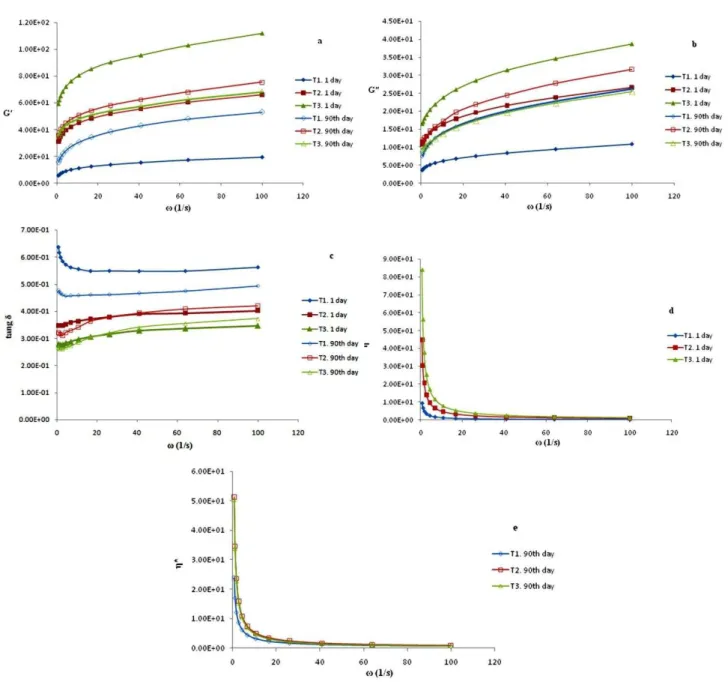
day and 90 days after storage is shown in Figure 3a–d. The strength and stability of a material can be specified by several rheological parameters. This information is important for product expansion, mainly for the
formulation and processing of emulsions. A graph (Figure 3a) shows the different tendency of G in the salad dressings as the frequency increased. G also increased in a similar way to G in all samples but slightly contrasted with G (Figure 3b). The graphs show that all of the sauces prepared with xanthan behave in the same way as gel-like structured materials in which G > G . The results of this study accord with those obtained by the researchers who reported that when G > G , it indicated a gel-like structure with a congested and entwined network, while when G > G , it represented the typical behavior of non-flocculated or weakly flocculated emulsions.18
Figure 3. (a) torage modulus G , (b) loss modulus G, (c) tan δ, (d and e) complex viscosity (η *) versus frequency at first day and after storage at 4 °C for 90-days for all emulsion samples. For treatments see Table 1.
Information concerning the amount of structure present had been demonstrated in a material by the G value.
T3(with 0.75% of xanthan) on the first day had the
Quality of Salad Dressing Stabilized With Xanthan Gum
after 90days. Effect of the colloidal forces on the interplay between the particles and the droplets is probably the cause of the concentrated O/W systems
with higher G value.
A measure of the quality of an emulsion's behavior (emulsion strength) is shown by the tangent of the phase angle. In fact, elasticity or viscosity of emulsions is
determined with this parameter. Using tan δ is the best
manner to demonstrate the strength of an emulsion (for comparison) (Figure 3 c).
Tan δ = G / G reveals the strength of the colloidal forces. The viscoelastic behavior of the emulsions is described by ratio of the elastic modulus to the loss
modulus. Emulsions with (G / G near 1) have liquid-like
or viscous behavior, and materials with (G / G less than
1) are solid-like or elastic. Particles’ high connection
caused by colloidal forces is displayed with tan δ>1,
since probably sedimentation happens. The salad dressing with 0.25% xanthan gum on the first day of
product had the highest tan δ value, followed by the
sample with 0.5% xanthan gum and the emulsion with 0.75% of the same gum, compared with each other. By comparing the results of the first day and the 90th day, it
is noted that tan δ declines for all samples, but in the case
of T1 and T3, this is significant (p<0.05). The emulsion
with 0.75% xanthan gum had the highest values of G
and tan δ, suggesting that it had the greatest stability
during the 90 days of storage in this study, but sauces with 0.5% of gum had the lowest change between the first day and 90th day parameter; as a result, passage of time had the least effect on this sample (Figure 3a,c). These results agreed with those reported by Franco et al,
who found out that the tan δ value was related with the
emulsion stability, which means that a higher tan δ value was linked with a more stable emulsion product.26 Also,
Ma et al suggested that emulsions with a greater fat content demonstrated higher values of G because G represents the recoverable energy when the material undergoes deformation.26 The results indicate that for the
tan δ values of all of the emulsions with xhantan gum,
ranging from 0.24 to 0.65, which is <1, all of the emulsion showed solid-like/elastic behaviour rather than viscous behaviour. This conclusion agreed well with that of Steffe et al (1996), who reported that the smaller the
tan δ value, the more elastic the system is and the larger the tan δ value, the more fluid the system is.17
The magnitudes of the complex viscosity (η*) decreased
with the increase in frequency (Figure 3.d and e).The
emulsion with 0.75.% xanthan had the highest η* value
(on the first day), followed by those with 0.5.% gum and sample T3 had the lowest value. The system with a higher viscosity could be interrelated to one or more of the following interlinked factors: a thicker adsorbed layer, stronger interactions between the globules, smaller globules, and/or stronger water immobilization by the adsorbed peptides, therefore increasing the thickness of the membranes surrounding fat globules, which consequently resist coalescence; otherwise, rapid destabilization happens, causing oil separation.27
Since the number A represents the power structure, by increasing the percentage of the gum and with the passage of time, the structure of salad dressings are more stable and firm (Table 3).
The Z numbers shown in Table 3 are testament to the determination of the type of structure (non Bingham plastic) for production samples.
Microstructure
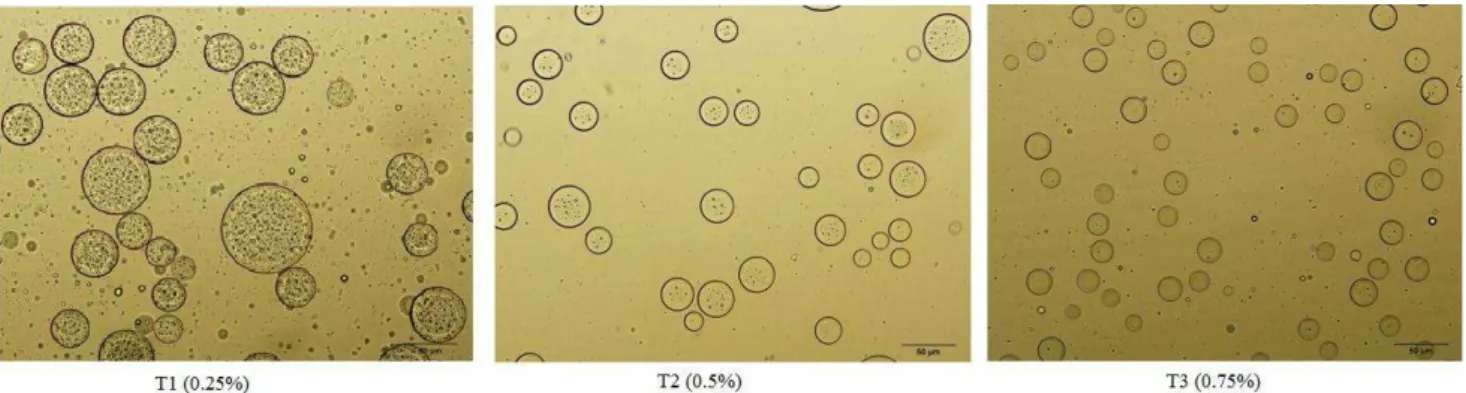
Particle distributions of emulsions containing different concentrations of gum are well visible by microscope (Figure 4).The sample containing 0.25% xanthan had wider particle size distribution and also was larger than the other emulsions.With increasing the percent of xhantan, uniform particle was greater and droplet size was smaller. According to previous studies, increasing in viscosity due to high concentration of gum probably causes the oil droplets to become smaller and unflocculated.20,21,28
Figure 4. Microstructure and of olive oil– apple cider vinegar functional salad dressings stabilized with xhantan gum at first day of production. For treatments see Table 1.
Droplet size distribution
In describing the particle size, D [4,3] represents volume average particle and span index shows dispersion around the mean. The results show that by increasing gum
Abedinzadeh et al.
Table 4. Droplet mean diameter, disparity index (span) and particle size of olive oil– apple cider vinegar salad dressings at first day.
Samples Parameters
Dv10 Dv50 Dv90 Span index D4,3(µm)
T1 2.40 0.05 a
3.5 0.57a 26 0.57a 6.74 0.02b 135.02 0.57a T2 2.30 0.11
a
2.8 0.17b 24 1.15b 7.8 0.16a 32.51 0.57b T3 2.4 0.17
a
3.10 0.11ab 20 1.73b 5.67 0.02c 22.98 0.71c
Mean Standard errors. Means within the same column (a, b, c) with different letters are significantly different (p < 0.05). For treatments see Table 1.
Sensory analysis
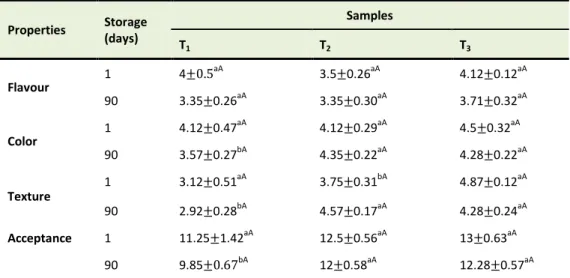
According to the scores given by the organoleptic panelists evaluating the samples, there was no significant (P<0.05) difference among the samples (Table 5). But over time, a significant reduction in scores on taste and texture in T1 was observed. In participants, opinion,
color change over time was seen only in T1, and there
was no significant difference between T2 and T3 treatments. Texture of T1 was not accepted by the panelists and it dropped by extending the shelf life. But the texture of samples T2 and T3 was the same rating and did not change over time. Generally, for the panelists participating in the test samples, T2 and T3 had higher scores and were more acceptable.
Table 5. Mean sensory scores of olive oil– apple cider vinegar salad dressings during storage at 4°C.
Properties Storage
(days)
Samples
T1 T2 T3
Flavour
1 4 aA 3.5 0.26aA 4.12 0.12aA
90 3.35 0.26aA 3.35 0.30aA 3.71 0.32aA
Color
1 4.12 0.47aA 4.12 0.29aA 4.5 0.32aA
90 3.57 0.27bA 4.35 0.22aA 4.28 0.22aA
Texture
1 3.12 0.51aA 3.75 0.31bA 4.87 0.12aA
90 2.92 0.28bA 4.57 0.17aA 4.28 0.24aA
Acceptance 1 11.25 1.42aA 12.5 0.56aA 13 0.63aA
90 9.85 bA 12 0.58aA 12.28 0.57aA
Mean Standard errors. Means within the same column (a, b, c) and the same row (A, B, C) with different letters are significantly different (p < 0.05). For treatments see Table 1.
Conclusion
In this study, the content of polysaccharide xanthan was
investigated to create optimal physicochemical
characteristics and oxidative stability and favorable rheological behavior in salad dressings free of cholesterol and egg yolk produced by extra virgin olive oil and apple vinegar. Chemical and rheological results illustrated that among the 3 treatments of different percentages of xanthan gum that were prepared, T2 with
0.5% xanthan gum showed the most desirable oxidative stability and the best rheological behavior, and it gained the highest score of sensory evaluation. Also, comparison of periodic testing states that T2 had the
significantly lowest changes during storage. Thus, salad dressing formulation with extra olive oil and apple vinegar with 0.5% xanthan gum can be used in the industrial production and produce functional sauce with optimal physicochemical characteristics, oxidative and rheological and customer-friendly production.
Acknowledgments
Funding for this study was provided by Tabriz University of Medical Sciences and the Department of Food Science and Technology.
Ethical Issues
Not applicable.
Conflict of Interest
The Authors report no declaration of interest.
References
1. Sheldrake P. Controlling textures in soups, sauces and dressings. In: McKenna B, editor. Texture in food. Volume 1: Semi-Solid Foods. Cambridge England: woodhead; 2003. P. 389-421.
2. Bendini A, Cerretani L, Carrasco-Pancorbo A,
Gómez-Caravaca AM, Segura-Carretero A,
Quality of Salad Dressing Stabilized With Xanthan Gum
health effects, antioxidant activity and analytical methods. An overview of the last decade Alessandra.
Molecules 2007;12(8):1679-719. doi:
10.3390/12081679
3. Östman E, Granfeldt Y, Persson L, Björck I. Vinegar supplementation lowers glucose and insulin responses and increases satiety after a bread meal in healthy subjects. Eur J Clin Nutr 2005;59(9):983-8. doi:
10.1038/sj.ejcn.1602197
4. Johnston CS, Kim CM, Buller AJ. Vinegar improves insulin sensitivity to a high-carbohydrate meal in subjects with insulin resistance or type 2 diabetes.
Diabetes Care 2004;27(1):281-2. doi:
10.2337/diacare.27.1.281
5. Dickinson E. Hydrocolloids at interfaces and the influence on the properties of dispersed systems.
Food Hydrocoll 2003;17(1):25-39. doi:
10.1016/S0268-005X(01)00120-5
6. Lai L, Lin P. Application of decolourised hsian-tsao leaf gum to low-fat salad dressing model emulsions: a
rheological study. J Sci Food Agric
2004;84(11):1307-14. doi: 10.1002/jsfa.1757
7. Garcıa-Ochoa F, Santos VE, Casas JA, Gomez E. Xanthan gum: production, recovery, and properties.
Biotechnol Adv 2000;18(7):549-79. doi: 10.1016/S0734-9750(00)00050-1
8. Katzbauer B. Properties and applications of xanthan gum. Polym Degrad Stab 1998;59(1-3):81-4. doi: 10.1016/S0141-3910(97)00180-8
9. Sun C, Gunasekaran S, Richards MP. Effect of xanthan gum on physicochemical properties of whey protein isolate stabilized oil-in-water emulsions. Food
Hydrocoll 2007;21(4):555-64. doi:
10.1016/j.foodhyd.2006.06.003
10.McClements DJ, Decker EA. Lipid oxidation in oil-in-water emulsions: Impact of molecular environment on chemical reactions in heterogeneous food systems.
J Food Sci 2000;65(8):1270-82. doi: 10.1111/j.1365-2621.2000.tb10596.x
11.Shimada K, Okada H, Matsuo K, Yoshioka S. Involvement of chelating action and viscosity in the antioxidative effect of xanthan in an oil/water
emulsion. Biosci Biotechnol Biochem
1996;60(1):125-7.
12.Shimada K, Fujikawa K, Yahara K, Nakamura T. Antioxidative properties of xanthan on the autoxidation of soybean oil in cyclodextrin emulsion.
J Agric Food Chem 1992;40(6):945-8. doi:
10.1021/jf00018a005
13.Paraskevopoulou D, Boskou D, Paraskevopoulou A. Oxidative stability of olive oil-lemon juice salad dressings stabilized with polysaccharides. Food Chem
2007;101(3):1197-204. doi:
10.1016/j.foodchem.2006.03.022
14.Jacobsen C, Hartvigsen K, Lund P, Meyer AS, Adler-Nissen J, Holstborg J, et al. Oxidation in fish-oil-enriched mayonnaise 1. Assessment of propyl gallate as an antioxidant by discriminant partial least squares
regression analysis. Eur Food Res Technol
1999;210(1):13-30. doi: 10.1007/s002170050526 15.Azadmard-Damirchi S, Dutta PC. Novel solid-phase
extraction method to separate desmethyl-, 4-monomethyl-, and 4,4'-dimethylsterols in vegetable oils. J Chromatogr A 2006;1108(2):183-7. doi: 10.1016/j.chroma.2006.01.015
16.Ng SP, Lai OM, Abas F, Lim HK, Tan CP. Stability of a concentrated oil-in-water emulsion model prepared using palm olein-based diacylglycerol/virgin coconut oil blends: Effects of the rheological
properties, droplet size distribution and
microstructure. Food Res Int 2014;64:919-30. doi: 10.1016/j.foodres.2014.08.045
17.Steffe JF. Rheological methods in food process engineering. 2nd ed. USA: Freeman Press; 1996. 18.Ma Z, Boye JI. Advances in the design and
production of reduced-fat and reduced-cholesterol salad dressing and mayonnaise: a review. Food Bioprocess Technol 2013;6(3):648-70. doi:
10.1007/s11947-012-1000-9
19.Bortnowska G, Balejko J, Schube V, Tokarczyk G,
Krzemińska N, Mojka K. Stability and
physicochemical properties of model salad dressings
prepared with pregelatinized potato starch.
Carbohydr Polym 2014;111:624-32. doi:
10.1016/j.carbpol.2014.05.015
20.Karimi N, Mohammadifar M, Nayebzade K. Effect of two types of Iranian gum tragacanth on stability and rheological properties of oil-in-water emulsion. Iran J Nutr Sci Food Technol 2013;8(3):87-98.
21.Mei L, Decker EA, McClements DJ. Evidence of iron association with emulsion droplets and its impact on
lipid oxidation. J Agric Food Chem
1998;46(12):5072-7. doi: 10.1021/jf9806661
22.Pal R. Viscosity and storage/loss moduli for mixtures
of fine and coarse emulsions. Chem Eng J
1997;67(1):37-44. doi:
10.1016/S1385-8947(97)00011-9
23.Tesch S, Schubert H. Influence of increasing viscosity of the aqueous phase on the short-term stability of protein stabilized emulsions. J Food Eng
2002;52(3):305-12. doi:
10.1016/S0260-8774(01)00120-0
24.Chatsisvili NT, Amvrosiadis I, Kiosseoglou V. Physicochemical properties of a dressing-type o/w emulsion as influenced by orange pulp fiber
incorporation. LWT-Food Sci Technol
2012;46(1):335-40. doi: 10.1016/j.lwt.2011.08.019 25.Cruz M, Freitas F, Torres CA, Reis MA, Alves VD.
Influence of temperature on the rheological behavior
of a new fucose-containing bacterial
exopolysaccharide. tnI J Biol Macromol
2011;48(4):695-9. doi:
10.1016/j.ijbiomac.2011.02.012
26.Franco JM, Guerrero A, Gallegos C. Rheology and processing of salad dressing emulsions. Rheol Acta
Abedinzadeh et al.
27.Ma L, Barbosa-Cánovas G. Rheological
characterization of mayonnaise. Part II: Flow and viscoelastic properties at different oil and xanthan gum concentrations. J Food Eng 1995;25(3):409-25.
doi: 10.1016/0260-8774(94)00010-7
28.Khouryieh H, Puli G, Williams K, Aramouni F. Effects of xanthan-locust bean gum mixtures on the physicochemical properties and oxidative stability of whey protein stabilised oil-in-water emulsions. Food
Chem 2015;167:340-8. doi: