ISSN 0104-6632 Printed in Brazil
www.abeq.org.br/bjche
Brazilian Journal
of Chemical
Engineering
Vol. 22, No. 02, pp. 153 - 163, April - June, 2005
MODELLING AND SIMULATION
OF DRYING PHENOMENA WITH
RHEOLOGICAL BEHAVIOUR
S. Chemkhi
1*, F. Zagrouba
1and A. Bellagi
21
Laboratoire Energétique et Procédés Thermiques. Institut National de Recherche Scientifique et Technique, Phone: 00216 97 332 997, Fax: 00216 71 430 934,B.P. 95, Hammam-Lif 2050, Tunisia.
E-mail:saberchemkhi@yahoo.fr
2
Ecole Nationale d'Ingénieurs de Monastir, 5019 Monastir, Tunisia.
(Received: October 20, 2004 ; Accepted: November 3, 2005)
Abstract - Foods have high moisture contents which are lost during the drying process. This water loss can produce important changes in size that hinder the analysis of heat and mass transport. A model of simultaneous heat and moisture transfer in parallelepiped-shaped potato samples was coupled with a model of its elastic behaviour. Governing equations and boundary conditions were solved numerically using the finite difference method.
To check the validity of the mathematical model, drying experiments were carried out. Experimental conditions were as follows: drying temperatures of 38, 42 and 47°C; relative humidities of 14, 20 and 23% and air velocities of 1.5, 3 and 4.5 m/s. The different air velocities and temperatures were used in the drying process to determine their effects on drying time. It was obtained the range of moisture content in the sample and the range of temperature and stress during drying time. Comparison between predicted and experimental results provides satisfactory agreement.
Keywords: Drying of foods; Modelling, Heat and mass transfer; Rheological behaviour; Simulation.
INTRODUCTION
Food preservation is very important for the safety and the reliability of the product. Drying is very important because it is the easiest and most common way to preserve a variety of food products. Quality dried products are in great demand worldwide. The ability to forecast the damaging and cracking of these products is of major interest. Therefore, scientists started to simulate drying phenomena with different approaches. A large variety of models has been developed for modelling the drying process. In most of these models, one of the crucial assumptions is that shrinkage is negligible (Sherwood, 1929; Luikov, 1966; Kiranoudis et al., 1995; Pinheiro et al., 1998). However, the assumption of a rigid solid is not valid. In fact, drying is accompanied by
shrinkage in the most cases (Jomaa, 1991; Katelaars, 1992; Haghighi and Segerlind, 1998; Iyota et al., 2001). There are different types of shrinkage: ideal, elastic and viscoelastic.
The most appropriate approach for describing the deformation of many real products was found to be the viscoelastic behaviour. Haghighi and Segerlind (1998) studied the modern formulation of stress analysis in viscoelastic materials during drying. Further research on transient three-dimensional analysis was carried out by Itaya (1995). A thermo-mechanical approach to shrinking and cracking phenomena in drying was proposed by Kowalski (2001).
form, experimental drying data were obtained at different temperatures and different air velocities. Predicted values were compared to experimental results; results show that there are acceptable agreements.
EXPERIMENT
Experimental Installation
In Fig. 1 is presented the experimental installation. The most important part of the installation is the drying tunnel with adjustable air speeds and temperatures. Parallelepiped-shaped samples of potato, with approximate dimensions of
1*3*5 cm, are put in the dryer where airflow circulates parallel to their surfaces. The change in weight of the samples is controlled by a precision balance (Kern 770, max 220 gram, 0.001 gram precision) connected to a computer that allows storage of the values. Inlet air temperature and relative humidity are measured with a thermo-hygrometer (Testo 635). Air velocity is measured with an anemometer (Testo 425).
The drying process is controlled using a PC with an acquisition program. This program of data acquisition is developed in our laboratory. During the experiment the following parameters were controlled and registered: drying time, inlet air velocity, inlet air temperature, inlet air relative humidity and sample mass.
Figure 1: Experimental installation of the tunnel dryer. Experimental Procedure
Two different experimental conditions were accomplished: In the first, the airflow speed was fixed in 3 m/s and it was studied the influence of the variation in temperature in the total drying time. In the second condition, the temperature was fixed at 42°C and the air speed was varied to study its influence. The selected values of drying air velocities and temperatures are suitable for food product to avoid the deterioration of the material composition and quality because of them sensitive aspect.
MATHEMATICAL MODEL
To simplify the problem of heat and mass transfer in a deformable medium, the following hypotheses were made:
the medium is considered biphasic (solid and liquid),
the thickness of the sample is its smallest dimensions, so the mass and heat fluxes are assumed to be unidirectional,
the deformation is also assumed to be unidirectional,
all cross effects are neglected,
the initial distribution of moisture and temperature is considered uniform and
liquid evaporation occurs only at the external surface of the sample.
Heat and Mass Transfer
The continuity equation applied to the two phases gives
( )
ρsdiv ρsvs 0 t
∂
+ =
( )
ρl
div ρlvl 0 t
∂
+ =
∂ G (2) m v
(
v,surf v,a)
a. K M
m P
R T
= −P (9)
where ρs and ρl are the solid-phase and the liquid-phase densities and vs and vl are the solid-phase and the liquid-phase velocities.
Km is the mass transfer coefficient calculated from the Colburn analogy (Sieder and Tate, 1936) only in the case of a pure convective process: c
m air air h K Cp = ρ Using the continuity equations for the solid and
the liquid phase and defining the moisture content X as
The heat transfer coefficient hc is given by the correlation of Sieder and Tate (1936):
l s X=ρ
ρ (3)
c h
0.8 1 3 h
K Nu h
d
6 d
Nu 0.023 Re Pr (1 )
L
=
= +
(10) The model refers to the mass transfer that occurs
in a thin layer of material which is based on Fick's law. The mass balance for the material is given as
Rheological Behaviour
( )
( )
s s
X ρD
ρ v grad X div grad X
t 1 X
∂ + = ∂ + JJJJG JJJJG G
(4) Stress and deformation phenomena are coupled with mass and energy transfer mechanisms. The momentum conservation is
where ρ is the average density of the wet solid and D
is the moisture diffusivity of the liquid in the
medium. v vg rad v
( )
F d iv ( ij)t ∂
ρ + ρ = ρ + σ
∂
G G G G JJJG
(11) The heat balance in the dryer is given for the
non-isothermal case due to heat conduction in the material. The heat balance can be derived from the enthalpy balance
where σij is the stress tensor and F is the external force applied to the sample.
If we assume that there are no external forces and the inertial term is negligible, eq. 11 is limited to
( h) div( hv) div(K gradT)
t
∂ ρ + ρ = ∂
JJJJG
G (5)
J ij
d iv (JJG σ ) = 0G (12) ( h)
t ∂ ρ
∂ is the enthalpy change, div( hv)ρ G is the enthalpy change due to convective flux,
( )
(
)
d iv K g rad TJJJJG is the enthalpy change due to the conductive flux.
In the case of elastic behaviour of drying material, the observed strains ε are a function of changes in mechanical strains ε* (deformation due to elasticity) and in shrinkage strains ε0 (free deformation due to moisture loss and thermal effect) (Yang et al., 2001)
The initial and boundary conditions are as follows:
* 0
k l k l k l
ε (t) = ε (t)+ ε (t) (13)
0 0
t 0 and x X X and T T= ∀ ⇒ = = (6)
x 0 x 0
X T
x 0 and t 0 and - 0
x = x
∂ ∂ = ∀ ⇒ = ∂ ∂ = = (7)
The total strain is expressed as a function of total displacement j i ij j i u u 1 ε
2 x x
∂ ∂
= ∂ +
∂
(14)
(
)
.
x e
c surf v surf
x e
ρD X
x e and t m 1 X x
. T
and h Ta T mL (T ) -K x = = = ∀ ⇒− ∂ = + ∂ ∂ − = ∂ (8) .
The displacement of the solid phase during drying, denoted u, is a function of the moisture content of the product (Kechaou, 1989)
( )
du D
grad X
dt 1 X
β =
+ β
G JJJJG
(15) m is the evaporating mass flow defined as
The transformation of eq. 4 into Lagrangian coordinates results in the following form
where β is the contraction coefficient of the material during drying.
The stress-strain relation in the case of elastic behaviour is as follows
s
0 0
ξ s s t t
ρ
X 1 ρD X
t ρ ξ 1 X ρ ξ
∂ ∂ ∂ = ∂ ∂ + ∂ (21)
( )
(
T M)
σ λ= tr ε 1 2µ+ ε−3k α T∆ +β X 1∆ (16)
Using the equation for product density experimentally proved (Chemkhi et al., 2002)
where 1 is a unit tensor, λ and µ are the Lamé coefficients and k is the bulk modulus that combines the elastic parameters (Young modulus E and the Poisson's ratio ν). The parameters αT and βM are respectively the thermal and the moisture expansion coefficients. 0 s 1 X ρ ρ 1 X +
= + β (22)
we obtain the equation for the mass balance Mathematical Transformation and Numerical
Solution
2
ξ t t
X D X
t ξ (1 X ) ξ
∂ ∂ ∂
=
∂ ∂ + β ∂
(23) Due to the complexity of the problem and taking
into account the shrinkage of the material, we can write the main equations of our model in Lagrangian coordinates.
Using the same transformation technique, the system of equations to be solved is the following
ξi indicate solid coordinates, which are the positions at a reference time. We choose this reference time as the time when the middle becomes completely dry.
( )
(
)
j i ij j i T M ijX D X
t (1 X)²
T K T
Cp
t 1 X
u D X
t (1 X)²
u u 1 ε
2 x x
σ λ tr ε 1 2µ ε 3k α ∆T β ∆X 1
div( ) 0
ξ ξ ξ ∂ ∂ ∂ = ∂ ∂ξ + β ∂ξ
∂ ∂ ∂
ρ =
∂ ∂ξ + β ∂ξ
∂ β ∂
=
∂ + β ∂ξ ∂ ∂ = ∂ +∂ = + − + σ = (24) It is necessary to transform the right side of eq. 4
and then to do the spatial differentiations relative to the solid coordinates ξi (Lagrangian coordinates) and not to coordinates (x,y,z) (Eulerian coordinates).
For the one-dimensional case, for x=0 and ξ=0 the lower face is fixed.
The mass of the solid ms is conserved in the two coordinates
0
s s s
dm =ρdx=ρ dξ (17)
Using this equation, it is obtained
x s 0 0 s ρ
ξ dx
ρ
=
∫
(18) with the initial and the boundary conditions( )
(
)
0 0
.
c e v e
X( ,0) X ; T( ,0) T and u( ,0) 0
X T
0 ; 0 , 0 and u 0,t 0
D X
ξ e ; m
(1 βX)² ξ
. K T
and h Ta T m L (T ) -
1 βX ξ
ξ = ξ = ξ =
∂ ∂
ξ = = =
∂ξ ∂ξ ∂ = − = + ∂ ∂ − = + ∂ = (25) where ρs0 is the apparent dry solid density.
The change in variables (x,t) to (ξ,t) results in
ξ
x x
t t t
ξ 1 t t t ξ 0
x x ξ
∂ ∂ ∂ ∂ ∂ ∂ = ∂ ∂ ∂ ∂ ∂ ∂ (19)
Considering the complexity of the model, a numeric solution is necessary and will be applied to the system of equations (eqs. 24 and 25). We used
Where s
0 t s ρ ξ x ρ ∂ = ∂
RESULTS, DISCUSSION AND SIMULATION the finite difference method in its implicit form.
Equations will be integrated at a control volume and at a time step [t, t+∆t]. It should be observed that since the node is not fixed, we have to work with nodes of varying size during the time.
The previous mathematical model describes the coupling of the heat and mass transfer and the elastic behaviour of the material. We need a lot of physical data for characterisation of our product like Young’s modulus and Poisson’s ratio, which are not constant or easy to determine. In Appendix 1 are presented the physical properties of the material (fresh potato). These numeric values determined experimentally for fresh potato are used in the program to solve the mathematical formulation.
To discretise of the system of equations, we adopt the following hypotheses:
For temporal discretisation, we adopt an implicit diagram that permits assurance of the stability of the numeric model.
For the spatial differentiation at a node, we assume linear variations between two neighbouring nodes
Drying Kinetics
j 1 j 1 j 1
i 1 i 1 i
Φ Φ
Φ
ξ 2∆
+ + +
+ −
∂ =
∂ ξ
− (26) The results of the convective drying process are represented in Figs. 2 and 3. The drying kinetics increase with air temperature or velocity because of the raise in the convective heat transfers consequently the mass transfer. At the end of the process, this kinetics decrease and tend to zero. Profiles for the kinetics of potato drying obtained for different temperatures not cover the constant-rate drying period. The process takes place essentially during the falling-rate drying period. This result is the most frequently found in biologic products that dry at a decreasing velocity (Belahmidi et al., 1993; Kompany et al., 1993).
The system of equations is solved numerically using an iterative method of line-by-line sweep, starting with the choice of arbitrary range of solution (initial conditions). Coefficients values are calculated with the help of these arbitrary ranges. The system of equations is solved and this new solution is used to calculate coefficients of the matrix until the solution converges. The same iterative method is then used for the next line.
T=42°C
0 0,005 0,01 0,015 0,02 0,025
0 3600 7200 10800 14400 18000 21600 25200
Time (s)
-(
d
X/
d
t)
V=1,5 m/s V=3 m/s V=4,5 m/s
V=3 m/s
0 0,005 0,01 0,015 0,02 0,025
0 3600 7200 10800 14400 18000 21600
Time (s)
-d
X/
d
t
T1=38 °C ; HR=23 % T2=42 °C ; HR=19 % T3=47 °C ; HR=14 %
Figure 3: Drying kinetics at a constant air velocity.
Validation of the Model
In order to check the validity of the computer simulation results, the drying experiments were conducted. Fig. 4 compares experimental and theoretical results on changes in the average moisture content of the sample. The experimental conditions of the model validation were as follows: an initial moisture content of 4.391 kg of water per kg of dry basis, a drying temperature of 42°C, a relative humidity of 20% and an air velocity of 3m/s. The theoretical results agreed reasonably well with the respective experimental results. The relative error from experimental and calculated values is weak and it is equal to 6.35 10-4.
Simulation
Before using the model as a tool for optimisation of the process, a validation phase is indispensable. First, the comparison was done with one of the experimental tests: results are entirely satisfactory at all times for length, on the length of the phases and changes in temperature. In what follows, we are going to present some results of our model (Temperature distribution, moisture content profiles and stresses) and to discuss the influence of some parameters on the drying kinetics, in particular temperature, relative humidity, convective exchange coefficient and thickness of the sample.
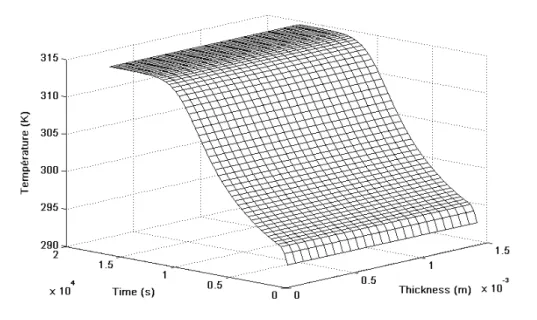
Temperature Distribution
Profiles for simulated temperature of the product are flat (Figure 5), which is logical considering the thickness of the sample. In fact, the temperature begins to really increase when the shrinkage undergone by the material lessens. It attends its equilibrium value (corresponding to the hot air drying temperature) after 3h 30 min of the drying process.
Moisture Content Profiles
Profiles for moisture content have a parabolic shape before flattening at the end of drying (Fig. 6). The sample surface in direct contact to the heated air quickly reaches the equilibrium therefore a moisture gradient is developed between the surface and the rest of the sample. The moisture content decreases until it reaches a constant value in the entire sample that correspond to its equilibrium moisture. We also notice that shrinkage of the product is shown by the change in the thickness of the sample. The material is highly deformable: the final thickness of the sample (initially equal to 10 mm) is close to 1.5mm.
Stress
Normal stress in the material is shown at time intervals of 15 minutes as a function of sample thickness presented in logarithmic-scale (Fig. 7). Practically all the material is submitted to compression forces during drying. The stress near the lower surface of the sample is positive (traction
forces), this is due to the hypothesis that we took into account (no displacement for the lower surface, whatever the time). The maximum stress occurs on the upper surface but in the end of the process, high stresses are developed in the lower surface. This phenomenon is explained by the fact that the upper surface reaches the equilibrium and the other is not yet.
The stress evolution in the other directions is practically on the same order because the value of Poisson's ratio, which is very close to 0.5 (ν=0.492). The stress has the tendency to return to its equilibrium value after 2h 30min of drying.
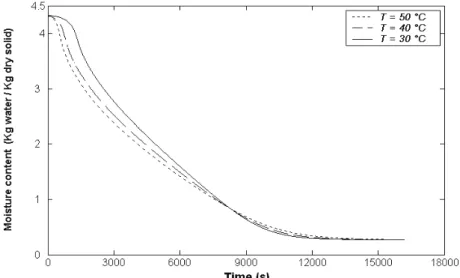
Effect of Air Ttemperature
Theoretically, an increase in drying temperature can influence the drying kinetics that can cause a decrease in the total time of operation. We can observe Fig. 8; there is little difference between the total drying times for three different temperatures (we work under reasonably low temperatures for food products).
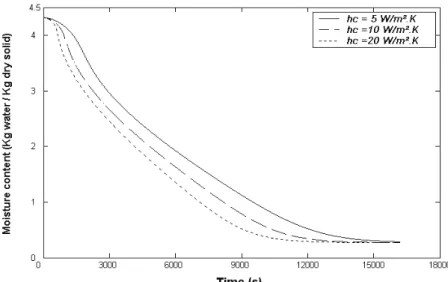
Effect of Convective Exchange Coefficient
The convective exchange coefficient is directly related to the air flow velocity by the Reynolds number (eq. 10). An increase in air velocity directly influences this coefficient and accelerates the drying process (Fig. 9). This can be explained by the fact that the air flow is responsible for decreasing humidity; while increasing this velocity this favours the transport phenomenon.
Figure 6: Moisture content profiles at time intervals of 15 minutes.
Figure 7: Normal stress range at time intervals of 15 minutes.
Figure 9: Simulation of the effect of relative humidity on water loss during drying
Effect of Relative Humidity
The effect of variation in relative humidity is more visible than that of variation in temperature (Fig. 10). This is can be explained through eq. 9. The diminution in relative humidity increases the difference
(
Pv,surf −Pv,a)
and betters the evaporating mass flow.The reduction in the characteristic humidity of drying air has a positive effect while controlling and decreasing the total required operation time.
Effect of Initial Thickness
It is clear that thickness of the sample directly influences total drying time. Indeed, while observing Fig. 11 and for a thickness of 10 mm, the time of drying is three and one half hours. For a thinner sample (5 mm only), this time does not exceed one hour. In the opposite direction and for a thickness of 20 mm, it is apparent that the operation of drying requires a longer time, which can surpass 12 hours.
Figure 11: Simulation of the effect of thickness on water loss during drying
CONCLUSIONS
Theoretical modelling of the process of drying biological products with high moisture contents, using the simultaneous heat and mass transfer expressions, are presented. We used a model that takes into account volume shrinkage. The model is also valuables for the optimisation of the process under constraints of time and quality. We note that the parameters drying air velocity and relative humidity have the most important role to reduce the total drying time.
This model helps to foresee that similar analyses of other homogeneous food products with high moisture contents, which have reasonably regular shapes, will provide enough accurate information on the drying process and characteristic parameters.
NOMENCLATURE
D moisture diffusivity (m²/s) hc convective heat transfer
coefficient
(W/m² K) K thermal conductivity (W/m K)
Lv latent heat (J/kg)
m air mass flow (kg/s)
Mv molar mass of the pure water (g/mol) Pv,a vapour pressure in the
ambient medium
(Pa) Pv,surf vapour pressure at the
product surface
(Pa)
R ideal gas constant (-)
T temperature (K)
Ta ambient temperature (K)
u displacement (m)
Vair drying air velocity (m/s)
vl liquid-phase velocity (m/s) vs solid-phase displacement
velocity
(m/s) X moisture content (kg of water
/ kg of dry solid) β contraction coefficient of the
material during drying
(-)
εij strain range (-)
ν Poisson’s ratio (-)
ρl density of the liquid (kg/m 3)
ρs apparent density of the solid (kg/m 3)
σij stress ranged (Pa)
REFERENCES
Belahmidi, E., Belghit, A., Mrani, A. and Kaoua, M., Experimental Approach of the Kinetics of Agro Alimentary Product Drying - Application to the Oranges Skins and the Beet Pulp, Revue Générale de la Thermique, N°380-381, pp. 444-453 (1993). Chemkhi, S., Mihoubi, D., Zagrouba, F. and Bellagi,
A., A Numerical Model that Accounts for the Coupling of the Heat and Mass Transfer and the Rheological Behaviour of a Viscoelastic Material, 15th International Congress of Chemical and Process Engineering, Prague, Czech Republic, 25-29 August (2002).
Finney, E.E., The Viscoelastic Behavior of the Potato Solanum Tuberson under Quasistatic Loading, Ph.D. diss., Michigan State University (1963).
Itaya, Y., Deformation Behaviour of Ceramic Slabs by Non Uniform Drying, Drying Technology, Vol. 13, No. 3, pp. 801-819 (1995).
Iyota, H., Nishimura, N. Onuma, T., Nomura, T., Drying of sliced Raw Potatoes in Superheated Steam and Hot Air, Drying Technology, Vol. 19, No. 7, pp. 1411-1424 (2001).
Jomaa, W., Drying of High Shrinkable Materials Taking in Account the Shrinking Velocity, Ph.D. diss., University of Bordeaux 1 (1991). (in French) Katelaars, A., Drying Deformable Media - Kinetics
Shrinkage and Stresses, Ph.D. diss., Technische Universiteit Eindhoven (1992).
Kechaou, N., High Deformable Gels Drying - Study of the Internal Diffusion of Water and Modelling, Ph.D. diss., Institut Nat. Polytechnique de Lorraine, France (1989). (in French)
Kechaou, N. and Roques, M., A Variable Diffusivity Model of Drying on Highly Deformable Materials, in Drying '89, Eds. A. S. Mujumdar and M. Roques, Hemisphere Publ. Co., New York, pp. 332-338 (1990). Kiranoudis, C.T., Maroulis, Z.B. and Marinos
Kouris, D., Heat and Mass Transfer Model Building in Drying with Multiresponse Data, Int. J. Heat Transfer, Vol 38, pp. 463-480 (1995). Kompany, E., Benchimol, J., Allaf, K., Ainseba, B.
and Bouvier, J.M., Carrot Dehydration for Instant Rehydration - Dehydration Kinetics and Modelling, Drying Technology, Vol. 11, No. 3, pp. 451-470 (1993).
Kowalski, S.J., Thermomechanical Approach to
Shrinking and Cracking Pphenomena in Drying, Drying Technology, Vol. 19, No. 5, pp. 731-765 (2001).
Luikov, A.V., Heat and Mass Transfer in Capillary Porous Body, Pergamon Press, Oxford (1966). Navarri P., Study on the Drying by Infrared
Radiance – An Application to a Capillary Porous Product and an Enduction, Ph.D. diss., University Claude Bernard Lyon I (1992). (in French) Pinheiro P.C.C., Raad, T.J., Yoshida, M.I., Model of
a Process for Drying Eucalyptus ssp at High Temperatures, Brazilian Journal of Chemical Engineering, Vol. 15, N. 4, Sao Paulo, Dec (1998). Sherwood, T.K., The Drying of Solids, Ind. Ing.
Chem., 21, 1, pp. 12-16 (1929).
Sieder, G.D. and Tate, C.E., Heat Transfer and Pressure Drop of Liquids in Tubes, Ind. Eng. Chem., Vol. 28, p. 1429 (1936).
Wang, N. and Brennan, J.G, Thermal Conductivity of Potato as a Function of Moisture Content, J. Food Eng., 17, pp. 153-160 (1992).
Wang, N. and Brennan, J.G, The Influence of Moisture Content and Temperature on the Specific Heat of Potato Measured by Differential Scanning Calorimeter, J. Food Eng., 19, pp. 303-310 (1993).
Yang, H., Sakai, N. and Watanabe, M., Drying Model with Non-Isotropic Shrinkage Deformation Undergoing Simultaneous Heat and Mass Transfer, Drying Technology, Vol. 19, No. 7, pp. 1441-1460 (2001).
APPENDIX 1: PHYSICAL PROPERTIES OF FRESH POTATO
Property, Reference and Formula or Value
Density (ρ): Chemkhi and al., 2002
-3
s s
ρ ρ
=
(1 1.343 X)
+
ρ
=
1395 kg m
Equilibrium moisture content using the GAB model (Xe): Chemkhi and al., 2002
m w
e
w w
X C K A X
(1 K A )( K A C K A )
= − − +
w m
X 0.209 For T from 40 to 50 C K 0.976
C 4.416 = ° = =
Moisture diffusion coefficient (D): Kiranoudis and al, 1995
-6
b c
D a exp( ) exp( )
X T
a 1.29 10 , b 0.0725 , c 2044
= − −
= = =
Poisson’s ratio (ν): Finney, 1963 ν=0.492
Shrinkage coefficient (β): Chemkhi and al., 2002 β=1.343
Specific heat (Cp): Wang and Brennan, 1993
2
Cp=4184 (0.406 0.00146 T+ +0.203 X 0.0249 X )−
Thermal conductivity (K): Wang and Brennan, 1992
2 4
K=1.05 1.69 10 T 1.9 10 T− − + − 2 Young modulus (E): Yang et al., 2001
5 5
E 1.691 10 exp( 0.522W) at W 1 E 5.23 10 exp( 1.704W) at W 1
= − >