Rev. Col. Bras. Cir. vol.43 número6
Texto
Imagem
Documentos relacionados
Objective: To determine the clinical usefulness of prostate-specific antigen (PSA) density in the transition zone (PSADTZ) for increasing the specificity in early detection of
Objective: Determine how serum prostate-specific antigen (t-PSA) levels and free PSA (f/t PSA) ratio change following transurethral resection of the prostate (TURP).. Materials
Also, baseline prostate specific antigen (PSA), prostate volume, creatinine, International Prostatic Symptom Score (IPSS), IPSS-Quality of Life (IPSS-QoL), maximal urinary flow
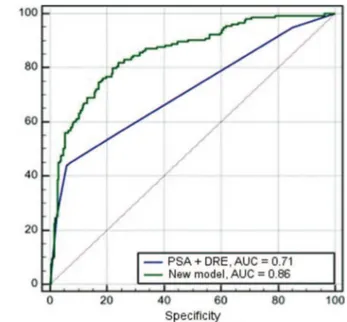
Various variables may influence the cancer detection rates and diagnostic yield of prostate biop- sies such as; patient age and race, serum PSA level, prostate volume, biopsy
16 also did not found significant differences between the polypropylene and the polypropylene with poliglecaprone meshes when they studied adhesion formation and incorporation
Foram estudados idade, sexo, procedência, es- tado nutricional, cirurgia prévia, duração dos sintomas à admissão, do estado febril, da estadia hospitalar e do tempo de
We studied age, gender, origin, nutritional status, previous surgery, duration of symptoms until admission, fever, hospital stay, time of thoracic drainage, macroscopic appearance
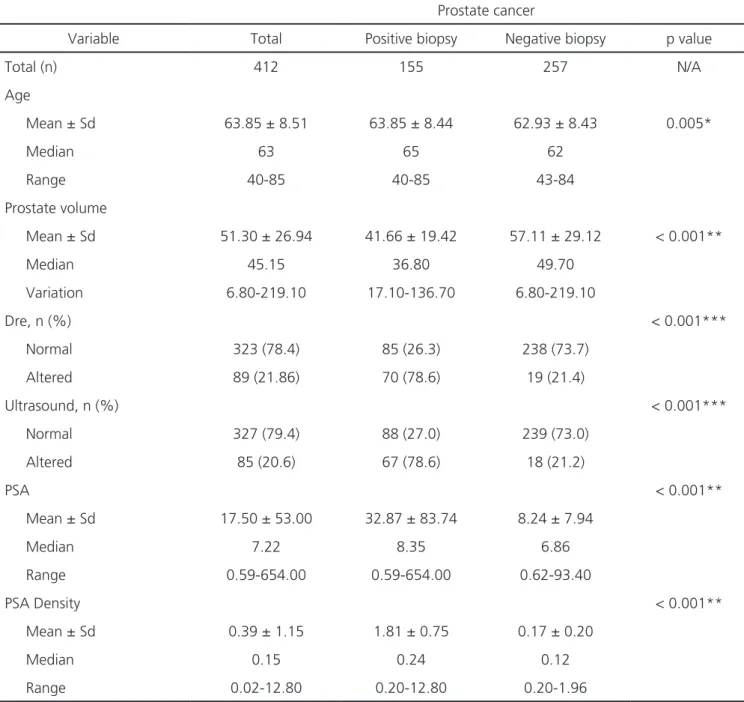
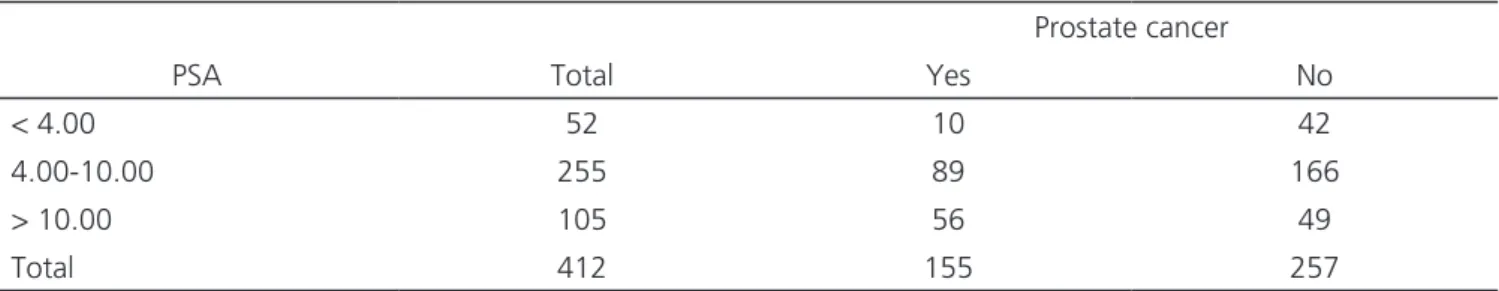
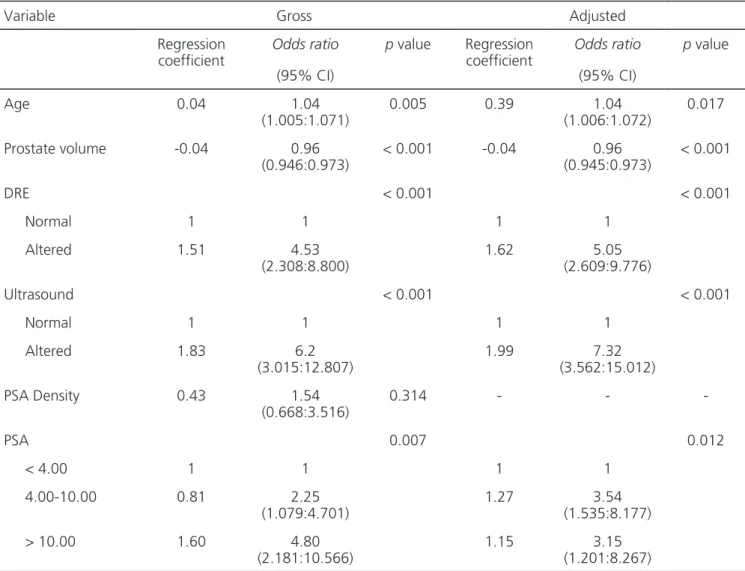
Foram incluí- dos na amostra pacientes maiores que 40 anos de idade com as sete variáveis em consideração (idade, toque re- tal, PSA, volume prostático, densidade de PSA, ultrassom
