A new spectrophotometric method to detect residual
amounts of peroxide after reprocessing hemodialysis filters
Um novo método espectrofotométrico para detectar níveis residuais de peróxido após o
reprocessamento de filtros de hemodiálise
Moacir de Oliveira1, Maria Aparecida Dalboni2, Ilson Jorge Iizuka1, Silvia Regina Manfredi2, Nadia Karina Guimarães1, Maria Claudia Cruz Andreoli1, Ana Cristina Carvalho Matos1, Marcelo Costa Batista1, Bento Fortunato Cardoso
Santos1, Miguel Cendoroglo Neto3
ABSTRACT
Objective: Reuse of hemodialysis filters is a standard practice and
the sterilizing chemical most often employed is peracetic acid. Before starting the dialysis session, filters and lines are checked for residual levels of peracetic acid by means of a non-quantitative colorimetric test that is visually interpreted. The objective of this study was to investigate a new quantitative spectrophotometric test for detection of peracetic acid residues. Methods: Peracetic acid solutions were prepared in concentrations ranging from 0.01 to 10 ppm. A reagent (potassium-titanium oxide + sulfuric acid) was added to each sample in proportions varying from 0.08 to 2.00 drops/mL of solution. Optical densities were determined in a spectrophotometer using a 405-nm filter and subjected to visual qualitative test by different observers.
Results: A relation between peroxide concentrations and respective
optical densities was observed and it was linear with R2 > 0.90 for
all reagent/substrate proportions. The peak optical densities were obtained with the reagent/substrate ratio of 0.33 drops/mL, which was later standardized for all further experiments. Both qualitative and quantitative tests yielded a specificity of 100%. The quantitative test was more sensitive than the qualitative test and resulted in higher positive and negative predictive values. There was a difference between observers in the qualitative test and some samples with significant amounts of peroxide were not detected. Conclusion: A quantitative spectrophotometric test may improve detection of residues of peracetic acid when compared to the standard visual qualitative test. This innovation may contribute to the development of safer standards for reuse of hemodialysis filters.
Keywords: Renal dialysis/instrumentation; Renal dialysis/methods;
Peracetic acid; Spectrophotometry /methods; Peroxides
RESUMO
Objetivo: A reutilização de filtros de hemodiálise é uma prática disseminada e a substância química esterilizante mais empregada é o ácido peracético. Antes de iniciar a sessão de diálise, os filtros e as linhas são verificados em relação a níveis residuais de ácido peracético por meio de teste colorimétrico não quantitativo, com interpretação visual. O objetivo deste trabalho foi investigar um novo teste espectrofotométrico quantitativo para detecção de resíduos de ácido peracético. Métodos: As soluções de ácido peracético foram preparadas em concentrações que variam de 0,01 a 10 ppm. O reagente (óxido de potássio-titânio + ácido sulfúrico) foi acrescentado a cada amostra em proporções que variaram de 0,08 a 2,00 gotas/mL de solução. As densidades ópticas foram determinadas em um espectrofotômetro com filtro de 405 nm e submetidas a um teste visual qualitativo por diferentes observadores. Resultados: Observou-se a relação linear entre as concentrações de peróxido e as respectivas densidades ópticas com R2 > 0,90 para todas proporções de reagente/
substrato. As maiores densidades ópticas foram obtidas com a proporção reagente/substrato de 0,33 gotas/mL, que foi padronizada para todos os experimentos posteriores. Os testes qualitativo e quantitativo apresentaram especificidade de 100%. O teste quantitativo foi mais sensível do que o qualitativo e apresentou maiores valores preditivos positivo e negativo. Houve uma diferença entre os observadores no teste qualitativo e algumas amostras com quantidade significativa de peróxido não foram detectadas.
Conclusão: O teste espectrofotométrico quantitativo pode melhorar a
detecção de resíduos de ácido peracético em comparação ao teste visual qualitativo padrão. Essa inovação pode contribuir para o desenvolvimento de padrões mais seguros na reutilização de filtros de hemodiálise.
Descritores: Diálise renal/instrumentação; Diálise renal/métodos;
Ácido peracético; Espectrofotometria/métodos; Peróxidos
Study carried out at Laboratório de Uremia da Universidade Federal de São Paulo – UNIFESP, São Paulo (SP), Brazil.
1 Discipline of Nephrology, Universidade Federal de São Paulo – UNIFESP, São Paulo (SP), Brasil; Dialysis Center, Hospital Israelita Albert Einstein – HIAE, São Paulo (SP), Brazil. 2 Discipline of Nephrology, Universidade Federal de São Paulo – UNIFESP, São Paulo (SP), Brazil.
3 Discipline of Nephrologiy, Universidade Federal de São Paulo – UNIFESP, São Paulo (SP), Brazil; Dialysis Center, Hospital Israelita Albert Einstein – HIAE, São Paulo (SP), Brazil; Division of Nephrology of
Tufts University School of Medicine – Boston, USA.
Corresponding author:Moacir Oliveira – Avenida Albert Einstein, 627 – Morumbi – CEP 05651-901 – São Paulo (SP), Brazil - Tel.: 11 2151-1233 - e-mail: [email protected]
Received on Dec 13, 2010 – Accepted on Feb 8, 2011
INTRODUCTION
Hemodialysis (HD) is a relatively safe procedure but several complications may occur due to side effects related to normal extracorporeal circuit, technical errors, or to abnormal reactions of patients to the procedure(1,2).
From inception, maintenance HD therapy has been a challenge because of its many bioincompatible components. Besides complement activation by the HD membrane, water contaminants and residues of sterilizing agents may also have an impact in the internal milieu(1-4).
Reuse of HD filters is a common practice in Brazil and in the United States(5). Major advantages of this
practice include cost reduction and a decrease in the incidence of first use syndrome(6-9). Major disadvantages
include exposure of the internal milieu to germicides, risk of pyrogenic reactions and infections, reduced efficiency of the dialyzers, and possibly increased oxidative stress(8-14). In accordance with the Association
for the Advancement of Medical Instrumentation (AAMI) and the Centers for Disease Control and Prevention (CDC), peracetic acid (PA) is currently the most frequently used sterilizer for reprocessing of dialyzers(15). Standards for reuse of dialyzers have
been set by these agencies. The basic procedure for dialyzer reprocessing comprises four steps: rinsing, cleaning, performance testing, and disinfection and sterilization(8,9) Before starting a new dialysis session,
the clinical staff must assure that no residue of PA is present within the HD filter and its lines. Indeed, the presence of very small amounts of PA can induce a strong host response with severe respiratory distress and hypotension(10). In Brazil, similar rules are
enforced by the National Health Surveillance Agency (ANVISA), which is the regulatory agency(16).
The current technique to address presence of residual amounts of peroxide and PA in HD filter and lines is a non-quantitative colorimetric assay. This test is performed by adding a titanium-salt-based reagent to a sample of the saline remaining in the HD system after rinsing. A concentration of peroxide of at least one part per million (ppm) yields a light yellow color to the sample in the test tube. One major pitfall of this method is that it depends on the observer. Moreover, there is no evidence that smaller concentrations of peroxide, inferior to 1 ppm, may not be harmful for the patient.
In order to improve safety of this procedure, we developed a quantitative test including a spectrophotometric reading of this reaction. To that end, the ideal concentration ratio was established between reagent and substrate, sensitivity and specificity of the
test were determined, and sensitivity and specificity of the qualitative visual test were compared to the new quantitative spectrophotometric test.
METHODS
Sterilizing agent and test reagent
Proxitane® (Fresenius Medical Care, Frankfurt,
Germany) was the sterilizing solution used in all reuses and tests performed in this study. It consists of an aqueous solution of PA at 2%, hydrogen peroxide at 6.3%, acetic acid at 19% and stabilizers. All tests were prepared by adding Proxitane® to a saline
solution.
For the visual detection of PA, Allper™ reagent (Peróxidos do Brasil, Curitiba, Paraná, Brazil) was used and it consists of water solution of a titanium salt (C4K2O9Ti) and sulfuric acid. After reacting with peroxide, it yields a light yellow color. According to the supplier, this test enables detection of concentrations of peroxide above 1 ppm.
An initial Proxitane® solution, with 2,000 ppm
peroxide, was made as a base for all other test solutions. Serial dilutions were made into 15-mL translucid tubes. Allper™ reagent was added and color development was attained after less than 5 minutes and was stable for at least 12 hours.
Standardizing the reagent to substrate proportion
According to the supplier, one drop of Allper™ reagent should be added to each 3 mL of substrate (0.33 drop per mL) in order to allow detection of concentrations of peroxide as low as 1 ppm.
In order to determine the best reagent/substrate (R/S) proportion for the different concentrations of peroxide tested in this study, PA solutions with concentrations of 0.01, 0.1, 0.5, 1, 5 and 10 ppm were prepared in 15 mL tubes, with 3, 6, 9 and 12 mL of these solutions. To the test tubes, 1, 3 and 6 drops of the Allper™ reagent were added to obtain the proportions of 0.08, 0.11, 0.17, 0.25, 0.33, 0.5, 1 and 2 drops of Allper™ reagent per milliliter of peroxide solution at each study concentrations. In the end, there was a matrix of test tubes with six different concentrations of peroxide (0.01 to 10 ppm) and eight R/S proportions (0.08 to 2 drops/mL).
Qualitative visual test
Israelita Albert Einstein (HIAE), 6 working at the Fundação Oswaldo Ramos (FOR) Dialysis Center and 6 from the FOR Research Laboratory. They were asked to identify the samples presenting with a yellow color. The study was approved by the Internal Review Board at UNIFESP.
Quantitative spectrophotometric test
After color development, aliquots of 300 µl were transferred to 96-well polystyrene plaques. Optical densities (OD) were quantified by a spectrophotometer (ASYS Hitech GmbH, Engendorf, Austria) with a 405-nm filter.
Statistical analysis
The software True Epistat (Tracy L Gustaffson, Richardson, Texas, USA) was used to carry out the statistical analysis of data. Continuous variables were expressed as mean ± standard deviation. Student’s t
test was used to compare continuous data and χ2 test to
compare categorical data.
Sensitivity, specificity, positive and negative predictive values were determined for the qualitative test (visual detection) and the quantitative colorimetric assay. Spearman coefficient was used for correlation analyses.
The level of statistical significance was 5% (p < 0.05).
RESULTS
Within the range of 0.01 to 1 ppm of peroxide
concentration, correlations between peroxide
concentration and OD were always linear, with R2 >
0.90 (Table 1).
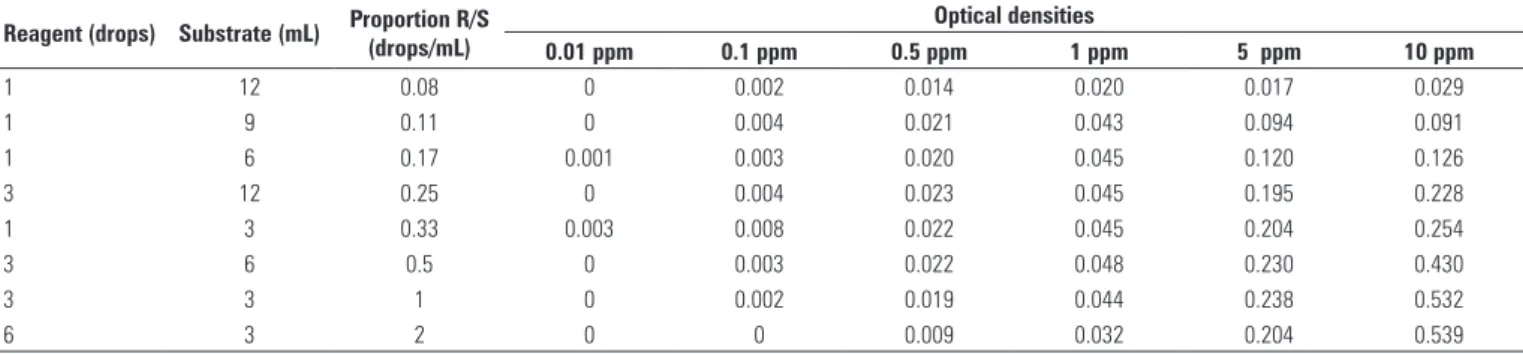
Sensitivity of the quantitative method was analyzed according to the R/S proportion (Table 2). It was observed that for concentrations lower than 0.5 ppm, OD yielded the highest values for R/S of 0.33 drops/mL
(1 drop to each 3 mL of substrate). For concentrations of 0.1 and 0.5 ppm, OD increased as the R/S rose from 0.08 drops/mL to 0.33 drops/mL, and then decreased with higher R/S (0.5 to 2 drops/mL). Analyzing the concentration of 5 ppm of peroxide, there was no increase in OD with R/S above 0.33 drops/mL. For the concentration of peroxide of 10 ppm, the OD continued to increase until the highest R/S (2 drops/ mL) was reached (Table 2).
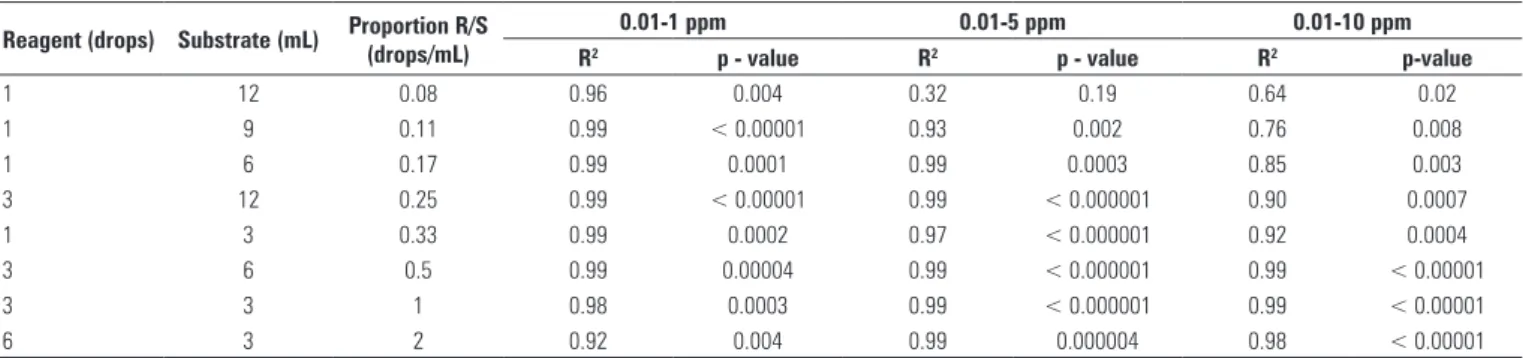
When the ratio R/S of 1 drop to 3 mL was used, correlations between OD and peroxide concentration yielded R2 > 0.99, 0.97 and 0.92, respectively, for the
OD ranges of 0.01 to 1 ppm; 0.01 to 5 ppm and 0.01 to 10 ppm (p = 0.0002, p < 0.00001 and p = 0.0004). After these results it was decided to standardize the R/S of 0.33 drops/mL for all further tests.
For the visual test, 18 individuals, 6 laboratory personnel and 12 dialysis staff members were recruited. Concentrations ranging from 0.01 to 1 ppm were tested and their results were compared with those of the quantitative test (Table 3). Moreover, both groups of volunteers were compared (Table 4).
Comparing the quantitative test with the visual colorimetric test and calculating the positive and negative predictive values, as well as sensitivity and specificity of both techniques (Table 3), it was observed that both tests yielded a specificity of 100%. Sensitivity, however, was higher for the quantitative test in all concentrations considered.
The quantitative test also yielded higher positive predictive value and negative predictive value when compared to the visual test.
Both groups of observers were submitted to comparison. The sensitivity rate of the test was similar between the groups (100%) for the highest concentration of peroxide (1 ppm). It decreased with lower concentrations of peroxide and was different between the groups for concentrations of 0.5 and 0.1 ppm. It was similar between the groups and very low (5%) at the concentration of 0.01 ppm of peroxide (Table 4).
Table 1. Correlations between concentrations of peroxide and optical densities for the different proportions of reagent/substrate. Analyses were performed considering three different ranges of peroxide concentration: 0.01 to 1 ppm, 0.01 to 5 ppm e 0.01 to 10 ppm (n = 18)
Reagent (drops) Substrate (mL) Proportion R/S (drops/mL)
0.01-1 ppm 0.01-5 ppm 0.01-10 ppm
R2 p - value R2 p - value R2 p-value
1 12 0.08 0.96 0.004 0.32 0.19 0.64 0.02
1 9 0.11 0.99 < 0.00001 0.93 0.002 0.76 0.008
1 6 0.17 0.99 0.0001 0.99 0.0003 0.85 0.003
3 12 0.25 0.99 < 0.00001 0.99 < 0.000001 0.90 0.0007
1 3 0.33 0.99 0.0002 0.97 < 0.000001 0.92 0.0004
3 6 0.5 0.99 0.00004 0.99 < 0.000001 0.99 < 0.00001 3 3 1 0.98 0.0003 0.99 < 0.000001 0.99 < 0.00001
6 3 2 0.92 0.004 0.99 0.000004 0.98 < 0.00001
DISCUSSION
In this study it was found that the quantitative test could increase patient’s safety in the reuse process of HD filters after performing quantitative test with the visual colorimetric test and calculating the positive and negative predictive values, sensitivity and specificity.
Reuse of HD filters is a common practice in Brazil, Unites States and other countries. An ANVISA ruling, RDC N.° 154, provides and regulates the good practices of reuse of dialysis filters(16). It states that dialysis filters
must be submitted to rinsing after disinfection and an appropriate test is performed in order to make sure that there is no residual amount of the disinfecting agent after rinsing. However, it does not specify
the disinfecting agent, or the routine of rinsing and testing, and each dialysis unit has to establish its own routines.
The lack of evidence-based routines and protocols in the literature prompted us to study the efficacy of current tests for the detection of peroxide after reprocessing with PA. In the beginning of the study, an important limitation was observed, that is, absence of a gold-standard quantitative test to detect PA residues. Therefore, it was decided to develop and standardize a quantitative, spectrophotometric test, and that became the first goal of this study. The new quantitative test showed to be superior to the standard visual test with respect to sensitivity and positive predictive value. In other words, the quantitative test was safer than the standard visual test. The details of these results merit some discussion and interpretation.
First, it was observed that there was a linear and strong correlation between optical densities in spectrophotometry and peroxide concentration, with a detectable reaction for concentrations as low as 0.001 ppm. Then, the optimal ratio between reagent and
Table 2. Optical densities obtained with different reagent/substrate proportions (0.08 to 2 drops/mL) at different concentrations of peroxide (0.01; 0.5; 1; 5 and 10 ppm) (n = 18)
Reagent (drops) Substrate (mL) Proportion R/S (drops/mL)
Optical densities
0.01 ppm 0.1 ppm 0.5 ppm 1 ppm 5 ppm 10 ppm
1 12 0.08 0 0.002 0.014 0.020 0.017 0.029
1 9 0.11 0 0.004 0.021 0.043 0.094 0.091
1 6 0.17 0.001 0.003 0.020 0.045 0.120 0.126
3 12 0.25 0 0.004 0.023 0.045 0.195 0.228
1 3 0.33 0.003 0.008 0.022 0.045 0.204 0.254
3 6 0.5 0 0.003 0.022 0.048 0.230 0.430
3 3 1 0 0.002 0.019 0.044 0.238 0.532
6 3 2 0 0 0.009 0.032 0.204 0.539
R/S: reagent/substrate; ppm: parts per million.
Table 3: Positive predictive value, negative predictive value, sensitivity and specificity for the different observers in the visual test and the quantitative test (n = 18)
PPV (%) NPV (%) Sensitivity (%) Specificity (%)
Laboratory personnel (n = 6)
0.01 ppm 5 47 5 100
0.1 ppm 0 100 0 100
0.5 ppm 78 22 78 100
1 ppm 100 0 100 100
Dialysis staff (n = 12)
0.01 ppm 5 47 5 100
0.1 ppm 11 88 11 100
0.5 ppm 44 56 44 100
1 ppm 100 0 100 100
Quantitative test
0.01 ppm 88 12 88 100
0.1 ppm 100 100 100 100
0.5 ppm 100 100 100 100
1 ppm 100 100 100 100
PPV: positive predictive value; NPV: negative predictive value; ppm: parts per million.
Table 4. Sensitivity rates with the visual test taken by laboratory personnel (n = 6) and dialysis staff (n = 12) for different concentrations of peroxide (0.01 to 1 ppm)
Concentration (ppm) Laboratory personnel (%) Dialysis staff (%) p-value
0.01 5 5 1
0.1 0 11 < 0.0001
0.5 78 44 0.01
substrate was determined and the ideal proportion was 0.33 drops/mL. It was decided to measure the reagent in drops since this is the current standard for nursing practitioners in dialysis units in Brazil.
Compared with the standard visual method, the quantitative method yielded higher positive predictive value, lower negative predictive value and higher sensitivity. A great variability of results was also found between the different observers in the visual test, which could be due to subjectivity of the visual test as well as to the lower detection threshold of the visual test compared to the quantitative test.
The present results suggest that the quantitative test could increase patient’s safety in the reuse process. Indeed, severe hypersensitivity reactions to PA were described after reprocessing of HD filters with peroxide, which may manifest as dizziness, headache, nausea, bronchospasm and even death(8,9,17).
On the other hand, it is possible that small amounts of peroxide residue could go unnoticed in the beginning of the dialysis session, yielding no symptoms. While not impacting the patients’ comfort during HD, this should be of concern because it is well known that HD patients have evidence of increased oxidative stress. Oxidative stress in such patients was ascribed mostly to chronic inflammation. However, the role of direct injections of small amounts of peroxide after inappropriate rinsing of reused filters is yet to be ruled out. The likelihood of this hypothesis is heightened when one considers that, in Brazil, HD patients are usually subjected to 13 sessions per month, from which, up to 12 (according to RDC N.° 54) are performed with reused filters(18-20).
Currently, when zero tolerance and absolute compliance to good practices in prevention of nosocomial infections are being discussed by the CDC and the World Health Organization (WHO), the dialysis community should probably be more and more intolerant to the possible presence of residues of toxic compounds in dialysis filters. This study offers a new, effective and reliable technology to increase patients’ safety during the process of reuse in HD. As far as feasibility is concerned, the new quantitative test requires a spectrophotometer at the bedside. While this is not a complicated technology, the regular spectrophotometers are expensive and require some skills and specific filters that are changed according to the wavelength of interest. However, it is possible that a point of care spectrophotometer with a fixed filter could be shown to be relatively cheap, safe and cost-effective.
REFERENCES
1. Vanholder R. Relationship between biocompatibility and neutrophil function in hemodialysis patients. Adv Ren Replace Ther. 1996;3(4):312-4.
2. Cohen G, Haag-Weber M, Hörl WH. Immune dysfunction in uremia. Kidney Int Suppl. 1997;62:S79-82.
3. Feldman HI, Bilker WB, Hackett M, Simmons CW, Holmes JH, Pauly MV, et al. Association of dialyzer reuse and hospitalization rates among hemodialysis patients in the US. Am J Nephrol. 1999;19(6):641-8.
4. Held PJ, Wolfe RA, Gaylin DS, Port FK, Levin NW, Turenne MN. Analysis of the association of dialyzer reuse practices and patient outcomes. Am J Kidney Dis. 1994;23(5):692-708.
5. Finelli L, Miller JT, Tokars JI, Alter MJ, Arduino MJ. National surveillance of dialysis-associated diseases in the United States, 2002. Semin Dial. 2005;18(1):52-61.
6. Vinhas J, Pinto dos Santos J. Haemodialyser reuse: facts and fiction. Nephrol Dial Transplant. 2000;15(1):5-8.
7. Robinson BM, Feldman HI. Dialyzer reuse and patient outcomes: what do we know now? Semin Dial. 2005;18(3):175-9.
8. Maidment HJ, Petersen J. The dialysis prescription: reuse. Am J Nephrol. 1996;16(1):52-9.
9. Miles AM, Friedman EA. A review of hemodialyzer reuse. Semin Dial. 1997;10(1):32-7.
10. Twardowski ZJ. Dialyzer reuse--part II: advantages and disadvantages. Semin Dial. 2006;19(3):217-26.
11. Lacson E Jr, Lazarus JM. Dialyzer best practice: single use or reuse? Semin Dial. 2006;19(2) :120-8.
12. Rao M, Guo D, Jaber BL, Sundaram S, Cendoroglo M, King AJ, Pereira BJ, Balakrishnan VS; HEMO Study Group. Dialyzer membrane type and reuse practice influence polymorphonuclear leukocyte function in hemodialysis patients. Kidney Int. 2004;65(2):682-91.
13. Feldman HI, Kinosian M, Bilker WB, Simmons C, Holmes JH, Pauly MV, et al. Effect of dialyzer reuse on survival of patients treated with hemodialysis. JAMA. 1996;276(8):620-5.
14. Jaar BG, Hermann JA, Furth SL, Briggs W, Powe NR. Septicemia in diabetic hemodialysis patients: comparison of incidence, risk factors, and mortality with nondiabetic hemodialysis patients. Am J Kidney Dis. 2000;35(2): 282-92.
15. Association for Advancement of Medical Information (AAMI). Standards and recommended practices for reuse of hemodialyzers. AAMI. ANSI/AAMI RD 47, 2005.
16. Agência Nacional de Vigilância Sanitária (ANVISA) [Internet]. Resolução da Diretoria Colegiada - RDC N.º 154, de 15 de junho de 2004. Estabelece o Regulamento Técnico para o Funcionamento de Serviços de Diálise. Publicada em 31 de maio de 2006 [citado 2011 Mar 9]. Disponível em: http://www. adreterj.org.br/rdc_154.pdf
17. Centers for Disease Control (CDC). Acute allergic reactions associated with reprocessed hemodialyzers--Virginia, 1989. MMWR Morb Mortal Wkly Rep. 1989;38(50):873-4.
18. Trznadel K, Luciak M, Pawlicki L, Kedziora J, Blaszczyk J, Buczyński A. Superoxide anion generation and lipid peroxidation processes during hemodialysis with reused cuprophan dialyzers. Free Radic Biol Med. 1990;8(5):429-32. 19. Köse K, Doğan P, Gündüz Z, Düşünsel R, Utaş C. Oxidative stress in
hemodialyzed patients and the long-term effects of dialyzer reuse practice. Clin Biochem. 1997;30(8):601-6.