v. 11 n. 2, 2007ISSN 1809-9246 Six-minute walk test, age and BMI 131 Rev. bras. fisioter., São Carlos, v. 11, n. 2, p. 131-134, Mar./Apr. 2007
©Revista Brasileira de Fisioterapia
SIX-MINUTE WALK TEST AT DIFFERENT AGES AND BODY MASS
INDEXES
P
IRESSR, O
LIVEIRAAC, P
ARREIRAVF & B
RITTORR
Physical Therapy Department, Federal University of Minas Gerais, Belo Horizonte, MG - Brazil
Corrrespondence to: Raquel Rodrigues Britto, Rua Biagio Polizzi, 176/30, Bairro Silveira, CEP 31140-500, Belo Horizonte, MG – Brasil, e-mail: [email protected]
Receivied: 03/07/2006 - Revised: 29/01/2007 - Accepted: 01/02/2007
ABSTRACT
Introduction: Submaximal tests have been chosen to evaluate functional status because of their practicality and low cost. Objective: To correlate the distance walked during a six-minute test with age and body mass index, and to verify the need for applying a second test. Method: 122 healthy Brazilians aged between 18 and 80 years who had a sedentary lifestyle performed two tests that consisted of walking as far as possible over a six-minute period. Their weights and heights were assessed by calculating the body mass index. The data were expressed as means and standard deviations. The statistical analyses were performed using Student’s t test, ANOVA and Pearson’s correlation. Results: A strong correlation was found between the two distances walked when all the subjects were analyzed without age divisions. When the subjects were divided into three groups according to age, there were significant differences (p< 0.05) between the distances walked by the groups: Group 1 (20 to 40 years)= 645.19 m ± 80.78, Group 2 (40 to 60 years)= 540.68 m ± 59.74 and Group 3 (>60 years)= 457.39 m ± 64.1. The subjects with body mass index <25 walked longer distances (565.45 m ± 101.56) than either those with body mass index >25 and <35 (492.93 m ± 73.18) or those with body mass index >35 (457.35 m ± 92.18). Conclusion: The results found in this study confirm the reproducibility of the six-minute walk test and the sensitivity that this test has for evaluating the performance and functional capacity of individuals with different ages and body mass index.
Key words: six-minute walk test, functional capacity, age, body mass index.
INTRODUCTION
The six-minute walk test (6WT) has been widely used to assess physical capacity in individuals that present poor physical conditioning and cannot perform ergometric test for several reasons1,2. The 6WT is well correlated with VO
2 (peak oxygen consumption); moreover, it is easily administered, better tolerated and better related to daily-living activities than VO2 measures1,2,3. Furthermore, the 6WT is a practical and low-cost means of evaluating the physical capacity of functionally limited individuals and, during the last years, it had been considered as a very important instrument both in clinical practice and research1,2,4,5,6.
The 6WT has the following purposes: evaluating the aerobic capacity for sports and other activities; evaluating the functional status of the cardiovascular and/or respiratory systems in healthy and pathologic conditions; evaluating prevention, therapeutic and rehabilitation programs and predicting morbidity and mortality in transplant candidates7,8.
Some equations have been proposed to predict the expected result of this test, considering variables such as age, body weight, sex and height1,7,9. A Brazilian study1 has assessed the applicability of equations proposed by Enright e Sherrill5 to estimate the distance to be covered during the 6WT performance in a Brazilian sample (with age between 40 and 80 years). This study found, for female subjects, a 510,36 ± 73.27 meters distance predicted by the equation and a 495.19 ± 54.01 meters walked distance, with correlation = 0,29 and p= 0.16 (n= 16). It also found a 571.45 ± 63.68 meters distance predicted by the equation and a 535.83 ± 68.97 meters walked distance, with correlation = 0.65 and p= 0.02, for male subjects. These results indicate the need for Brazilian reference values for this test.
132 Pires SR, Oliveira AC, Parreira VF & Britto RR Rev. bras. fisioter.
Groups Test Mean ± Standard Deviation Correlation(r) p
Group 1 (n= 32) 1 606.31 ± 85.51 0.977 0.006
Young and adults 2 615.77 ± 83.67*
Group 2 (n= 44) 1 447.21 ± 66.82 0.930 0.876
Elderly 2 446.61 ± 67.69
Therefore, the aim of the present study was to evaluate the walking distance covered during the 6-minute walk test and to correlate it to age and body mass index. In addition, the study aimed at verifying the necessity of performing two tests to identify the longest walked distance.
METHODS
Subjects
The sample was composed by 122 subjects, male and female, recruited in a convenience manner. The study was carried out in the Cardiorespiratory Performance Assessment and Research Laboratory of the Physical Therapy Department at the School of Physical Education, Physical Therapy and Occupational Therapy, Federal University of Minas Gerais. The study’s inclusion criteria were: healthy and sedentary subjects with age between 18 and 80 years. Exclusion criteria were: the presence of musculoskeletal and neuromuscular problems which could significantly decrease walking performance; cognitive deficits and behavior disorders; unstable angina or uncontrolled arterial hypertension; severe pulmonary hypertension; recent history of cardiac arrhythmia or myocardial infarction; other significant clinical conditions which could be aggravated by physical effort. This work was approved by the institution’s Ethics in Research Committee by means of the protocol 390/04.
Six-Minute Walk Test
The walking test was carried out according to the American Thoracic Society guidelines4. The necessary instruments were: chronometer (Sport Timer®), measuring tape, pulse oximeter (TuffsatTM, São Paulo, Brazil), cardiac frequency meter (Blitz®, São Paulo, Brazil), sphygmo-manometer (Diasyst®, São Paulo, Brazil).
The tests were performed on a 34-meter outdoor walkway, always by the same examiners, which were previously trained.
The vital signs such as systemic arterial pressure, cardiac frequency, respiratory frequency, level of dyspnea (Borg Scale), and oxygen saturation were measured before, during
and after test performing. The participants were asked to walk along the walkway, from one extreme to another, with their maximum velocity, during the six minutes of the test. Two tests were completed with a minimum interval of 15 minutes. The subjects were allowed to interrupt the test if they had symptoms such as lower limbs pain, tachycardia, or any other discomfort. They used the pulse oximeter during the entire procedure in order to allow the monitoring of the peripheral oxygen saturation. The test would be interrupted if the oxygen saturation reached levels below 88% or if the cardiac frequency reached levels above 90% of the maximum frequency.
Statistical Analysis
The results were analyzed using the statistical package SPSS 11.0. The data are presented as mean (X) and standard deviation (SD). Groups were compared using student’s t-test for independent samples or using ANOVA, followed by Boferroni test. Correlation assessment was made using Pearson correlation coefficient. Statistical significance was assumed when p< 0.05.
RESULTS
Distance 1 x distance 2
All participants were able to complete both tests. Initially, only the greatest distance covered throughout the two tests was registered. This procedure did not allow for comparing the distances accomplished in the different tests for the whole sample. Afterwards, the distances of the two tests were registered for 76 subjects. There was no significant difference between the distance walked during the first test (514.2 ± 108.7) and the distance walked during the second test (517.84 ± 112.2). Although a significant difference was not found, 26 subjects (34%) walked their greatest distance during the first test, 47 subjects (62%) walked their greatest distance during the second test, and 2 subjects (3%) walked the same distance during both tests.
There was a strong (r= 0.97) and significant (p= 0.001) correlation between the two distances.
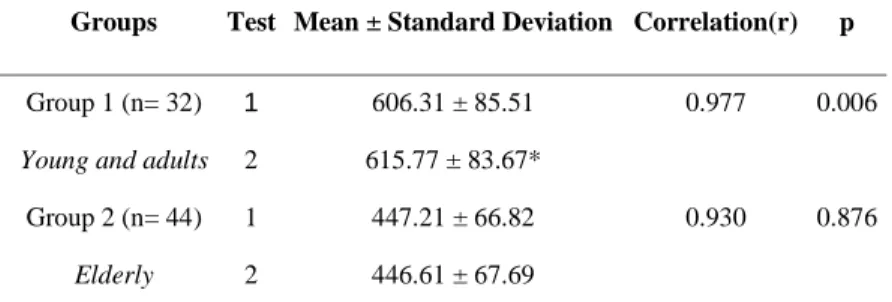
Table 1. Pearson correlation coefficients and significance of the comparisons between the distances walked in two test repetitions, in groups
with different age ranges.
v. 11 n. 2, 2007 Six-minute walk test, age and BMI 133
The subjects were divided into groups 1 (young and adults, n= 32 subjects) and 2 (elderly, n= 44 subjects). When the results were analyzed by group, a significant difference was found. Group 1 presented a significant difference between the distances walked during the 1º and 2º tests (p= 0.006). In contrast, the elderly group did not present a significant difference between these distances (p= 0.876). The correlations found for the group 1 (r= 0.97 e p= 0.001) and for the group 2 (r= 0.93 e p= 0.001) were strong and significant, as shown in Table 1.
Longest distance covered x age
The analysis of the 122 subjects divided by groups (group 1= 20 to 40 years, n= 21; group 2= 40 to 60 years, n= 42; group 3= >60 years, n= 59) demonstrated a significant difference between groups. Figure 1 shows that the distance walked by group 1 (645.19 ± 80.78 meters) was greater (p= 0.001) then the distances walked by groups 2 (540.68 ± 59.74 meters) and 3 (457.39 ± 64.10 meters). The maximum and minimum walked distances were, respectively, 782 meters e 428 meters for group 1, 666 meters e 431 meters for group 2, and 753 meters e 277 meters for group 3.
Longest distance covered x body mass index
The analysis of the height and weight of 119 individuals (three participants were not measured), grouped according to their body mass index (group 1= <25; group 2= >25 and < 35; group 3= >35), demonstrated a significant difference between these groups (p= 0.001). The group 1 presented a mean walked distance of 565.45 meters (SD= 101.56) which was greater than the distances walked by the groups 2 (p= 0.001) and 3 (p= 0.002). The group 2 presented a mean walked distance of 492.93 meters (SD= 73.18) which was not significantly different from the mean walked distance of 457.35 meters (SD= 92.18) presented by group 3, as shown in Figure 2.
DISCUSSION
Even though the sample used was too small to be representative of the Brazilian population, the results of the present study indicate that the 6WT is sensitive enough to identify differences between walking velocity of Brazilian sedentary individuals with different ages and body mass indexes.
Considering the 122 subjects evaluated, the findings suggest that it is not necessary to perform a second test, which is in agreement with the literature4,10, confirming the reproducibility of the six-minute walk test. However, the analysis of the same subjects, grouped in different age ranges, showed that the adult group is different from the elderly group. This finding may be a result of a greater learning effect in the younger group, consequent to its greater exercise tolerance during the second test and, in addition, to the short resting intervals between the tests. This finding demonstrates the sensitivity of the six-minute walk test to assess the performance and functional capacity of different individuals. Troosters and colleagues9 used a between-test interval of two and a half hours and observed greater distance in the second test. Kervio and colleagues11 performed five walking tests at different moments and days in subjects aged between 60-70 years and observed a shorter covered distance in the first two tests and, hence, considering at least two tests for learning to occur. However, the American Thoracic Society guidelines mention that the second test is not always necessary4. In spite of that, other authors suggest the need for the second test9,10,12,13,14. One of the possible reasons for this contradiction is the use of different protocols, with or without incentive, with distinct walkway lengths, and with or without walking accompaniment.
The present study also demonstrated that the older is the individual, the shorter is the covered distance, as other studies had previously demonstrated7,9,10,12. In the work of Troosters and colleagues9 healthy individuals with age between 50 and 85 years performed the six-minute walk test and the results showed the same relationship found by Enright and
Figure 1. Distances walked by groups with different age ranges.
m= meters,*p< 0,05 (ANOVA and Bonferroni).
Figure 2. Distances walked by groups with different body mass indexes.
m= meters, Kg= kilogram, *p< 0,05 (ANOVA and Bonferroni).
0 100 200 300 400 500 600 700 800
<25 >25<35 >35
Body Mass Index
Wal k di st ance (m )
*
*
0 100 200 300 400 500 600 700 800<25 >25<35 >35
Body Mass Index
Wal k di st ance (m ) 0 100 200 300 400 500 600 700 800
<25 >25<35 >35
Body Mass Index
Wal k di st ance (m )
*
*
0 100 200 300 400 500 600 700 80020 a 40
Age (years) Wa lk di st ance (m )
41 a 60 > 60
*
*
0 100 200 300 400 500 600 700 80020 a 40
Age (years) Wa lk di st ance (m )
41 a 60 > 60
0 100 200 300 400 500 600 700 800
20 a 40
Age (years) Wa lk di st ance (m )
41 a 60 > 60
*
134 Pires SR, Oliveira AC, Parreira VF & Britto RR Rev. bras. fisioter.
Sherrill7. The difference in walking distance can be explained by the decrease in global muscle strength9 and pulmonary function as a physiological consequence of the aging process. Thus, this test is accounted as a relevant evaluation instrument for this population, what has been evidenced by the literature9,11.
Regarding the body mass index, the individuals with an index <25 walked distances greater than the distances walked by individuals with an index >25. There was no statistical difference between the distance covered by subjects with body mass index >25 and <35 and the distance covered by subjects with body mass index >35. This finding may be a result of the small number of subjects in the group with body mass index >35 (n=10). The model used by Enright and Sherrill7 has demonstrated significance by correlating the body mass index with the distance covered. Troosters and colleagues9 have explained the variability of the walked distance as a consequence of the variation in weight and height as well as in sex and age. These observations suggest that weight and height should be taken into account when the test results of different individuals are compared.
CONCLUSION
The six-minute walk test is a reproducible and sensitive instrument to assess functional capacity of Brazilian sedentary individuals with different ages. Moreover, it is not necessary, in general, to perform two test repetitions. The present study has also evidenced that subjects which are younger or with body mass index <25 walk greater distances, suggesting that these variables should be taken into consideration when walking distances of different groups are compared.
Support: CNPq – Bolsa de Produtividade em Pesquisa.
REFERENCES
1. Soares CPS, Pires SR, Britto RR, Parreira VF. Avaliação da aplicabilidade da equação de referência para estimativa de desempenho no teste de caminhada de 6 minutos em indivíduos saudáveis brasileiros. Revista da Sociedade de Cardiologia do Estado de São Paulo. 2004;14(1):1-8.
2. Enright PL. The six minute walk test. Respir Care. 2004; 48(8):783-5.
3. Cahalin L, Pappagianopoulos P, Prevost S, Wain J, Ginns L. The relationship of the 6-min walk test to maximal oxygen consumption in transplant candidates with end stage lung disease. Chest. 1995;108(2):452-9.
4. ATS Statement: Guideline for the six-minute walk test. Am J Respir Crit Care Med. 2002;166:111-7.
5. Harada ND, Chiu V, Stewart AL. Mobility related function in older adults: assessment with a 6-minute walk test. Arch Phys Med Rehabil. 1999;80:837-41.
6. Hamilton DM, Haennel RG. Validity and reliability of the six minute walk test in a cardiac rehabilitation population. J Cardiopulm Rehabil. 2000;20(3):156-64.
7. Enrigth PL, Sherrill DL. Reference equations for the six minute walk in health adults. Am J Respir Crit Care Med. 1998;158:1384-7.
8. Cahalin LP, Mathier MA, Semigram MU, William G, Di Salvo TG. The six minute walk test predicts peak oxygen uptake and survival in patients with advanced heart failure. Chest. 1996;110:325-32.
9. Troosters T, Gosselink R, Decramer M. Six minute walking distance in healthy elderly subjects. Eur Respir J. 1999;14: 270-4.
10. Steffen TM, Hacker TA, Mollinger L. Age and gender related test performance in comunity- dwelling elderly people: six minute walk test, berg balance scale, timed up & go test and gait speeds. Phys Ther. 2002;82:128-37.
11. Kervio G, Carre F, Ville NS. Reliability and intensity of the six--minute walk test in healthy elderly subjects. Med Sci Sports Exerc. 2003;35(1):169-74.
12. Guyatt G, Pugsley SO, Sullivan MJ, Thompson PJ, Berman L, Jones NL, et al. Effect of encouragement on walking test performance. Thorax. 1994;39:818-22.
13. McGavin CR, Gupta SP, McHardy GJR. Twelve minute wal-king test for assessing disability in chronic bronchitis. Br Med J. 1976;1:822-3.