ORIGIN
AL RESEAR
CH
Duration of the efects of spinal manipulation on
pain intensity and electromyographic activity of
paravertebral parts of individuals with chronic
mechanical low back pain
Duração dos efeitos de uma manipulação vertebral sobre a intensidade da dor e atividade
eletromiográica dos paravertebrais de indivíduos com lombalgia crônica mecânica
Duración de los efectos de manipulación vertebral sobre la intensidad de dolor y actividad
electromiográica de la columna en sujetos con dolor lumbar crónico mecánico
Walkyria Vilas Boas Fernandes1, Eduardo Silveira Bicalho2, Andrielle Elaine Capote3, Elisangela Ferretti
Manfra4
Mailing address: Elisangela Ferretti Manfra – Escola Politécnica, Pontifícia Universidade Católica do Paraná (PUCPR) – Rua Imaculada Conceição, 1155 – Curitiba (PR), Brazil – CEP: 80215-901 – E-mail: [email protected] – Financing source: Nothing to declare – Conlict of interest: Nothing to declare – Presentation: Feb. 2015 – Accepted for publication: June 2016 – Approved by the Ethics and Research Committee of PUCPR (opinion # 5512).
Study performed at the Medical School of Physiotherapy at Pontifícia Universidade Católica (PUC/PR) – Curitiba (PR), Brazil. 1 Master in Technology and Health by Pontifícia Universidade Católica – PUC/PR; Professor at the Medicine Course at the Federal University of Mato Grosso (UFMT) – Rondonópolis (MT), Brazil.
2 Master in Technology and Health by Pontifícia Universidade Católica (PUC/PR) – Curitiba (PR), Brazil. 3 Master’s student in Physiology by the Federal University of Paraná (UFPR) – Curitiba (PR), Brazil.
4 PhD in Natural Sciences; Professor at the Post-Graduation Course in Health Technology at Pontifícia Universidade Católica (PUC) – Curitiba (PR), Brazil.
ABSTRACT | The objective of this research was to evaluate the efects of a manipulative intervention on the electromyographic activity of paraverterbral muscles and low back pain intensity, both immediately and 30 minutes after their application in individuals with chronic low back pain. Thirty-eight individuals were evaluated, being randomly divided into two groups: the one who received global vertebral manipulation technique (n=20), and control (n=18), which remained in lateral decubitus for 10 seconds on each side of the body. The electromyographic signal of paravertebral parts at L4-L5 level both right and left was collected during three cycles of lexion-relaxation-extension of the torso. In the intervals between cycles, participants reported the intensity of pain through the Visual Analog Scale (VAS, 100 mm). A signiicant reduction in pain intensity in the group that received the manipulation was observed, opposed to the control group, in which the score increased in VAS. The dimension of the efect on pain intensity was 1.0 and 0.9 right after the manipulation and 30 minutes later. The lexion/relaxation ratio (FRR) increased in the group that was subjected to manipulation, but remained unchanged in the control group. The FRR displayed efects between the groups that were 0.6 and 0.5 in both assessments. We were able to see efects of the
155
manipulation in these two variables, and its continuation in the range observed, concluding that they linger at least during that time.
Keywords | Low Back Pain; Spinal Manipulation; Electromyography.
logo após a manipulação e 30 minutos depois. A razão de lexão/ relaxamento (RFR) aumentou no grupo que foi submetido à manipulação, mas permaneceu inalterada no grupo controle. A RFR exibiu tamanhos de 0,6 e 0,5 entre os grupos nas duas avaliações. Foi possível constatar efeitos da manipulação nessas duas variáveis e sua continuidade no intervalo observado, concluindo-se que eles perduram pelo menos durante esse tempo.
Descritores | Dor Lombar; Manipulação da Coluna; Eletromiograia.
RESUMEN | En este estudio se evalúan los efectos de intervención manipulativa sobre la actividad electromiográica de los músculos paravertebrales y la intensidad del dolor lumbar inmediatamente y treinta minutos después de realizada la actividad por sujetos con dolor lumbar crónica mecánica. Participaron 38 sujetos, los cuales fueron divididos al azar en dos grupos: el que había recibido la técnica de manejo vertebral global (n=20) y el grupo control (n=18), lo cual había permanecido en posición lateral por diez segundos sobre cada
lado del cuerpo. Se recolectó el signo electromiográico de los paravertebrales al nivel L4-L5 derecho e izquierdo durante tres ciclos de movimiento de lexión-relajamiento-extensión del tronco. Entre los intervalos de los ciclos, los participantes relataron la intensidad de dolor mediante la Escala Visual Analógica (EVA 100 mm). Los resultados mostraron una signiicativa disminución en la intensidad de dolor en el grupo que había recibido el manejo, mientras que el grupo control aumentó el puntaje de EVA. El efecto de la intensidad de dolor fue de 1,0 y 0,9 tras el manejo y treinta minutos después. La razón lexión/relajamiento (RFR) aumentó en el grupo al que se sometió al manejo, mientras que había permanecido inalterable en el grupo control. Los valores de los efectos de la RFR entre los grupos fueron de 0,6 y 0,5 en las dos evaluaciones. En estas dos variables se constataron efectos de manejo, que había seguido en el intervalo observado, lo que muestra su permanencia por lo menos durante el periodo.
Palabras clave | Dolor Lumbar; Manipulación Espinal; Electromiografía.
INTRODUCTION
Low back pain is the most common cause of incapacity for people under 45 years old, and the second most common reason for irst-contact professional appointments, as chiropractors and osteopaths1, who use high-speed spinal manipulation techniques as a conservative approach in the treatment of musculoskeletal disorders2,3.
Some studies have reported positive results from spinal manipulation such as improving joint mobility, decreasing pain and muscle spasms2,4,5. he physiological mechanisms responsible for these efects are not yet fully clear2,3,6, but are related to the inhibition of the electrical activity of paravertebral muscles. his is because individuals with low back pain often do not exhibit the lexion-relaxation phenomenon7, i.e., paravertebral electromyographical activity does not stop when they reach the full lexion, the opposite that occurs with individuals without the pathology8. Such increased electrical activity in the phase of relaxation would be a protective mechanism, because it stabilizes the structures involved, preventing other injuries8. It could be related to the structural changes of paravertebral muscles of people with chronic low back pain, such as changes in the proportion of type I and II ibers9.
Works that have studied the immediate efects of the manipulation in subjects with low back pain, observed a decrease of electromyographic activity when the individual is in full lexion of the trunk immediately after the intervention5,10. hese studies researched only the immediate efects of vertebral manipulation and how long they could endure is unknown. To contribute in this sense, the objective of this study was to analyze the efects of a high-speed manipulative intervention on pain intensity and the electromyographic activity of paravertebral muscles in patients with chronic low back pain in a horizon of 30 minutes after application of the manipulation.
he hypothesis proposed here is that the efects of the manipulation in pain intensity and electromyographic activity should continue in the range observed (30 minutes).
METHODOLOGY
PUCPR. Individuals with radiated pain below the knee, skeletal or neuromuscular disorders identiied by MRI or x-ray, and those who showed signs called “red lags” were excluded12.
Forty volunteers were selected randomly and separated into control (C) and manipulation (M) groups. A box containing 20 numbers “1” and 20 numbers “2” was used. he volunteers who fulilled the inclusion requirements of the research drew a number to establish to which group they would belong. hey were then submitted to an initial evaluation comprised by medical history, physical evaluation, and Rolland-Morris’ questionnaire13. Electromyographic signals from two volunteers of the control group had to be eliminated from the analysis, because they were hopelessly compromised by artifacts. herefore, Group C featured 18 subjects (3 men and 15 women) and Group M featured 20 subjects (5 men and 15 women). Group C was 44.3±8.6 years old, pain period of 7.1±7.3 years, and the score in Rolland-Morris
questionnaire of 10.3±5.2. he age of Group M was 37.9±9.8 years old, their pain period was of 8.9±7.5 years, and the questionnaire score was of 8.5±4.3. here was no diference between the groups regarding these parameters.
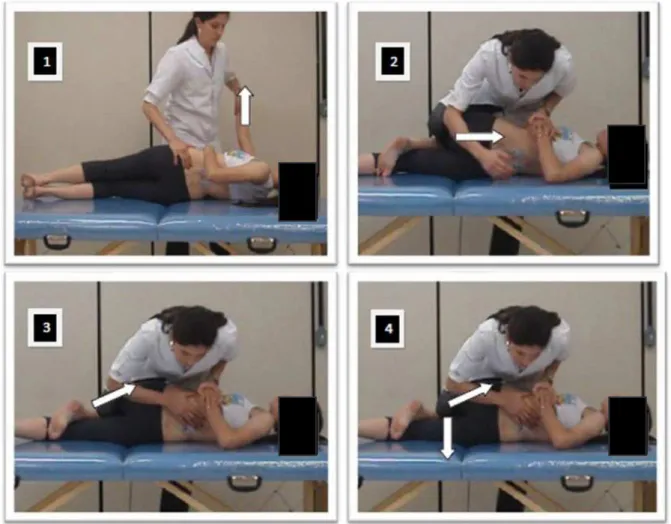
Group M received a global bilateral high-speed vertebral manipulation of the pelvis14, while volunteers in group C remained in prone position to the right and to the left for ten seconds each10,15, without any intervention. Spinal manipulation applied in group M was carried out as follows: the physical therapist placed a low back rotation parameter until the tension relected over L5, then supported the forearm in the sacroiliac joint to make a pressure upwards and in the posterior-anterior direction. At the end of these parameters, a short and quick manipulative thrust was applied, aided by a kick of the leg of the physical therapist23 (Figure 1). he vertebral manipulations were performed by an osteopathy specialist physical therapist with more than 5 years of experience.
Electromyography (EMG) signals and the intensity of pain were collected in three moments: pre, post, and after 30 minutes of operation. he signs were collected during the lexion/extension movement of the torso in 3 phases: lexion, extension, and relaxation. For that, the volunteers started of from the standing position with their feet separated in the shoulder distance, and were asked to perform a bending of the torso for 3 seconds, keeping their knees extended, keeping the maximum lexion for 3 seconds (relaxation), and return to the initial position in 3 seconds (extension). he verbal command was used with the help of a timer to control the movement5,17. hree cycles were carried out with 1 minute of rest between them. At the end of each cycle, the volunteers marked the perception of pain in visual analogue scale (VAS-100 mm). Before that procedure a training was performed with the volunteers with three attempts each5,17. In a day before the data collection the test of Biering-Sorensen18 was conducted to obtain the EMG values during maximum voluntary contraction (MVC).
he procedures were performed by two researchers. he irst researcher was blind to the composition of the groups and was responsible for collecting the EMG and VAS, and the other for the implementation of the manipulations.
To capture the EMG signals, two pairs of self-adhesive bipolar electrodes with Ag/AgCl surface, 1 cm diameter (Kendal Meditrace, Canada) were stuck to paravertebral muscles on the right and the left side at the L4-L5 level, after shaving and cleaning with alcohol. he electrodes were placed at 20 mm laterally to the spine process, with a distance between the centers of 20 mm. During the sticking of the electrodes, the volunteers kept their torso semi-lexed. he reference electrode was stuck to the styloid process of the ulna of the right upper limb. Scanning was performed with an electromyograph (EMG System do Brasil® 800 C), 2000 gain, and a band-pass ilter between 10 and 500 Hz connected to a signal acquisition board (National Instruments, model USB-6221).
LabVIEW Signal Express 3.0 software was used to scan the signals at 1 kHz and ilter them with Butterworth ilter of 4th order, band-stop ilter between 59 and 61 Hz. he addition of this ilter was required to eliminate the 60 Hz noise of the mains. he signals were then processed by software developed in Matlab environment that would smoothen the signals by calculating the RMS values in mobile windows of 1s, with separate centers for 1ms. he maximum values of that RMS envelope, at each stage, were identiied
automatically by the software, their values were normalized with respect to the signal obtained in the MVC. he average of the left and right muscles was calculated and that value was used as a measure of muscle electrical activity. he lexion-relaxation (FRR), relaxation-extension (RER) and extension-lexion (EFR) ratios were obtained by dividing the maximum of the RMS envelope from one stage by the other19,29.
To check the normality of the data, the Shapiro-Wilk test was used. Due to the non-normality of the data the ANOVA analysis of Friedman was used for comparison between moments, and the Mann-Whitney U test was used for comparison between groups. he signiicance level was 0.05, and the Statisca v. 7.0 software was used. When ANOVA indicated a diference, the Wilcoxon test would be performed to compare the moments two by two, with a signiicance level of 0.016, due to the Bonferroni correction. In situations in which signiicant diferences were found between the groups, the size of the efect was estimated21.
RESULTS
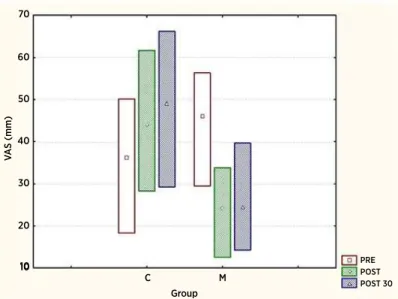
Figure 2 shows the values of the intensity of pain in every moment. he M group had a reduction in pain intensity as Group C had an increase. A diference was detected between the groups in the POST and POST30 (p=0.007 and p=0.002) moments, but not at the PRE (p=0.251) moment. he dimension of the efect on the diference between the groups in the POST moment was 0.9, and the POST30 moment was 1.0.
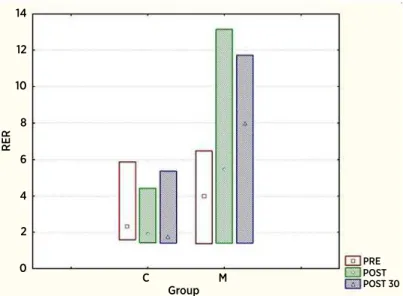
he electromyographic activity values are shown in Table 1. he FRR and RER increased signiicantly after the intervention for Group M, and there was no change in Group C, as shown in igures 3 and 4. EFR values remained unchanged after the manipulation for the two groups, and there was no diference between them observed.
Group 10
10 20 30 40 50 60 70
PRE POST POST 30
V
A
S (mm)
C M
Figure 2. Values of the medians and inter-quartiles range of the Visual Analog Scale (VAS) for groups C (control) and M (that was manipulated) in the three moments (PRE, POST and POST 30). Diferences were found between the three moments in the case of group C (p=0.005) and the M group (p=0.000). Comparing the individual moments, there was a diference between the pre moment and the other two moments, but not among these
Table 1. Maximum values of the RMS envelope of the electromyography (EMG) signal in each stage normalized by the maximum voluntary contraction (MVC). Values expressed as median (Q1-Q3), being the irst quartile Q1 and Q3 the third quartile of the distribution of data
Phase-Group RMSMAX PRE
(%of MVC)
p Value between groups
RMSMAX POST (%of MVC)
p Value between groups
RMSMAX POST 30min (%of MVC)
p Value between groups
Flexion-C 40.9 (38.2 - 68.7)
0.372 37.4 (31.8 - 54.1) 0,918 40.2 (33.6 - 49) 0.473 Flexion-M 38.4 (33.7 - 61.5) 43.4 (31.1 - 57.1) 36.7 (27.2 - 65.7)
Relaxation-C 29.2 (9.4 - 53.4)
0.661 33.4 (13.2 - 61.4) 0.169 35.9 (11.3 - 58.1) 0.084 Relaxation-M* 23.2 (10.3 - 49.4) 15.2 (6.3 - 52.8) 10.2 (5.5 - 43.8)
Extension-C 65.4 (62.0 - 86.7)
0.404 68.6 (62.5 - 88.5) 0.558 63.5 (59.1 - 85.6) 0.598 Extension-M* 79.5 (65.1 - 99.4) 76.6 (64.1 - 99.7) 74.0 (58.7-94.3)
Note: C means control group and M is the group that underwent manipulation. Symbol (*) indicates there was a diference between the moments within the same group. No statistically signiicant diference was observed in the comparison between the groups
Group
RER
Group
PRE POST POST 30
C 0
2 4 6 8 10 12 14
M
Figure 4. Median values and interquartile range of RER for groups C and M in three moments (pre, post, and post 30). There was no diference between the moments in Group C (p=0.030) and also in Group M (p=0.004). Comparing the individual moments, in Group M there was a diference between the pre moment and the other two moments, but not among these. In Group C, the only diference observed was between the pre and post 30 moments
DISCUSSION
he results obtained in the three moments within the group for pain intensity (Figure 2), to the maximum value of the electromyographic signal in relaxation phase (Table 1), and for the FRR and RER ratios (Figures 3 and 4), indicate that the changes have endured during the three evaluations. However, contrary to what was expected, only the score on VAS and FRR exhibited signiicant diferences between the two groups.
Regarding the intensity of the pain, its decrease in group M and its increase in group C here observed also occurred in the studies of Lalanne et al.7 and Bicalho et al.5 considering that in the three studies the individuals in the control group remained lying in lateral decubitus for 10 seconds. But here, besides inding a decrease in pain in the immediate revaluation, it is possible to realize that in group M analgesia was maintained for a period of 30 minutes. A limitation of this study is the fact that group M is already in a level of pain larger than group C before manipulation, having the greatest potential for improvement. However, the fact that there has not been any improvement, but increased pain in group C, suggests that the results are really due to the manipulation.
In the relaxation phase data shows that manipulation was able to reduce the electromyographic activity of paravertebral muscles in total trunk lexion position in group M. hat was the expected result, and it agrees with several other studies in literature5,14,15,22, despite some
methodological diferences. Consequently, the reasons involving the static phase of relaxation also sufered changes (FRR and RER), even with the reduction of electromyographic activity during extension. However it is necessary to emphasize that there was no diference between the groups for maximum RMS amplitude values, even if the behavior of the two groups individually has been diferent. he inability to see diference between the groups was probably a result of the great dispersion of signal amplitude variables of EMG.
relex inhibition of electromyographic activity of paravertebral muscles in the relaxation phase. So, it seems clear that spinal manipulation is able to increase FRR, since the values of the electromyographic activity of the lexion phase have not been modiied, but those of the relaxation phase decreased, motivating new studies to clarify the mechanisms behind this increase.
On the values of the relaxation/extension ratio (RER) we observed changes in the post and post 30 minutes moments. Similar results were found in studies from Lehman and McGill14; Devotch et al.22; and Ferreira et al.6, which have showed that the inhibition of acute manipulations generates electromyographic activity of paravertebral muscles in static or relaxation situations, changing the RER or FRR as showed, since that ratio involves one of the static phases.
No signiicant change occurred in the EFR after spinal manipulation. In group C, this result is due to no change in the electromyographic activity dynamic phases (lexion and extension). In the case of group M, a reduction of electromyographic activity in extension phase was not enough so there was a change in EFR. hat result agrees with Ritvanen et al.15 and Bicalho et al.5, who did not ind signiicant diferences in the EFR after the therapeutic interventions.
he values of the size of the efect relating to the diference between the two groups for both the VAS and FRR reveal that the intervention efect is stronger on the irst variable when compared to the second one.
One limitation of the study is the absence of an efective placebo or sham group to identify the placebo efect regarding the expectation of the volunteer and the manual contact of the therapist. For being such a transversal study without the intent to treat pain, the results have very limited validity from a clinical point of view. To investigate the results of manipulation as a treatment it would be necessary to establish a clinical protocol with repetition of the maneuver on the same day or in several days. he results reported here might assist in the deinition or the analysis of a clinical protocol of that nature.
CONCLUSION
High-speed manipulative intervention applied in this study was able to promote a decrease in pain intensity (measured by VAS) and increased lexion-relaxation ratio (FRR), and these efects were kept for the 30 minutes in which observation lasted.
ACKNOWLEDGMENTS
W.V.B.F thanks CAPES for the Master’s Degree Fellowship.
REFERENCES
1. Schneider MJ, Brach J, Irrgang JJ, Abbott KV, Wisniewski SR, Delitto A. Mechanical Vs Manual Manipulation for low back pain: an observational cohort study. J Manipulative Physiol Ther. 2010;33(3):193-200. doi: 10.1016/j.jmpt.2010.01.010. 2. Maigne J, Vautravers P. Mode dáction dês manipulations
vertébrales. Rev Rhum. 2003;70:713-9. doi:10.1016/ S1169-8330(03)00158-3
3. Ernest E. A systematic review of systematic reviews of
spinal manipulation.
J R Soc Med
. 2006;99(4):192-6. doi: 10.1258/jrsm.99.4.1924. Pickar JG. Neurophysiological efects of spinal manipulation. Spine J. 2002;2:357-71. doi: http://dx.doi.org/10.1016/ S1529-9430(02)00400-X
5. Bicalho E, Setti JAP, Macagnan J, Cano JLR, Manfra EF. Immediate efects of a high-velocity spine manipulation in paraspinal muscles activity of nonspeciic chronic low-back pain subjects. Manual Ther. 2010;15(5):469-75. doi: 10.1016/j. math.2010.03.012.
6. Ferreira ML, Ferreira PH, Hodges PW. Changes in postural activity of the trunk muscles following spinal manipulative therapy. Manual Ther. 2007;12:240-8. doi:10.1016/j. math.2006.06.015.
7. Lalanne K, Lafond D, Descarreaux M. Modulation of
the lexion-relaxation response by spinal manipulative therapy: a control group study. J Manipulative Physiol Ther. 2009;32(3):203-9. doi: 10.1016/j.jmpt.2009.02.010.
8. Neblett R, Mayer TG, Gatchel RJ, Keeley J, Proctor T, Anagnostis C. Quantifying the lumbar lexionrelaxation phenomenon: theory, normative data and clinical applications. Spine. 2003; 28(13):1435-46. doi: 10.1016/j. jmpt.2014.07.003.
9. Colloca CJ, Hinrichs RN. The biomechanical and clinical signiicance of the lumbar erector spinae lexion_relaxation phenomenon: a review of literature. J Manipulative Physiol Ther. 2005;28(8):623-31. doi:10.1016/j.jmpt.2005.08.005 10. Demoulin C, Crielaard J, Vanderthommen M. Spinal Muscle
Evaluation in Healthy Individuals and Low-Back-Pain Patients: a Literature Review. Joint Bone Spine. 2007;74:9-13. doi:10.1016/j.jbspin.2006.02.013
11. Walker BF, Williamson OD. Mechanical or inlammatory low back pain. What are the potential signs and symptoms. Manual Ther. 2009;14(3)314-20. doi: 10.1016/j. math.2008.04.003.
12. Koes BW, Tulder MWV, Thomas S. Diagnosis and treatment of low back pain. BMJ. 2006;332:1430-4. doi:10.1136/ bmj.332.7555.1430.
ques-tionnaire − Brazil Roland-Morris. Braz J Med Biol Res. 2001;34(2):203-10. doi: http://dx.doi.org/10.1590/S0100-879X2001000200007.
14. Lehman GJ, McGill SM. Spinal manipulation causes variable spine kinematic and trunk muscles electromyographic responses. Clin Biomech. 2001;16(4):293-9. doi: http:// dx.doi.org/10.1016/S0268-0033(00)00085-1
15. Ritvanen T, Zaproudina N, Nissen M, Leinoven V, Hannine O. Dynamic surface electromyographic responses in chronic low back pain treated by traditional bone setting and conventional physical therapy. J Manipulative Physiol Ther. 2007;30(1):31-7. doi:10.1016/j.jmpt.2006.11.010.
16. Ricard F. Tratamiento osteopatico de las lumbalgias y ciaticas. Madrid: Panamericana, 1998.
17. Marshal P, Murphy B. Changes in the lexion relaxation response following an exercise intervention. Spine. 2006a;31(23):877-83. doi: 10.1097/01.brs.0000244557.56735.05
18. Biering-Sorenson. Physical measurements as risk indicators for low back trouble over a one-year period. Spine. 1984;9(2):106-119, 1984.
19. Watson PJ, Phil CKBM, Main CJ, Chen ACN. Surface electromyography in the identiication of chronic low back pain patients: the development of the lexion relaxation ratio. Clin Biomech. 1997;12(3):165-71. doi: http://dx.doi. org/10.1016/S0268-0033(97)00065-X
20. Ambroz C, Scott A, Ambroz A, Talbott EO. Chronic low back pain assessment using surface electromyography. J Occup Env Med. 2000;42(6):660-9.
21. Cohen J. Statistical power analysis for the behavioral sciences. 2. ed. New Jersey: Lawrence Erlbaum Associates, 1988.