Abstract
Objective: To assess growth hormone (GH)/insulin like growth factor-1 (IGF-1) axis as a possible non-nutritional factor for growth retardation in children with cerebral palsy (CP).
Methods: A case-control study was conducted at a tertiary university hospital. Thirty children with CP (seven children with normal growth [CP-N] and 23 with retarded growth [CP-R]), 30 children with protein energy malnutrition (PEM), and 30 healthy children (REF group) underwent an assessment of growth parameters, serum IGF-1, basal GH, and peak GH after stimulation with insulin.
Results: PEM patients had higher basal GH levels than CP-N, CP-R and REF groups (p = 0.026, p < 0.001, and p < 0.001 respectively). After insulin stimulation, CP-N, CP-R, and PEM patients had lower GH levels compared to the REF group (p = 0.04, p = 0.007, and p = 0.036 respectively). IGF-1 levels were lower in CP-R group compared to CP-N and REF groups (p = 0.037 and p < 0.001 respectively), and in PEM group compared to CP-N and REF groups (p < 0.001 and p < 0.001 respectively).
Conclusions: CP-R patients failed to demonstrate the same high basal GH response as PEM patients, and responded inadequately to the insulin stimulation test, but they had IGF-1 levels comparable to those of PEM patients. On the other hand, CP-N patients behaved as controls regarding their basal GH and IGF-1 levels, but failed to respond adequately to the insulin stimulation test. The PEM group presented high basal GH and low IGF-1 levels. These indings suggest that non-nutritional factors contribute to growth retardation in CP children.
J Pediatr (Rio J). 2012;88(3):267-74: GH, IGF-1, cerebral palsy, children.
Original article
Copyright © by Sociedade Brasileira de Pediatria267
Introduction
Cerebral palsy (CP) is a catastrophic acquired disease, occurring during development of the fetal or infant brain. It mainly affects the motor control centers of the developing brain, but can also affect cognitive functions, and is usually accompanied by a cohort of symptoms including lack of communication, epilepsy, and alterations in behavior.1
Children with CP are generally undernourished and growth retarded in comparison with normal children, and
the growth patterns of these children were associated with their overall health and social participation. CP children with best growth had fewest days of health care use and fewest days of social participation missed.2
The reasons for poor growth are not only due to poor nutritional status, but also to non-nutritional factors such as immobility, endocrinological abnormalities, and spasticity with high energy requirements.3
Growth hormone/insulin-like growth factor-1 axis:
a possible non-nutritional factor for growth retardation
in children with cerebral palsy
Moustafa A. Hegazi,1 Othman E. Soliman,1 Bothina M. Hasaneen,1
Mohammed El-Arman,2 Nawal Abd El-Galel,2 Basem S. El-Deek3
1. MD. Department of Pediatrics, Mansoura University Children’s Hospital, Mansoura University, Mansoura, Egypt. 2. MD. Department of Clinical Pathology, Faculty of Medicine, Mansoura University, Mansoura, Egypt.
3. MD. Department of Public Health, Faculty of Medicine, Mansoura University, Mansoura, Egypt. King Abdulaziz University, Faculty of Medicine, Jeddah, Saudi Arabia.
No conflicts of interest declared concerning the publication of this article.
Suggested citation: Hegazi MA, Soliman OE, Hasaneen BM, El-Arman M, El-Galel NA, El-Deek BS. Growth hormone/insulin-like growth factor-1 axis: a possible non-nutritional factor for growth retardation in children with cerebral palsy. J Pediatr (Rio J). 2012;88(3):267-74.
Measurement of growth hormone (GH)/insulin-like growth factor-1 (IGF-1) axis is frequently asked in growth-retarded children, and IGF-1 is used during the assessment
of a child for the presence of GH deiciency and to monitor the eficacy of GH replacement therapy.4 The GH axis has not been systematically studied in children with CP, and the number of studies reporting whether or not GH secretion is impaired in CP is quite limited.5,6 However, there have been reports of abnormalities in GH secretion among these children.7
Therefore, this study was designed to assess the GH-IGF-1 axis as a possible non-nutritional factor for growth retardation in children with CP.
Methods
Patient selection
This study was carried out at Mansoura University Children’s Hospital, Mansoura city, Egypt. Our study included 30 children (13 males and 17 females) with spastic CP of moderate severity (level III of the gross motor function
classiication system).8 These children were subjected to thorough analysis, with full history taking, thorough examination, and all necessary laboratory and imaging
investigation needed to conirm the diagnosis of idiopathic
CP in each individual case, as patients were chosen from CP
children who had suficient follow-up time in our pediatric
neurology outpatient clinic and not just from newly diagnosed cases. They were subsequently divided according to their growth status into children with normal growth parameters (CP-N group, seven children: three males and four females, with mean age of 1.89±0.57 years) and children with growth retardation (CP-R group, 23 children: 10 males and 13 females, with mean age of 1.86±0.48 years). CP children with growth retardation had either retarded height alone (only three children) or retarded both weight and height (20
children). Underweight and stunting were deined according
to World Health Organization criteria (i.e., z score more than two standard deviations below the median weight and height for both age and gender).9
All CP patients were non-breast feeders and were selected only if they had adequate oral food intake according to a 3-day diet recall given by an adult who usually spent most of the time with the child (generally the mother). Recommendations about portion size, plates, spoons, and bottle were given to the proxy to mitigate information bias. Food records were analyzed for energy and protein intake using the Egyptian nutrition food composition database, which contains information on 23 nutrients for 430 foods and 13 food groups.10
The estimated intake was above 1,074 kcal/24 h (or 4,494 kJ/24 h) for energy intake and above 21 g/24 h for protein intake for every CP patient to be included in the study, in an attempt to exclude the nutritional factor that
may be responsible for growth retardation. These values of energy and protein intake were the recommended daily allowances of energy and protein intake for children aged 1-3 years, according to the most recent recommendations of the Food and Nutrition Board of the National Academy of Sciences.11
A group of non-breast feeders with protein energy malnutrition (PEM) and growth retardation matched for age and sex was included to study GH and IGF-1 pattern in
these patients with pure nutrient deiciency in comparison
with CP children. The estimated intake was below 1,074 kcal/24 h (or 4,494 kJ/24 h) for energy intake and below 21 g/24 h for protein intake for every PEM patient to be included in the study.11 The PEM group comprised 30 children with a mean age of 1.73±0.39 years (11 males and 19 females). They were recruited from a pediatric malnutrition outpatient clinic.
In addition, 30 apparently healthy children matched for age and sex, with a mean age of 1.9±0.49 years (16 males and 14 females) and normal growth parameters, attending Mansoura University Children’s Hospital for routine medical check-up, were included as a normal control group (REF group).
This study was approved by the local ethics committee of Mansoura Faculty of Medicine, and written informed consent was obtained from the parents of all participants.
Exclusion criteria
Children with genetic syndromes, chromosomal abnormalities, neurodegenerative disorders, inborn errors of metabolism, endocrinal abnormalities other than GH
deiciency, other medical illnesses known to inluence
growth or cause organic failure to thrive, and CP children with acute critical situations (emergency admission) for
resistant its with affection of consciousness or severe
infections were excluded from the study. Moreover, CP patients with conditions that confound accurate linear growth assessment (e.g. contracture, scoliosis, marked spasticity) and patients with poor oral food intake or retention due to any cause (e.g. feeding problems, oral motor dysfunction, nasogastric or gastrostomy tube feeding, gastroesophageal
relux disease, and persistent vomiting or diarrhea) were
also excluded from the study. Any CP or PEM case with history of prematurity, low birth weight, or intrauterine growth retardation was excluded from the study. PEM cases caused by or associated with any organic illness and not
related to isolated or pure nutritional deiciency were not
allowed to enter the study.
Anthropometric measurements
and weight for height. Standing height without shoes was measured by using a Harpenden stadiometer (Holtain Ltd). Recumbent length was recorded in young children and in children with CP who were unable to stand on the scales using a digital supine measuring table. Only three children with CP, 10 children with PEM, and 17 normal children in the REF group had height measured standing on both feet. The remaining children in each group had length measured lied in supine position. Weight measurements (±0.1 kg) were made using an ordinary scale, with the children wearing minimal clothing.
Sampling
A good venous access was obtained, a nurse and a doctor were present throughout the procedure, and facilities for resuscitation were available. Venous blood sample was withdrawn from every child 30 minutes before stimulation with insulin. The separated serum was stored at -70 ºC for determination of basal GH and IGF-1. GH response to provocation was assessed by the insulin-induced hypoglycemia test (0.1 IU/kg of body weight), after hospitalization of our patients and controls to ensure performance of the test under strict conditions of surveillance and utilizing safety precautions. When an adequate hypoglycemic stimulus was reached (i.e., blood glucose falls to < 40 mg/dL after serial blood glucose level checking with a blood glucose meter manufactured by Abbott Diabetes Care Inc, Alameda, CA, USA), three blood samples were drawn for measuring GH response to provocation (at 30 minutes intervals for one and half hour), and the separated serum was kept at -70 ºC for determination of the highest level or peak GH. A GH level below 10 ng/mL
after the GH provocation test with insulin was deined as
subnormal GH secretion.12
Determination of serum GH levels
Both basal GH level and GH level after stimulation, expressed in ng/mL, were determined in patients and controls by a solid phase, two-site chemiluminescent immunometric assay using an Immulite Autoanalyzer supplied by Siemens (USA).
Assay of serum IGF-1
Serum IGF-1, expressed in ng/mL, was determined in the same sample taken for basal GH assay using enzyme linked immunosorbent assay (ELISA). The materials were supplied by Diagnostic Systems Laboratories, Webster, TX, USA.
Sample size, power of the study, and statistical analysis
The sample size was calculated by the Epi-Info program. The hypothesized mean and standard deviation of GH were
3.0 and 1.5 respectively. The null hypothesis mean was 2.0.
The conidence level and alpha error were set up at 95%
and 0.05 respectively. Beta error was set up at 0.20, so the
power of the study was 80%. The estimated sample size
was 25 infants in each group, but we increased the sample to 30 to guard against dropouts and defaulters.
Statistical analysis was done by using SPSS version 10. Qualitative data were expressed as numbers and percentages. Chi-square analysis with Yates correction
was used as a test of signiicance for qualitative data.
The Kolmogorov-Smirnov test was used to determine the distribution of data. When the data were parametric, the F test (one-way ANOVA) was used for comparison of more than two groups and the t test for comparison of two groups. The Kruskal-Wallis H and Mann-Whitney U tests were used for comparison of nonparametric data from more than two groups and two groups respectively. Spearman rank correlation was done to study the relation between variables. The Bonferroni test was used for
correction of p values. Signiicance was considered at a
p value of 0.05 or less.
Results
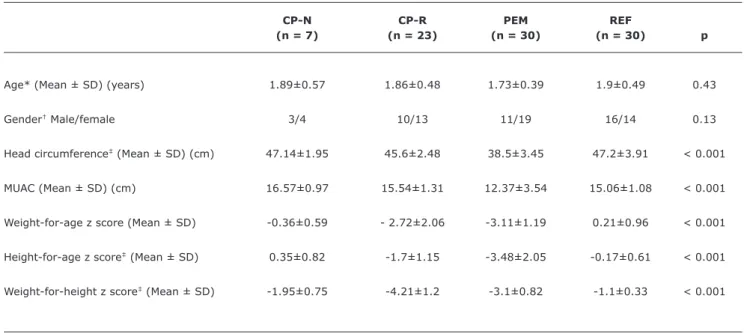
Demographic data and growth parameters of the studied subjects are summarized in Table 1.
Signiicant differences were found for the anthropometric
measurements between the studied groups by the Kruskal-Wallis H test (p < 0.001). Further statistical analysis with the Mann-Whitney U test, which compared each pair of groups separately, and Bonferroni test correction (p c) showed that
the REF group had signiicantly better growth parameters, as relected by a lesser negative deviation of
weight-for-age, height-for-weight-for-age, and weight-for-height z scores than both PEM and CP-R groups (p c < 0.001). The CP-N group
had signiicantly lesser negative deviation of
weight-for-age, height-for-weight-for-age, and weight-for-height z scores than both PEM and CP-R groups (p c < 0.001 for weight-for-age z score, p c = 0.036 and p c < 0.001 for height-for-age z score, and p c < 0.001 for weight-for-height z score). The
REF group had signiicantly lesser negative deviation of
height-for-age z score and weight-for-height z score than
the CP-N group (p c < 0.001), and no signiicant difference
in weight-for-age z score (p c = 0.99), height-for-age z score (p c = 0.42), and weight-for-height z score (p c = 0.54) was found between CP-R group and PEM group.
For energy and protein intake/24 h, obtained from a
3-day diet recall, the REF group had signiicantly higher
energy and protein intake than PEM, CP-N and CP-R groups
(p c < 0.001). The CP-N and CP-R groups had signiicantly
higher energy and protein intake than the PEM group
(p c < 0.001), and no signiicant difference in energy and
Table 1 - Demographic data and anthropometric measurements of the studied groups
CP-N group = cerebral palsy with normal growth; CP-R group = cerebral palsy with retarded growth; MUAC = mid-upper arm circumference; PEM group = protein energy malnourished patients; REF group = normal controls; SD = standard deviation.
* F test (one-way ANOVA).
† Chi-square test for qualitative data.
‡ The Kruskal-Wallis H test was used for all other quantitative data.
CP-N CP-R PEM REF
(n = 7) (n = 23) (n = 30) (n = 30) p
Age* (Mean ± SD) (years) 1.89±0.57 1.86±0.48 1.73±0.39 1.9±0.49 0.43
Gender† Male/female 3/4 10/13 11/19 16/14 0.13
Head circumference‡ (Mean ± SD) (cm) 47.14±1.95 45.6±2.48 38.5±3.45 47.2±3.91 < 0.001
MUAC (Mean ± SD) (cm) 16.57±0.97 15.54±1.31 12.37±3.54 15.06±1.08 < 0.001
Weight-for-age z score (Mean ± SD) -0.36±0.59 - 2.72±2.06 -3.11±1.19 0.21±0.96 < 0.001
Height-for-age z score‡ (Mean ± SD) 0.35±0.82 -1.7±1.15 -3.48±2.05 -0.17±0.61 < 0.001
Weight-for-height z score‡ (Mean ± SD) -1.95±0.75 -4.21±1.2 -3.1±0.82 -1.1±0.33 < 0.001
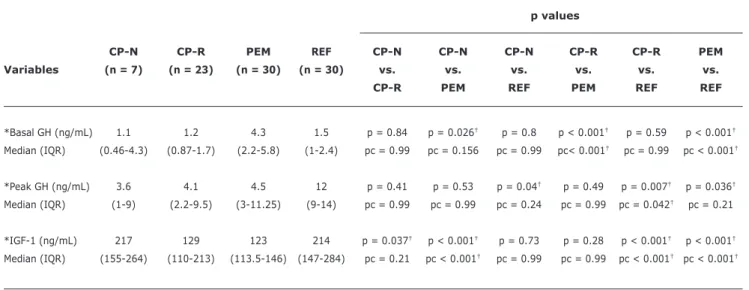
The group of PEM patients presented higher basal GH levels compared to CP-N, CP-R and REF groups (p c = 0.15, p c < 0.001, and p c < 0.001 respectively). Both CP-N
and CP-R groups showed insigniicant difference in basal
GH levels when compared to the REF group (p c = 0.99) (Table 3).
After the insulin stimulation test, the CP-R group had
signiicantly lower GH values compared to the REF group
(p c = 0.04), and a lower peak GH in CP-N and PEM groups compared to the REF group (p c = 0.24, and p c = 0.21
respectively) was demonstrated. Insigniicant difference
in peak GH was found between CP-N and CP-R groups compared to the PEM group (p c = 0.99). There was
insigniicant difference in basal GH level or GH level after
stimulation with insulin between CP-N group and CP-R group (p c = 0.99) (Table 3).
The group of CP-R patients had signiicantly lower IGF-1
values compared to the REF group (p c < 0.001), while
the CP-N group showed insigniicant difference in IGF-1
levels when compared to the REF group (p c = 0.99) and higher IGF-1 values when compared to the CP-R group (p c = 0.2). The group of CP-N patients showed
signiicantly higher IGF-1 values when compared to the
PEM group (p c < 0.001), while CP-R group showed
insigniicant difference in IGF-1 levels when compared
to the PEM group (p c = 0.99) (Table 3).
The group of PEM patients showed lower GH levels after GH stimulation with insulin than those of the REF group (p c = 0.2). IGF-1 values of the PEM group were
signiicantly lower than those of the REF group (p c < 0.001)
(Table 3).
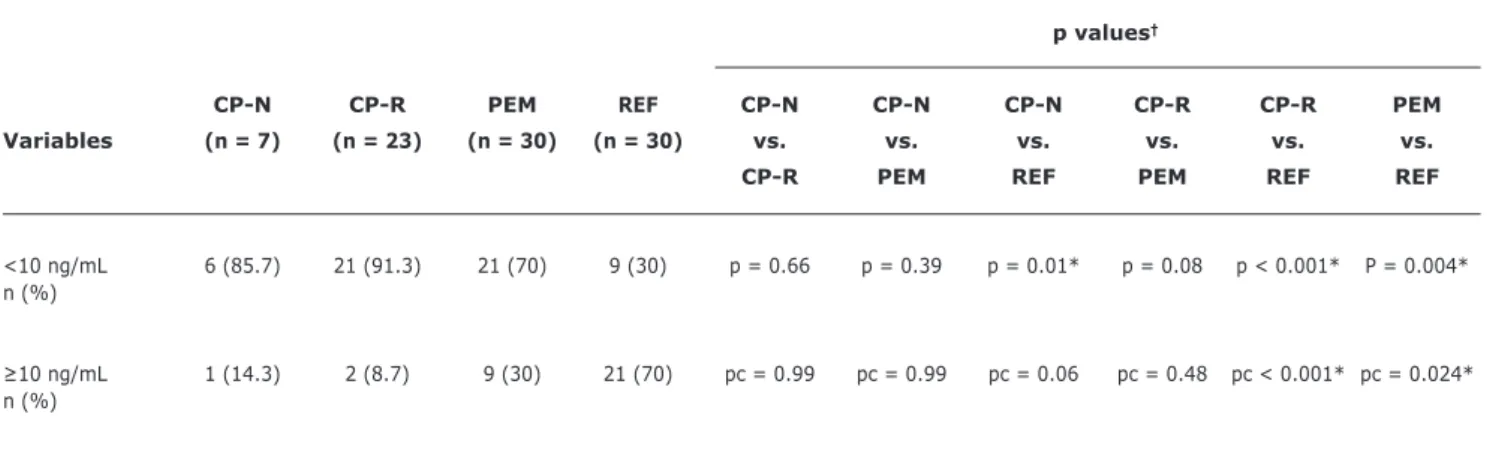
The percentage of cases showing GH rise ≥ 10 ng/mL
after stimulation with insulin was lower in CP-N, CP-R and PEM groups than in the REF group (p c = 0.06, p c < 0.001, and p c = 0.02 respectively) (Table 4).
Correlation studies revealed insigniicant data apart from a signiicant positive correlation between IGF-1 levels and
height-for-age z score (r = 0.92, p < 0.001) in both CP
groups and a signiicant negative correlation between gross motor function classiication system and weight-for-age z
score (r = -0.51, p = 0.01) in both CP groups.
Discussion
Table 2 - Comparison between the studied groups with regard to energy and protein intake/24 h obtained from a 3-day diet recall
p values
CP-N CP-R PEM REF CP-N CP-N CP-N CP-R CP-R PEM
Variables (n = 7) (n = 23) (n = 30) (n = 30) vs. vs. vs. vs. vs. vs.
CP-R PEM REF PEM REF REF
Energy intake
(Kcal/24 h) p = 0.65 p < 0.001* p < 0.001* p < 0.001* p < 0.001* p < 0.001* (Mean ± SD) 1.244±289 1.178±354 511±128 1.694±530 pc = 0.99 pc < 0.001* pc < 0.001* pc < 0.001* pc < 0.001* pc < 0.001*
Protein intake
(g/24 h) p = 0.48 p < 0.001* p < 0.001* p < 0.001* p < 0.001* p < 0.001* (Mean ± SD) 25±8 23±6 15±4 26±7 pc = 0.99 pc < 0.001* pc < 0.001* pc < 0.001* pc < 0.001* pc < 0.001*
CP-N group = cerebral palsy with normal growth; CP-R group = cerebral palsy with retarded growth; p c = Bonferroni correction; PEM group = protein energy malnourished patients; REF group = normal controls; SD = standard deviation.
* F test (one-way ANOVA test) followed by least significant correction (p) then Bonferroni correction (p c).
Table 3 - Comparison between the studied groups with regard to basal GH, peak GH after stimulation with insulin, and IGF-1 levels
p values
CP-N CP-R PEM REF CP-N CP-N CP-N CP-R CP-R PEM
Variables (n = 7) (n = 23) (n = 30) (n = 30) vs. vs. vs. vs. vs. vs.
CP-R PEM REF PEM REF REF
*Basal GH (ng/mL) 1.1 1.2 4.3 1.5 p = 0.84 p = 0.026† p = 0.8 p < 0.001† p = 0.59 p < 0.001†
Median (IQR) (0.46-4.3) (0.87-1.7) (2.2-5.8) (1-2.4) pc = 0.99 pc = 0.156 pc = 0.99 pc< 0.001† pc = 0.99 pc < 0.001†
*Peak GH (ng/mL) 3.6 4.1 4.5 12 p = 0.41 p = 0.53 p = 0.04† p = 0.49 p = 0.007† p = 0.036†
Median (IQR) (1-9) (2.2-9.5) (3-11.25) (9-14) pc = 0.99 pc = 0.99 pc = 0.24 pc = 0.99 pc = 0.042† pc = 0.21
*IGF-1 (ng/mL) 217 129 123 214 p = 0.037† p < 0.001† p = 0.73 p = 0.28 p < 0.001† p < 0.001†
Median (IQR) (155-264) (110-213) (113.5-146) (147-284) pc = 0.21 pc < 0.001† pc = 0.99 pc = 0.99 pc < 0.001† pc < 0.001†
CP-N group = cerebral palsy with normal growth; CP-R group = cerebral palsy with retarded growth; GH = growth hormone; IQR = interquartile range; p c = Bonferroni correction; PEM group = protein energy malnourished patients; REF group = normal controls.
* Significant difference was found between the studied groups (p < 0.001) by Kruskal-Wallis H test followed by a comparison between each pair of groups using Mann-Whitney U test.
† p ≤ 0.05 is significant.
between suboptimal nutritional status and an abnormal central nervous system.7 Therefore, we designed this work to assess GH-IGF-1 axis as a possible non-nutritional factor for growth retardation in children with CP.
In this study, the PEM group showed signiicantly higher
Table 4 - Comparison between the studied groups with regard to percentage of cases showing rise in growth hormone levels ≥ 10 ng/mL after stimulation with insulin
p values†
CP-N CP-R PEM REF CP-N CP-N CP-N CP-R CP-R PEM
Variables (n = 7) (n = 23) (n = 30) (n = 30) vs. vs. vs. vs. vs. vs.
CP-R PEM REF PEM REF REF
<10 ng/mL 6 (85.7) 21 (91.3) 21 (70) 9 (30) p = 0.66 p = 0.39 p = 0.01* p = 0.08 p < 0.001* P = 0.004* n (%)
≥10 ng/mL 1 (14.3) 2 (8.7) 9 (30) 21 (70) pc = 0.99 pc = 0.99 pc = 0.06 pc = 0.48 pc < 0.001* pc = 0.024* n (%)
CP-N group = cerebral palsy with normal growth; CP-R group = cerebral palsy with retarded growth; p c = Bonferroni correction; PEM group = protein energy malnourished patients; REF group = normal controls.
* p < 0.05 is significant.
† Chi-square test.
insigniicant difference was observed between the CP-N
group or the CP-R group and normal controls. This was
evident in other studies where basal GH level was signiicantly
higher in malnourished patients than in controls.14,15 Moreover, this points out that our selected CP patients, whether in CP-N or CP-R group, may not be suffering from
overt or severe nutritional deiciency, like malnourished
patients are, otherwise they would have high basal GH levels similar to those of PEM patients, or there may be an element of subnormal pituitary response to nutritional
deiciency in CP children that leads them to behave more
closely to normal controls in this respect.
After the insulin stimulation test, the CP-R group had
signiicantly lower GH values compared to the REF group
(p c = 0.04), and a similar trend of lower peak GH in CP-N and PEM groups compared to the REF group (p c = 0.24 and
p c = 0.21 respectively) was demonstrated. Insigniicant
difference was found between either CP-N group or CP-R group and PEM group. However, the incremental response seen in CP-N and CP-R groups, which might be comparable between them, was better than that of the PEM group, although it was not as high as in normal controls and was
still considered as subnormal GH secretion. These indings
may indicate failure of PEM patients to obtain adequate GH response to stimulation with insulin-induced hypoglycemia, as also observed by Günöz et al.16 In CP patients, the condition may be related to a subnormal pituitary response,
which is evidenced by the signiicantly lower basal GH
level in our CP patients than in PEM patients, particularly if we consider the possibility of unrecognized nutritional
deiciency in the CP-R group. In addition, the CP-R group had signiicantly lower values of stimulated GH compared
to the REF group (p c = 0.04), and even CP-N children
failed to demonstrate a signiicant rise in GH levels (≥ 10
ng/mL) and presented lower peak GH levels than normal controls. Moreover, the percentage of cases reaching GH
level ≥ 10 ng/mL after stimulation with insulin was lower in
CP-N and CP-R groups than in the REF group (p c = 0.06, and p c < 0.001 respectively). This subnormal GH secretion seems to be logical, as severe brain damage in CP may affects a number of neurotransmitter pathways involved in GH control.1
Regarding IGF-1 values, we found signiicantly lower
IGF-1 levels in CP-R children compared to normal controls, which was also observed in other studies1,17-19where CP in children was associated with lower IGF-1 levels. Moreover, similarly to other studies,20 signiicantly lower IGF-1 levels were observed in the PEM group compared to controls. The decrease in protein and energy intake, adipose tissue, and serum IGF-1 levels in children with PEM may result in decreased leptin secretion, which may initiate food intake by increasing appetite and stimulating the secretion of cortisol
and GH, with signiicant elevation of basal GH levels.15
Furthermore, our indings were supported by Hayashi
et al.,21 who reported that spastic type CP patients showed subnormal responses to GH releasing factor, although their somatomedin C was normal, and concluded that spastic type CP was associated with reduced pituitary reserve of GH. In addition, GH therapy enhanced growth of a stunted female
child with CP even without documented GH deiciency; thus, GH treatment might be beneicial for children with CP.6
This study showed some discrepancy between GH and IGF-1 levels. The group of PEM patients had higher
basal GH levels in spite of having signiicantly lower IGF-1
levels compared to CP-N and REF groups. Similarly, the CP-R group had a lower IGF-1 level than the CP-N group,
regard to basal or stimulated GH levels. This discrepancy may be explained if we consider the different factors that
regulate IGF-1 expression, including hormonal inluence
(GH),22 tissue responsiveness to GH,23 and nutritional factors.24 Malnutrition-induced peripheral GH resistance may be responsible, at least partially, for reduced IGF-1 levels in PEM patients. In addition, nutritional status is a critical factor that modulates the responsiveness of the tissues, especially the liver, to GH and the resulting production of IGF-1.25 Therefore, IGF-1 levels of the CP-N group and normal controls were almost similar, which may be related to better nutritional status and more adequate food intake in the CP-N group than in the CP-R group, while those of CP-R and PEM groups were also similar, most probably due to underlying coexistent
signiicant nutritional deiciency in the CP-R group that
remained unrecognized and resembled the condition of
pure nutritional deiciency in patients with PEM. Although
we tried to include CP patients with estimated energy and protein intakes above the recommended daily allowances of energy and protein for children aged 1-3 years to exclude the nutritional factor for growth retardation, it seemed
that CP-R patients had coexistent nutritional deiciency,
which may be explained by a possible overestimation of food intake by their parents, as we relied on a 3-day diet recall to estimate energy and protein intake. This was also observed in other studies showing that parents’ perception of their CP child’s nutrition was usually not as accurate as they thought.26
Finally, it is worth to mention that our study is unique with respect to assessment of GH/IGF-1 axis as a possible non-nutritional factor for growth retardation in young children below 2 years of age with CP in comparison to PEM children who presented a model for
growth retardation related to isolated nutritional deiciency.
This allowed us to see the difference in GH/IGF-1 axis between groups more clearly and better than if this axis was studied in CP children compared to healthy controls alone. So, if growth retardation in CP was related only to nutritional factors, the changes in GH/IGF-1 axis would have been exactly the same as in the PEM group, but the differences observed between CP and PEM children pointed to abnormalities in this axis.
Conclusions
CP-R patients failed to demonstrate the same high basal GH response as PEM patients and responded inadequately to the insulin stimulation test, but they had IGF-1 levels comparable to those of PEM patients. On the other hand, CP-N patients behaved as normal controls regarding their basal GH and IGF-1 levels, but failed to respond to the insulin stimulation test as adequately as normal controls. The PEM group presented high basal GH and low IGF-1
levels. These indings suggest non-nutritional factors as
contributing factors for growth retardation in CP children and may promote further widespread multicenter trials that use GH or IGF-1 to help in the management of growth retardation in children with CP, which can certainly improve their overall health status.
References
1. Devesa J, Casteleiro N, Rodicio C, López N, Reimunde P. Growth
hormone deiciency and cerebral palsy. Ther Clin Risk Manag. 2010;6:413-8.
2. Stevenson RD, Conaway M, Chumlea WC, Rosenbaum P, Fung EB, Henderson RC, et al. Growth and health in children with moderate-to-severe cerebral palsy. Pediatrics. 2006;118:1010-8.
3. Stevenson RD, Roberts CD, Vogtle L. The effects of non-nutritional factors on growth in cerebral palsy. Dev Med Child Neurol. 1995;37:124-30.
4. Clayton PE, Hall CM. Insulin-like growth factor I levels in healthy children. Horm Res. 2004;62:2-7.
5. Coniglio SJ, Stevenson RD. Growth hormone deiciency in two children with cerebral palsy. Dev Med Child Neurol. 1995;37:1013-5.
6. Shim ML, Moshang T Jr, Oppenheim WL, Cohen P. Is treatment with growth hormone effective in children with cerebral palsy? Dev Med Child Neurol. 2004;46:569-71.
7. Coniglio SJ, Stevenson RD, Rogol AD. Apparent growth hormone deiciency in children with cerebral palsy. Dev Med Child Neurol. 1996;38:797-804.
8. Palisano R, Rosenbaum P, Walter S, Russell D, Wood E, Galuppi B. Development and reliability of a system to classify gross motor function in children with cerebral palsy. Dev Med Child Neurol. 1997;39:214-23.
9. de Onis M, Habicht JP. Anthropometric reference data for international use: recommendations from a World Health Organization Expert Committee. Am J Clin Nutr. 1996;64:650-8.
10. Nutrition Institute. Food composition tables for Egypt. Cairo: Cairo University; 1996.
11. Heird WC. Nutritional requirements. In: Kliegman RM, Stanton B, St. Geme J, Schor N, Behrman RE, eds. Nelson textbook of pediatrics. Philadelphia, PA: W. B. Saunders; 2010. p.153-7. 12. Parks JS. Hypopituitarism. In: Kliegman RM, Stanton B, St. Geme
J, Schor N, Behrman RE, eds. Nelson textbook of pediatrics. Philadelphia, PA: W. B. Saunders; 2010. p. 1847-53.
13. Amundson JA, Sherbondy A, Van Dyke DC, Alexander R. Early identiication and treatment necessary to prevent malnutrition in children and adolescents with severe disabilities. J Am Diet Assoc. 1994;94:880-3.
14. Gianotti L, Lanfranco F, Ramunni J, Destefanis S, Ghigo E, Arvat E. GH/IGF-I axis in anorexia nervosa. Eat Weight Disord. 2002;7:94-105.
15. Kilic M, Taskin E, Ustundag B, Aygun AD. The evaluation of serum leptin level and other hormonal parameters in children with severe malnutrition. Clin Biochem. 2004;37:382-7.
16. Günöz H, Neyzł O, Sencer E, Molvalilar S, Argun A. Growth hormone secretion in protein energy malnutrition. Acta Paediatr Scand. 1981;70:521-6.
17. Ali O, Shim M, Fowler E, Cohen P, Oppenheim W. Spinal bone mineral density, IGF-1 and IGFBP-3 in children with cerebral palsy. Horm Res. 2007;68:316-20.
18. Hamza RT, Ismail MA, Hamed AI. Growth hormone deiciency
19. Kuperminc MN, Gurka MJ, Houlihan CM, Henderson RC, Roemmich JN, Rogol AD, et al. Puberty, statural growth, and growth hormone release in children with cerebral palsy. J Pediatr Rehabil Med. 2009;2:131-41.
20. Haspolat K, Ece A, Gürkan F, Atamer Y, Tutanç M, Yolbaş I. Relationships between leptin, insulin, IGF-1 and IGFBP-3 in children with energy malnutrition. Clin Biochem. 2007;40:201-5.
21. Hayashi Y, Shiraishi T, Tani J, Araki K, Kurashige T. Pituitary reserve of growth hormone in adolescent patients with cerebral palsy and mental retardation. No To Hattatsu. 1989;21:239-44.
22. Benbassat C, Shoba LN, Newman M, Adamo ML, Frank SJ, Lowe WL Jr. Growth hormone-mediated regulation of insulin-like growth factor I promoter activity in C6 glioma cells. Endocrinology. 1999;140:3073-81.
23. Rabkin R. Nutrient regulation of insulin-like growth factor-I. Miner Electrolyte Metab. 1997;23:157-60.
24. Stein K, Vasquez-Garibay E, Kratzsch J, Romero-Velarde E, Jahreis G. Inluence of nutritional recovery on the leptin axis in severely malnourished children. J Clin Endocrinol Metab. 2006;91:1021-6.
Correspondence:
Moustafa A Hegazi, associate professor of Pediatrics Mansoura University Children’s Hospital
El-Gomhoria St.
PO 35516 - Mansoura - Egypt Tel.: +20 (100) 102.0941 Fax: +20 (50) 223.4092
E-mail: [email protected]
25. Naranjo WM, Yakar S, Sanchez-Gomez M, Perez AU, Setser J, LeRoith D. Protein calorie restriction affects nonhepatic IGF-I production and the lymphoid system: studies using the
liver-speciic IGF-I gene-deleted mouse model. Endocrinology. 2002;143:2233-41.