ANA PAULA OLIVEIRA FAVRETTO
Regression Models to Assess the Thermal Performance of Brazilian
Low-Cost Houses: consideration of opaque envelope
Thesis submitted to the Institute of
Architecture and Urbanism -
University of São Paulo, São Carlos to
obtain the Master of Science degree.
Concentration Area: Architecture,
Urbanism, and Technology
Advisor:
Prof. Dr. Karin M. S. Chvatal
Sponsor Agencies:
São Paulo Research Foundation
(FAPESP)
National Counsel of Technological
and Scientific Development (CNPq)
(Versão Corrigida)
I AUTHORIZE TOTAL OR PARTIAL REPRODUCTION OF THIS WORK BY ANY CONVENTIONAL OR ELECTRONIC MEANS, FOR RESEARCH PURPOSES, SO LONG AS THE SOURCE IS CITED.
Favretto, Ana Paula Oliveira
F277r Regression models to assess the termal performance
of Brazilian low-cost houses : consideration of opaque envelope /Ana Paula Oliveira Favretto ; advisor Karin Maria Soares Chvatal. – São Carlos, 2016.
Thesis (MA) – Graduate Program in Architecture and Urbanism and Concentration Area in Architecture, Urbanism and Technology – Institute of Architecture and Urbanism of São Carlos University of São Paulo, 2016.
1. Thermal comfort. 2. Building performance
DEDICATION
To God, Who grants the wisdom.
ACKNOWLEDGEMENTS
I would like to express my sincere and heartfelt thanks: To God
To my parents Aparecida and Valmor, to my sisters Fernanda and Débora for their unconditional support
To Professor Karin M. S. Chvatal for always been providing excellent guidance and support throughout my whole career training as a researcher, since the undergraduate years.
To Professors S. Ranji Ranjithan, Joseph F. DeCarolis, Soolyeon Cho, and David Hill from North Carolina State University (NCSU), Raleigh for their guidance and support during the whole development of this research, and for their welcoming reception during the internship period abroad.
To the graduate NCSU students: Yifan Yang for collaborating with the development of the programming codes, Jeffrey Thomas for collaborating with the regression analysis, and Sedighehsadat (Nasim) Mirianhosseinabadi for the contributions during the first stages of this research;
To the São Paulo Research Foundation (FAPESP), for the financial support through the National and BEPE scholarships (grants #2013/16628-9 and #2014/09226-4);
To the National Counsel of Technological and Scientific Development (CNPq) for the financial support during the first eleven months of the research;
To the Institute of Architecture and Urbanism of the University of São Paulo (IAU|USP|São Carlos) and all professors and staff that directly or indirectly contributed to the development of this research. In special to the staff member Pedro H. S. Mattia, and to professors Kelen A. Dornelles;
To the fellows and friends from the ArqTema research team, in special to Michele Marta Rossi, Rosilene R. Brugnera, Kamila Mendonça, Marieli Lukiantchuki, Caroline Santesso and Hector Marin;
To Marcelo Suzuki Arquitetura, Boldarini Arquitetos Associados, MMBB Arquitetura e Urbanismo, Lotufo Engenharia, Companhia de Habitação Popular (COHAB) of Curitiba/PR in the person of Roberta Gehr, Caixa Econômica Federal – MT in the person of Kátia Alves Barcelos, and Sirlene Cheriato for contributing with the collection of low-cost house (LCH) designs that underlies the geometry addressed in this research.
ABSTRACT
FAVRETTO, A. P. O. Regression Models to Assess the Thermal Performance of Brazilian Low-Cost Houses: consideration of opaque envelope. 2016. 132 p. Thesis (Master of Science) – Institute of Architecture and Urbanism, University of São Paulo, São Carlos, 2016.
This study examines the potential to conduct building thermal performance simulation (BPS) of unconditioned low-cost housing during the early design stages. By creating a set of regression models (meta-models) based on EnergyPlus simulations, this research aims to promote and simplify BPS in the building envelope design process. The meta-models can be used as tools adapted for three Brazilian cities: Curitiba, São Paulo and Manaus, providing decision support to designers by enabling rapid feedback that links early design decisions to the building’s thermal performance. The low-cost housing unit studied is a detached one-story house with an area of approximately 51m2, which includes two bedrooms, a combined kitchen and living room, and one bathroom. This representative configuration is based on collected data about the most common residence options in some Brazilian cities. This naturally ventilated residence is simulated in the Airflow Network module in EnergyPlus, which utilizes the average wind pressure coefficients provided by the software. The parametric simulations vary the house orientation, U-value, heat capacity and absorptance of external walls and the roof, the heat capacity of internal walls, the window-to-wall ratio, type of window (slider or casement), and the existence of horizontal and/or vertical shading devices with varying dimensions. The models predict the resulting total degree-hours of discomfort in a year due to heat and cold, based on comfort limits defined by the adaptive method for naturally ventilated residences according to ANSI ASHRAE – Standard 55. The methodology consists of (a) analyzing a set of Brazilian low-cost housing projects and defining a geometric model that can represent it; (b) determining a list of design parameters relevant to thermal comfort and defining value ranges to be considered; (c) defining the input data for the 10.000 parametric simulations used to create and test the meta-models for each analyzed climate; (d) simulating thermal performance using Energy Plus; (e) using 60% of the simulated cases to develop the regression models; and (f) using the remaining 40% data to validate the meta-models. Except by Heat discomfort regression models for the cities of Curitiba and São Paulo the meta-models show R2 values superior to 0.9 indicating accurate predictions when compared to the discomfort predicted with the output data from EnergyPlus, the original simulation software. Meta-models application tests are performed and the meta-models show great potential to guide designers’ decisions during the early design.
RESUMO
FAVRETTO, A. P. O. Modelos de regressão para avaliação do desempenho térmico de habitações de interesse social: considerações da envolvente opaca. 2016. 132p. Dissertação (Mestrado) – Instituto de Arquitetura e Urbanismo, Universidade de São Paulo, São Carlos, 2016.
Esta pesquisa avalia as potencialidades do uso de simulações do desempenho térmico (SDT) nas etapas iniciais de projetos de habitações de interesse social (HIS) não condicionadas artificialmente. Busca-se promover e simplificar o uso de SDT no processo de projeto da envolvente de edificações através da criação de modelos de regressão baseados em simulações robustas através do software EnergyPlus. Os meta-modelos são adaptados ao clima de três cidades brasileiras: Curitiba, São Paulo e Manaus, e permitem uma rápida verificação do desconforto térmico nas edificações podendo ser usados como ferramentas de suporte às decisões de projeto nas etapas iniciais. A HIS considerada corresponde a uma unidade térrea com aproximadamente 51m2, composta por dois quartos, um banheiro e cozinha integrada à sala de jantar. Esta configuração é baseada em um conjunto de projetos representativos coletados em algumas cidades brasileiras (como São Paulo, Curitiba e Manaus). Estas habitações naturalmente ventiladas são simuladas pelo módulo Airflow Network utilizando o coeficiente médio de pressão fornecido pelo EnergyPlus. As simulações consideram a parametrização da orientação da edificação, transmitância térmica (U), capacidade térmica (Ct) e absortância (α) das paredes externas e cobertura; Ct e U das paredes internas; relação entre área de janela e área da parede; tipo da janela (basculante ou de correr); existência e dimensão de dispositivos verticais e horizontais de sombreamento. Os meta-modelos desenvolvidos fornecem a predição anual dos graus-hora de desconforto por frio e calor, calculados com base nos limites de conforto definidos pelo método adaptativo para residências naturalmente ventiladas (ANSI ASHRAE, 2013). A metodologia aplicada consiste em: (a) análise de um grupo de projetos de HIS brasileiras e definição de um modelo geométrico que os represente; (b) definição dos parâmetros relevantes ao conforto térmico, assim como seus intervalos de variação; (c) definição dos dados de entrada para as 10.000 simulações paramétricas utilizadas na criação e teste de confiabilidade dos meta-modelos para cada clima analisado; (d) simulação do desempenho térmico por meio do software EnergyPlus; (e) utilização de 60% dos casos simulados para o desenvolvimento dos modelos de regressão; e (f) uso dos 40% dos dados restantes para testar a confiabilidade do modelo. Exceto pelos modelos para predição do desconforto por calor para Curitiba e São Paulo, os demais meta-modelos apresentaram valores de R2 superiores a 0.9, indicando boa adequação das predições de desconforto dos modelos gerados ao desconforto calculado com base no resultado das simulações no EnergyPlus. Um teste de aplicação dos meta-modelos foi realizado, demonstrando seu grande potencial para guiar os projetistas nas decisões tomadas durante as etapas inicias de projeto.
TABLE OF CONTENTS
DEDICATION ... 5
!
ACKNOWLEDGEMENTS ... 7
!
ABSTRACT ... 9
!
RESUMO ... 11
!
LIST OF TABLES ... 17
!
LIST OF FIGURES ... 19
!
LIST OF ABBREVIATIONS, ACRONYMS AND SYMBOLS ... 21
!
1.
!
INTRODUCTION ... 23!
2.
!
OBJECTIVES ... 27!
3.
!
LITERATURE REVIEW ... 29!
3.1.
!
THERMAL COMFORT AND BUILDING ENVELOPE IN LOW-COST HOUSES ... 29!
3.1.1.
!
BASIC CONCEPTS ... 29!
3.1.2.
!
ARCHITECTURAL DESIGN AND BUILDING THERMAL PERFORMANCE ... 32!
3.1.3.
!
THE IMPACT OF BUILDING ENVELOPE THERMO-PHYSICAL PROPERTIES ON INDOOR THERMAL CONDITIONS ... 34!
3.2.
!
OPAQUE BUILDING ENVELOPE THERMO-PHYSICAL PROPERTIES GUIDELINES ON NATIONAL STANDARDS AND TECHNICAL REGULATIONS ... 37!
3.2.1.
!
NBR15220 – BUILDING THERMAL PERFORMANCE /“DESEMPENHO TÉRMICO DE EDIFICAÇÕES” ... 37!
3.2.2.
!
NBR 15575: RESIDENTIAL BUILDINGS – PERFORMANCE / “EDIFICAÇÕES HABITACIONAIS – DESEMPENHO” ... 38!
3.2.3.
!
ENERGY EFFICIENCY TECHNICAL REQUISITES FOR RESIDENCIAL BUILDING PERFORMANCE/ ‘RTQ-R REGULAMENTO TÉCNICO DA QUALIDADE PARA O NÍVEL DE EFICIÊNCIA ENERGÉTICA EM EDIFICAÇÕES RESIDENCIAIS’ ... 39!
3.2.4.
!
NBR 15220, NBR15575, AND RTQ-R COMPARISON AND DISCUSSION ... 41!
3.3.1.
!
INTEGRATING BUILDING PERFORMANCE SIMULATION INTO DESIGNPROCESS: CHALANGES AND OPPORTUNITES ... 42
!
3.3.2.
!
THE USE OF REGRESSION META-MODELS TO ASSESS BUILDING PERFORMANCE DURING THE EARLY DESIGN STAGES ... 43!
3.4.
!
ANSI ASHRAE STANDARD 55 - ADAPTIVE MODEL AND DEGREE-HOUS OF DISCOMFORT ... 46!
4.
!
METHOD ... 49!
4.1.
!
DESIGN PROBLEM DEFINITION ... 50!
4.1.1.
!
BASE MODEL ... 50!
4.1.1.1.
!
LOCATIONS ... 51!
4.1.1.2.
!
GEOMETRY DEFINITION ... 53!
4.1.1.3.
!
INTERNAL GAINS ... 55!
4.1.1.4.
!
VENTILATION SETUP ... 57!
4.1.1.5.
!
GROUND TEMPERATURE ... 58!
4.1.1.6.
!
SHADING DEVICES ... 59!
4.1.1.7.
!
THERMAL ZONE INPUT METHOD ... 59!
4.1.1.8.
!
MATERIAL AND CONSTRUCTION INPUT METHOD ... 63!
4.1.2.
!
KEY DESIGN PARAMETER RANGES ... 70!
4.1.3.
!
BUILDING DESIGN SPACE OVERVIEW ... 72!
4.2.
!
MONTE CARLO SIMULATION ... 73!
4.2.1.
!
SAMPLING/SUBSTITUTION ROUTINES ... 73!
4.2.2.
!
ENERGYPLUS SIMULATION ... 74!
4.2.2.1.
!
POST-PROCESSING DATA: PARAMETER DOMAINS AND PERFORMANCE METRICS ... 74!
4.3.
!
MULTIVARIATE REGRESSION ... 74!
5.
!
RESULTS AND ANALYSIS ... 77!
5.1.
!
GENERAL TECHNIQUE ... 77!
5.2.
!
CHALLENGES AND SOLUTIONS ... 77!
5.4.
!
META-MODEL APPLICATION TEST ... 85!
6.
!
CONCLUSIONS ... 91!
6.1.
!
FURTHER WORK ... 92!
7.
!
BIBLIOGRAPHY ... 93!
APPENDIX 01- CURITIBA/PR: META-MODEL COEFFICIENTS – DEGREE-HOURS OF DISCOMFORT BY COLD (STANDARD APPROACH WITH REGRESSION FLOOR) ... 99
!
APPENDIX 02 - CURITIBA/PR: META-MODEL COEFFICIENTS – DEGREE-HOURS OF DISCOMFORT BY HEAT (STANDARD APPROACH WITH REGRESSION FLOOR) ... 105
!
APPENDIX 03 - CURITIBA/PR: META-MODEL COEFFICIENTS – DEGREE-HOURS OF DISCOMFORT BY HEAT (NON-ZERO APPROACH WITH REGRESSION FLOOR) ... 109
!
APPENDIX 04 - SÃO PAULO/SP: META-MODEL COEFFICIENTS – DEGREE-HOURS OF DISCOMFORT BY COLD (STANDARD APPROACH WITH REGRESSION FLOOR) ... 113
!
APPENDIX 05 - SÃO PAULO/SP: META-MODEL COEFFICIENTS – DEGREE-HOURS OF DISCOMFORT BY HEAT (STANDARD APPROACH WITH REGRESSION FLOOR) ... 119
!
APPENDIX 06 - SÃO PAULO/SP: META-MODEL COEFFICIENTS – DEGREE-HOURS OF DISCOMFORT BY HEAT (NON-ZERO APPROACH WITH REGRESSION FLOOR) ... 123
!
LIST OF TABLES
Table 1: Building envelope constructive guideline provided by NBR 15220 ... 38
!
Table 2: Building envelope constructive guideline provided by NBR 15575 ... 39
!
Table 3: RTQ-R solar absorptance, U-value and heat capacity prerequisites according to the bioclimatic zone (Adapted from INMETRO, 2012) ... 40
!
Table 4. Comparative of wall thermal performance strategies from NBR 15220, NBR 15575, and RTQ-R (Adapted from MARQUES, 2013). ... 41
!
Table 5. Comparative of wall thermal performance strategies from NBR 15220, NBR 15575, and RTQ-R (Adapted from MARQUES, 2013). ... 42
!
Table 6: Windows dimensions and effective ventilation area ... 54
!
Table 7. Doors dimensions ... 54
!
Table 8: Lighting power density installed (Adapted from INMETRO, 2012) ... 57
!
Table 9: Human metabolic rate (Adapted from INMETRO, 2012) ... 57
!
Table 10: Internal loads from electric equipment (Adapted from INMETRO, 2012). ... 57
!
Table 11: Ground Temperatures ... 58
!
Table 12: Overview of the analyzed cases in the zone-modeling test ... 61
!
Table 13: Floor and doors thermal properties ... 64
!
Table 14: Glass properties ... 64
!
Table 15: Roof and wall virtual material properties ... 65
!
Table 16: Overview of the analyzed cases in the virtual construction test ... 66
!
Table 17: Key design parameter and their correspondent value range ... 70
!
Table 18: Building design space overview ... 72
!
Table 19: Number of terms of the regressions for Curitiba – PR. ... 79
!
Table 20: Number of terms related to opaque envelope parameters in the regressions for Curitiba – PR. ... 79
!
Table 21: Number of terms and R2 of the regressions for São Paulo - SP. ... 80
!
Table 22: Number of terms related to opaque envelope parameters in the regressions for São Paulo - SP. ... 80
!
Table 24: Number of terms related to opaque envelope parameters in the regressions for
Manaus – AM. ... 81
!
Table 25: Result error analysis ... 82
!
Table 26: Overview of the meta-model application test ... 85
!
LIST OF FIGURES
Figure 1: Effectiveness of design decision during the life of building (Source: LECHNER, 2014).32
!
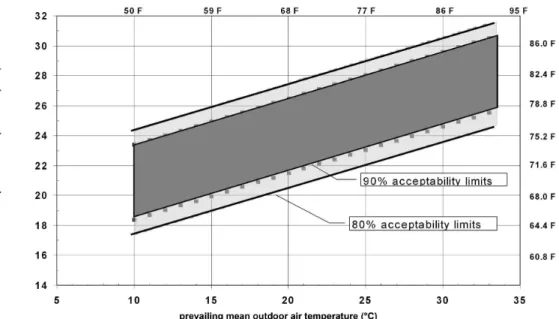
Figure 2. Acceptable operative temperature (to) ranges for naturally conditioned spaces.
Source: ASHRAE Standard 55 (ANSI/ASHRAE, 2013) ... 47
!
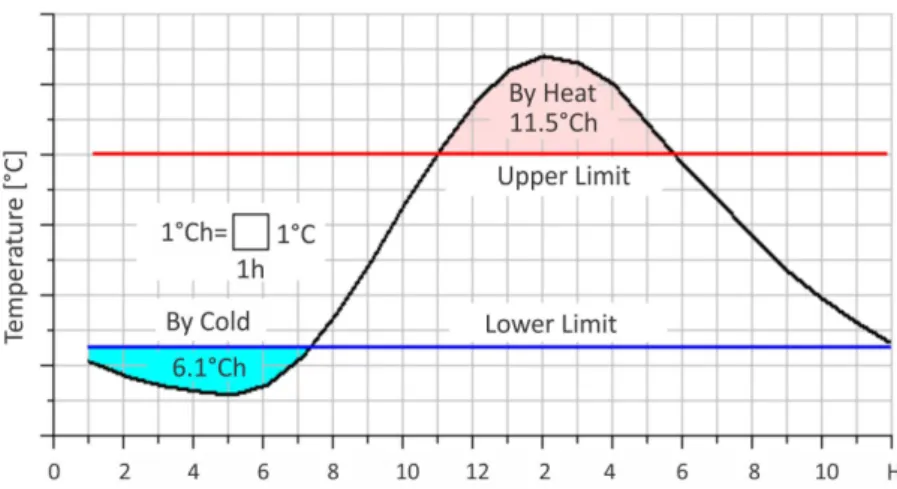
Figure 3: Degree-hours of discomfort calculation example. (Source: RORIZ; CHVATAL; CAVALCANTI, 2009) ... 48
!
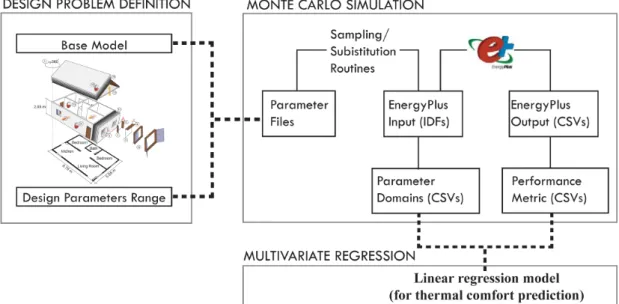
Figure 4: Method overview ... 50
!
Figure 5: Location of the considered cities in Brazil ... 51
!
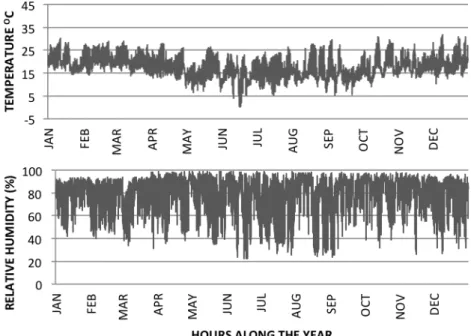
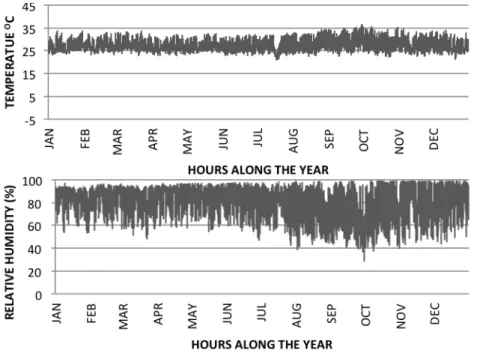
Figure 6: Curitiba/PR hourly temperature and relative humidity during a year based on EPW
data file from RORIZ, 2012 ... 52
!
Figure 7: São Paulo/ SP hourly temperature and relative humidity during a year based on EPW
data file from RORIZ 2012 ... 52
!
Figure 8: Manaus/AM hourly temperature and relative humidity during a year based on EPW
data file from RORIZ 2012 ... 53
!
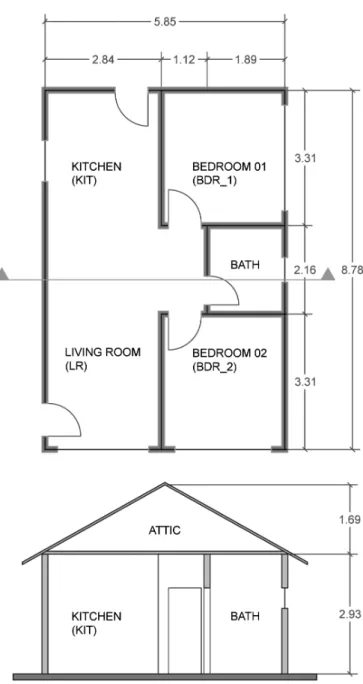
Figure 9: Model floor plan and section ... 55
!
Figure 10: Human occupation schedule for week days (Adapted from INMETRO, 2012). ... 56
!
Figure 11: Human occupation schedule for weekend days (Adapted from INMETRO, 2012). . 56
!
Figure 12: Lighting use in week days (Adapted from INMETRO, 2012) ... 56
!
Figure 13: Lighting use in weekend days (Adapted from INMETRO, 2012) ... 56
!
Figure 14. (a) Single and (b) Multi-zone modeling approach; in this scheme each color
represents a thermal zone. ... 60
!
Figure 15. Building orientation scheme ... 61
!
Figure 16: Annual average hourly air temperature (A) and operative temperature (B)
differences between SZM and each long-stay room of MZM. Source:: FAVRETTO et
al., 2015 ... 62
!
Figure 17: Annual average difference between SZM and MZM in hourly of discomfort by heat
(A) and cold (B). Source:: FAVRETTO et al., 2015 ... 62
!
Figure 18: Distribution of hourly absolute difference between the operative temperature
predicted by SZM and MZM over the course of a year. ... 63
!
Figure 20: Virtual construction test series scheme ... 66
!
Figure 21: Operative temperature scatterplots of the real material detailed input model
predictions against the virtual material input model predictions for Curitiba/PR. .... 67
!
Figure 22: Operative temperature scatterplots of the real material detailed input model
predictions against the virtual material input model predictions for São Paulo/SP. . 68
!
Figure 23: Operative temperature scatterplots of the real material detailed input model
predictions against the virtual material input model predictions for Manaus/ AM. .. 68
!
Figure 24: Comparison between the temperature variation during a winter day for the virtual
and detailed construction models ... 69
!
Figure 25: Comparison between the operative temperature variation during a summer day
for the virtual and detailed construction models ... 69
!
Figure 26: Overview of the variable parameters. ... 71
!
Figure 27: Validation of the discomfort by cold and by heat regression models. Lines represent
perfect agreement between the result from EnergyPlus (vertical axis) and
prediction by regression models (horizontal axis) ... 83
!
Figure 28: Validation of the discomfort by heat regression models with two data sets: NZ
VALUES ONLY excluding the 0 values from the validation set, and ALL VALUES that
include the 0 values. Lines represent perfect agreement between the result from
EnergyPlus (vertical axis) and prediction by regression models (horizontal axis) ... 84
!
Figure 29: Meta-model application test results of cases 1 to 24 for São Paulo and Curitiba –
discomfort by cold – and for Manaus – discomfort by heat. ... 87
!
Figure 30: Heat discomfort predicted for cases 1 to 12 in São Paulo and cases 13 to 24 in
LIST OF
ABBREVIATIONS, ACRONYMS AND SYM
BOL
S
!!: Thermal resistances of outer air film
!!: Thermal resistances of inner air film
!!: Ambient to ambient total thermal resistance
!!: Surface to surface thermal resistance
BPS: Building performance simulation (BPS) c: Specific heat
DHC: Degree-hours of discomfort by cold during a year DHH: Degree-hours of discomfort by heat during a year HC: Heat capacity
l: Thickness
LCH: Low-cost houses OE: Opaque envelope r: Reflectivity
R: Thermal resistance
U-value: Thermal transmittance α: Solar absorptance
λ: Thermal conductivity
1.
INTRODUCTION
The search for mechanisms to promote and ensure live quality has been occurring throughout the history of civilization. The building of shelters against bad weather conditions or other threats and the implementation of thermal comfort strategies to these buildings is an example of that. The basic definition of thermal comfort from ANSI ASHRAE (1966) points out that it is a condition of mind in which someone expresses satisfaction with the thermal environment.
A building enclosure and its components should be designed to provide a comfortable and protected indoor environment. The building envelope acts as a ‘filter’ between the outdoor environment and the indoor space. Although the main task of the building envelope is environmental, only recently it has begun to attract due attention; Primary emphasis on the appearance, that is, the visual function of the building envelope, is a practice that is relatively common in building design (ATHIENITIST; SANTAMOURIS, 2002). When it comes to low-cost houses (LCH), which rarely count with artificial conditioning systems due to the low financial resources applied during the building and maintenance stages, the building envelope plays an important role concerning their thermal performance. As Brazilian LCH design counts with small glazing area, this research focuses on building opaque envelope (OE) thermo physical properties that affect the heat transfer between indoor and outdoor: thermal transmittance (U-value), heat capacity (HC), and solar absorptance (α). Numerous researches have been investigating these properties and their conjugated impact on thermal performance has been highlighted; also, the opaque envelope (OE) behavior has been linked to the peculiarities of each climate.
assess thermal comfort in Brazilian LCH in different climates (CHVATAL, 2014; LUCAS et al., 2011; MARQUES, 2013; MORENO; SOUZA, 2011; SCHWONKE et al., 2011; TRIANA; LAMBERTS, 2013), highlighting the importance of specific considerations and pointing out the relevance of the conscientious building design process.
In1945 Villanova Artigas, a great icon of the Brazilian modern architecture, used a letter to a client to highlight the importance of the design process to ensure constructions quality and economic viability (FERRAZ et al., 1997), and over the years the importance of design has been reaffirmed. Certainly, the advances in building performance simulation (BPS) tools, allowing building performance to be evaluated before construction, contribute to it.
Thermal analysis BPS tools have the potential to foresee how a design alternative will respond to the outdoor temperature variation. Therefore, they may provide quantitative information to guide the building design process. Because the early design stage allows more flexibility to generate design alternatives, this is the period when the decisions have the most impact on the overall building performance. Then, if applied during the conceptual design stage the potential of such tools is increased. However, BPS tools are mainly used in final stages to analyze a single design alternative, usually for code compliance checking (HENSEN et al., 2004; HOBBS et al., 2003; HYGH et al., 2012; MORBITZER, 2003; RIZOS, 2007; STRUCK; HENSEN; KOTEK, 2009).
The underutilization of BPS during early design results, among others, from the lack of tools appropriate to this stage (HOBBS et al., 2003). According to Hygh et al. (2012) and Rizos (2007), to characterize the buildings for simulation modeling the user must provide a lot of technical specifications, and most of them are defined only when the design approaches the final stages. Due to the high complexity of BPS software, such as Energy Plus, the simulation process demands a lot of time from an expert user, increasing the design cost and contributing to the unexpressive use of these tools by the design team (WESTPHAL, 2007). Therefore, it is still inaccessible in designs that count with low financial investment, as the LCH (MARQUES; CHVATAL, 2011).
software (e.g., Energy Plus). Once obtained, the regression models may work independently of the detailed performance software and its accuracy can be statistically determined and optimized. Standard documents such as building envelope trade-off option from ANSI ASHRAE 90.1 (2007), RTQ-C (INMETRO, 2010) and RTQ-R (INMETRO, 2012) use this kind of approach to evaluate whether the final design is in accordance with some predefined quality parameters.
2.
OBJECTIVES
General:
• To develop regression models for thermal discomfort prediction in naturally ventilated low-cost houses, within three Brazilian climates, during the early design stage.
Specific:
To contribute with the assessment of the opaque envelope thermo-physical properties conjugated impact on the thermal discomfort in Brazilian low-cost houses;
3.
LITERATURE REVIEW
3.1. THERMAL COMFORT AND BUILDING ENVELOPE IN LOW-COST HOUSES
3.1.1. BASIC CONCEPTS
According to the Brazilian building energy efficiency regulation (Energy efficiency technical requisites for residential building performance - INMETRO 2012) the building envelope is defined by a set of planes that configure a boundary between outdoor and indoor environment such as facades, gables, roofing, openings and other elements with the exception of the floor. The building envelope combines two classes of elements: transparent (windows, glazed areas, openings, etc.); and opaque (walls, slabs, roofs, etc.). The building envelope can be considered as a ‘filter’ that intermediates the heat transfer among others interactions between indoor and outdoor space. When considering low-cost houses (LCH), which have small area of transparent elements, the building opaque envelope (OE) shows major impact on thermal comfort allowing numerous design strategies exploration.
“Heat transfer (or heat) is energy in transit due to a temperature difference” (INCROPERA; DEWITT, p2, 1996). The heat transfer between the indoor and outdoor environments occurs as a consequence of a temperature gradient, and its flux goes from the higher to lower temperature medium (id. ibid). To control the temperature of a specific space the mechanism by which heat is gained and lost must be understood and, as far as possible, quantified (HALL; ALLINSON, 2010).
THERMAL TRANSMITTANCE (U-value)
The U-value is the inverse of the OE ambient to ambient total thermal resistance determined by equations 01 to 04 from NBR15220 (ABNT, 2005).
! = !
!!!!!!!!!!!!!!!!!!!!!!!!!!!!!!!!!!!!!!!!!!!!!!!!!!!!!!!!!!!!!!(!"#$%&'(!01)
where:
R: homogeneous layer thermal resistance in (m2.K/W); !: layer thickness in meter;
λ: material thermal conductivity: Physic property of a homogeneous and isotropic material,
which presents a constant heat flux, with density of 1W/m2, when subjected to a uniform gradient temperature of 1 Kelvin per meter - Considered units: W/(m.K).
!!=!!!"+!!!+!!!+⋯+!!!"+!!"#!+!!"#!+⋯+!!"#$!!!!!!!!!!!!(!"#$%&'(!02)
where:
!!!+!!!+⋯+!!!",:" "" are the thermal resistance of the n homogeneous layers (m2.K/W) calculated with equation 01;
!!"#!+!!"#!+⋯+!!"#$,: are the thermal resistance of the n air layers (m2.K/W) according to NBR 15220 (INMETRO, 2005) tabulated data.
!!=!!+!!+!!!!!!!!!!!!!!!!!!!!!!!!!!!!!!!!!!!!!!!!!!!!!!!!!!!!(!"#$%&'(!03)
where:
!!: is the surface to surface thermal resistance, defined in equation 02 (m2.K/W). This property is related to conduction heat transfer mode;
!! and !!: are the thermal resistances of outer and inner air film (m2.K/W). This property is
related to convective and radiation heat transfer modes.
!"#$%&= 1
!!
!!!!!!!!!!!!!!!!!!!!!!!!!!!!!!!!!!!!!!!!!!!!!!!!!!!!!!!!!(!"#$%&'(!04)
where:
HEAT CAPACITY (HC)
HC is the Quotient of the heat quantity needed to vary the system temperature in one unit by the area of the component; it may be calculated using equation 05 (ABNT, 2005).
!"=! !!.!!.!!.!!=! !!.!!.!! !
!!!
!
!!!
!!!!!!!!!!!!!!!!!!!!!!!!!!!!!!!!!!!!!(!"#$%&'(!05)
where:
!!: is the material thermal conductivity of layer !;
!!: is the thermal resistance of layer !; !!: is the layer ! thickness;
!!: is the specific heat of layer ! material; !!: is the density of layer ! material.
SOLAR ABSORPTANCE (α)
From the total solar energy that reaches the OE part is reflected and other is absorbed and the coefficients of reflectivity (r), and absorptance (α) rule these processes; the equation 06 indicates the relation between these properties:
∝!+!!=1!!!!!!!!!!!!!!!!!!!!!!!!!!!!!!!!!!!!!!!!!!!!!!!!!!!!!!!!!!!"#$%&'!06
The α is calculated according to equations 07 (ABNT, 2005):
∝!=
!"#$%!!"#$"%$&'!!"#$%"&'!!"!!!!"#$%&'
3.1.2. ARCHITECTURAL DESIGN AND BUILDING THERMAL PERFORMANCE
The architectural design plays an important role concerning the building thermal performance. During early design stages designers have a great flexibility to propose and implement thermal comfort strategies. As design process approaches to the final stages just a few design parameters remain flexible, so the possibilities to solve problems are limited. Therefore, decisions taken during conceptual design generate the most significant impact on the final building performance.
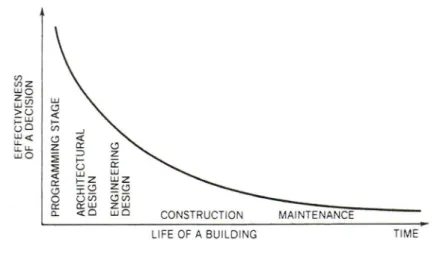
The Figure 1 illustrates the importance to make informed decisions during the early design stages, indicating the reduction in design decision effectiveness along the life of building stages.
Figure 1: Effectiveness of design decision during the life of building (Source: LECHNER, 2014).
The relevance of the early design stages on the final building performance highlight the importance of using quantitative information as guidance to designers. However, performance analyses are uncommon in architectural practice occurring for a few buildings that face engineering challenges or an explicitly focus on sustainability mostly after or at the final design stages (SCHLUETER; THESSELING, 2009).
Usually, architectural design decisions are based on general recommendations and qualitative information acquired from previews experiences. Although decisions based on these experiences may result in good quality buildings, the use of quantitative assessment methods greatly improves the design support, contributing with the building final performance (RAONI; PEDRINI, 2011).
thermal comfort assessment tools to guide the decision-making. In this sense, computational tools may be used to assist the design process (MARQUES; CHVATAL, 2011).
Concerning the sustainability, Gonçalves and Duarte (2006) point out the need of a design process supported by computational simulation tools. The authors indicate that to link the concepts of thermal comfort, energy efficiency and environmental issues building designers may consider, among others, (a) building wind and solar exposure; (b) internal zones; (c) environmental features; (d) and materials of the building structure and envelope – considering its colors and thermal performance. Together, these parameters have an influence on building thermal performance as they play an important role on the definition of design strategies regarding natural ventilation, shadings, reflection of the direct solar radiation, thermal inertia, and thermal insulation, etc. It is highlighted that the appropriate use of these strategies is defined accordingly to the environmental weather conditions and regulations concerning the building performance and the terrain use and occupancy. Oral, Yener, and Bayazit (2004) indicate that to achieve visual, acoustic, and thermal comfort in building envelope design two issues may be considered: (a) the outdoor environment with parameters that cannot be controlled by designers, such as weather conditions, wind, solar radiation, humidity, etc.; and (b) the built environment, whose parameters – encompassing the scales of the territory, building, indoor environments and components – can be controlled according to the human needs. Considering thermal comfort, the authors indicate that the envelope properties such as material thickness, density, specific heat; coefficients of conductivity, absorptance and reflectivity have a great impact and their influence is also combined with parameters from the other mentioned scales.
Kumar and Suman (2013) also point out that walls and roofs heat capacity and U-value properties have a great impact on naturally ventilated buildings’ indoor thermal comfort and on air-conditioned buildings’ cooling loads.
3.1.3. THE IMPACT OF BUILDING ENVELOPE THERMO-PHYSICAL PROPERTIES ON INDOOR THERMAL CONDITIONS
Determining the maximum building envelope U-value is a common practice among thermal performance standards and regulations of residential building performance in several countries; this concept indicates that thermal performance is always correlated to the insulation increase, which has been questioned in a series of researches.
D’Orazio, Perna and Giuseppe (2010) remark that European standards concerning building energy performance establish specific guidelines on thermal insulation to reduce winter energy consumption, while summer design strategies are described almost qualitatively. Climate differences are not considered and the building envelope insulation is regarded as the main strategy to control energy consumption. This approach encourages the use of materials and construction technologies that does not fit the traditional southern European building where the increase of insulation may negatively affect the indoor thermal conditions during the summer. Based on prototype monitoring in the Mediterranean climate – region near to Ancona, Italy – the authors point out that the insulation layer increase may reduce the effectiveness of traditional passive cooling strategies such as the attic ventilation. This behavior may be linked to the dissociation between the indoor thermal conditions and the roof external upper layer.
Chvatal and Corvacho (2009) also analyzed, through computational simulation, the impact of increasing the building envelope insulation on thermal performance of distinct building models located in Portugal and other Southern European countries. The results showed that the insulation increase does not always contribute to thermal comfort and energy efficiency and that with insulation addition the solar and internal gains must be closely controlled to avoid summer overheating. Considering Brazilian scenario Carlo and Lamberts (2008), and Roriz, Chvatal and Cavalcanti (2009) found similar results.
radiation absorbed by walls and roofs external surface. The author proposes, for Kuwait weather, a correlation between the maximum U-value and the solar absorptance coefficient for each building orientations (north, south, east, west, and roof). Chvatal (2014) also demonstrated the conjugated impact of U-value and solar absorptance on low-cost houses thermal comfort for winter and summer weather in three Brazilian cities (Curitiba/PR, São Paulo/SP, and Manaus/AM); highlighting that the best design alternative must be achieved balancing the winter and summer thermal needs and the combination of U-value and solar absorptance.
Cheng, Ng and Givoni (2005) analyzed the effect of building envelope color and thermal mass on the indoor thermal conditions of test cells built in the warm-humid climate of Hong Kong. The results show that the sensitivity of the envelope color on indoor thermal performance varies with thermal mass and global solar radiation - high solar radiation levels combined with lightweight building reaches more sensitivity. The use of light colors surfaces are indicated as a simple, effective and economical way to reduce indoor temperature in warm-humid climate. High mass building envelope also reduces the indoor maxima and - differently from the color effect - increases the indoor minima.
Also considering the outer envelope solar radiation absorption, Dornelles (2009) highlights that this kind of heat gain is responsible for a great amount of the building thermal loads, and its impact is primarily defined by the solar absorptance of the building envelope components. The solar absorptance data of different colors and wall paint types were obtained by reflectivity measurements. The results show that the color cannot be considered as the unique decisive parameter concerning the opaque surface absorptance. The lack of current and accurate data has been leading designers and researchers to consider visual perception and color based on tabulated data, strengthening the idea that the increase absorptance is only linked to darkening colors. The surface roughness is also explored, presenting linear relationship with the surface absorptance.
compositions. Also, a series of correlations considering these parameters are considered: window to floor ratio, nocturnal ventilation and peak internal temperature, surface of the heat transfer exposed mass, daytime ventilation, etc. The results show that greater thermal performance levels are achieved when different design strategies are combined rather than using only thermal inertia. Also, nocturnal ventilation is extremely indicated to high mass buildings, and shading strategies are very important in regard to extensive glazed that allows high levels of solar heat gains.
3.2. OPAQUE BUILDING ENVELOPE THERMO-PHYSICAL PROPERTIES GUIDELINES ON NATIONAL
STANDARDS AND TECHNICAL REGULATIONS
As previously mentioned, thermal transmittance (U-Value), solar absorptance (α), and heat capacity (HC) have a great importance on building thermal performance and national standards and regulations provide design guidance and performance assessment procedures considering these parameters.
The following sub-items show a brief explanation on how Brazilian standards and regulation consider these opaque envelope thermo-physical characteristics. Later, these documents are compared, and some questionings about it are pointed out.
3.2.1. NBR15220 – BUILDING THERMAL PERFORMANCE /“DESEMPENHO TÉRMICO DE EDIFICAÇÕES”
Published in 2005 the NBR15220 – “Building thermal performance” (ABNT, 2005) is the first national standard to address this topic. The document is divided according to the following sections:
• Part 1: Symbols and units definitions;
• Part 2: elements and building components U-value, heat capacity, time lag, and solar factor calculation methods;
• Part 3: Brazilian bioclimatic zones and single-family low-cost house building guidance;
• Part 4: Thermal resistance and thermal conductivity measurements using the guarded hot plate principle;
• Part 5: Thermal resistance and thermal conductivity measurements using flow meters method.
Table 1: Building envelope constructive guideline provided by NBR 15220 (Adapted from: ABNT, 2005).
BUILDING ENVELOPE COMPONENT
BIOCLIMATIC ZONE
THERMAL TRANSMITTANCE
“U-value” (W/m2.k)
TIME LAG* “φ” (h)
SOLAR FACTOR ** “FSo” (%)
WA
LL
Lightweight 01; 02 ≤ 3.00 ≤4.4 ≤5.0
Reflective lightweight
03; 05; 08 ≤3.60 ≤4.3 ≤4.0
High-mass 04; 06; 07 ≤2.20 ≤6.5 ≤3.5
RO
O
F
Insulated lightweight
01; 02; 03; 04; 05; 06
≤2.00 ≤3.3 ≤6.5
Reflective lightweight
08 ≤2.30 x FT*** ≤3.3 ≤6.5
High-mass 07 ≤2.00 ≤6.5 ≤6.5
* Time lapsed, concerning periodic heat transfer, between a thermal variation in a means and its manifestation in the opposite surface of the building component.
** Quotient between the solar radiation rate transmitted through an opaque component and the total solar radiation rate incident on its external surface
*** Corrector factor of the acceptable thermal transmittance for the bioclimatic zone 8 (dimensionless)
according to the equation: FT=1.17 – 1.07 x h-1.04, where ‘h’ represent the opening height in opposite eaves
3.2.2. NBR 15575: RESIDENTIAL BUILDINGS – PERFORMANCE / “EDIFICAÇÕES HABITACIONAIS – DESEMPENHO”
The Brazilian national standard NBR 15575 (ABNT, 2013) is focused on the users requirements and needs to residential building use. These criteria may be subdivided in three groups: (a) Security – concerning the structure, fire protection, and use during occupation; (b) Habitability - thermal, acoustic and illuminance performance, sealing, health, hygiene and air quality, functionality and accessibility, among others; And sustainability - durability; maintainability; and environmental impact. For each of these items, some guidelines and methods are provided to improve and assess the building system performance.
The NBR 15575 is divided into six sections:
• Part 01: General requirements
• Part 02: Structure system requirements
• Part03: Floor system requirements
• Part 04: External and internal wall requirements
• Part 05: Roof system requirements
• Part 06: Sanitary system requirements
The item thermal performance of Part 01, Part 04 and Part 05 addresses the opaque building envelope issue.
properties calculations and comparisons between the component properties and the standard guidelines; and the application of building performance simulation (BPS), which is recommended if the simplified method results in unsatisfactory thermal conditions, the BPS considers the whole building as an integrated system.
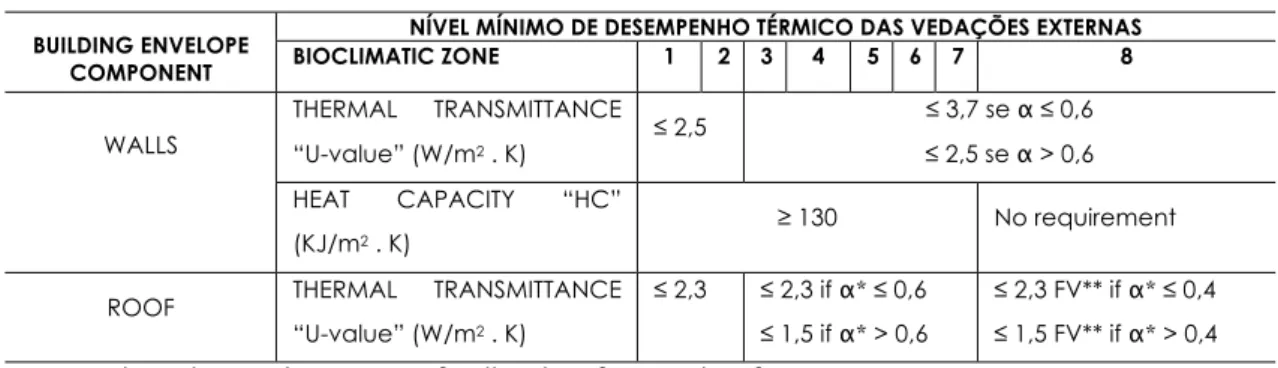
Table 2 shows the guidelines proposed by this standard to residential buildings. For each
Brazilian bioclimatic zones U-value and heat capacity value limits are defined Table 2: Building envelope constructive guideline provided by NBR 15575
(Adapted from: ABNT, 2013)
BUILDING ENVELOPE COMPONENT
NÍVEL MÍNIMO DE DESEMPENHO TÉRMICO DAS VEDAÇÕES EXTERNAS
BIOCLIMATIC ZONE 1 2 3 4 5 6 7 8
WALLS
THERMAL TRANSMITTANCE
“U-value” (W/m2 . K) ≤
2,5 ≤ 3,7 se α ≤ 0,6
≤ 2,5 se α > 0,6
HEAT CAPACITY “HC”
(KJ/m2 . K) ≥
130 No requirement
ROOF THERMAL TRANSMITTANCE
“U-value” (W/m2 . K)
≤ 2,3 ≤ 2,3 if α* ≤ 0,6
≤ 1,5 if α* > 0,6
≤ 2,3 FV** if α* ≤ 0,4
≤ 1,5 FV** if α* > 0,4 * Solar radiation absorptance of wall and roof external surface
** Ventilation factor (FV) is defined in NBR 15220 (ABNT, 2005)
Concerning the BPS method, NBR15575 shows modeling recommendations: location and weather data for typical winter and summer day; simulation software to be used; thermal zoning (considering each room as a zone); building envelope thermo-physical properties to be considered. The performance analysis considers basic requirements regarding the upper temperatures in winter and lower temperatures in summer.
3.2.3. ENERGY EFFICIENCY TECHNICAL REQUISITES FOR RESIDENCIAL BUILDING PERFORMANCE/ ‘RTQ-R REGULAMENTO TÉCNICO DA QUALIDADE PARA O NÍVEL DE EFICIÊNCIA ENERGÉTICA EM EDIFICAÇÕES RESIDENCIAIS’
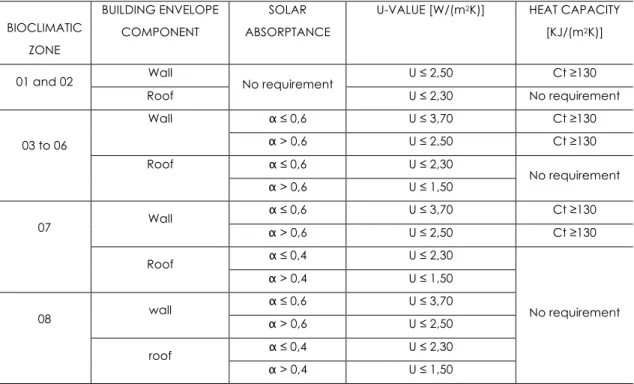
Regarding the building envelope thermal performance, some prerequisites concerning the acceptable range of values for exterior walls and roof U-value, heat capacity, and superficial solar absorptance according to table 3 must be considered to achieve levels A and B in the performance classification. If these prerequisites are not fulfilled in the analyzed residential unit it is still possible to classify the building, but the classification level will not be higher than C.
Table 3: RTQ-R solar absorptance, U-value and heat capacity prerequisites according to the bioclimatic
zone (Adapted from INMETRO, 2012)
BIOCLIMATIC
ZONE
BUILDING ENVELOPE
COMPONENT
SOLAR
ABSORPTANCE
U-VALUE [W/(m2K)] HEAT CAPACITY
[KJ/(m2K)]
01 and 02 Wall No requirement U ≤ 2,50 Ct ≥130
Roof U ≤ 2,30 No requirement
03 to 06
Wall α ≤ 0,6 U ≤ 3,70 Ct ≥130
α > 0,6 U ≤ 2,50 Ct ≥130
Roof α ≤ 0,6 U ≤ 2,30
No requirement α > 0,6 U ≤ 1,50
07 Wall
α ≤ 0,6 U ≤ 3,70 Ct ≥130
α > 0,6 U ≤ 2,50 Ct ≥130
Roof α ≤ 0,4 U ≤ 2,30
No requirement α > 0,4 U ≤ 1,50
08 wall
α ≤ 0,6 U ≤ 3,70
α > 0,6 U ≤ 2,50
roof α ≤ 0,4 U ≤ 2,30
α > 0,4 U ≤ 1,50
NOTE: In Bioclimatic Zone 08, no painted or varnished ceramic tile roof with no ceiling may comply with the requirements of this table if they fit the following requirements: (a) contain vents in at least two opposite eaves; and (b) the ventilation openings occupy the entire length of the respective walls. In these cases, depending on the total height of ventilation, the acceptable limits of heat transfer coefficient may be multiplied by the transmittance correction factor (TF) given by: ft = 1.17 - 1.07. h-1.04 (where: TF = transmittance factor acceptable to the covers of Bioclimatic Zone 8; h = height of the opening in two opposite eaves (cm)).
3.2.4. NBR 15220, NBR15575, AND RTQ-R COMPARISON AND DISCUSSION
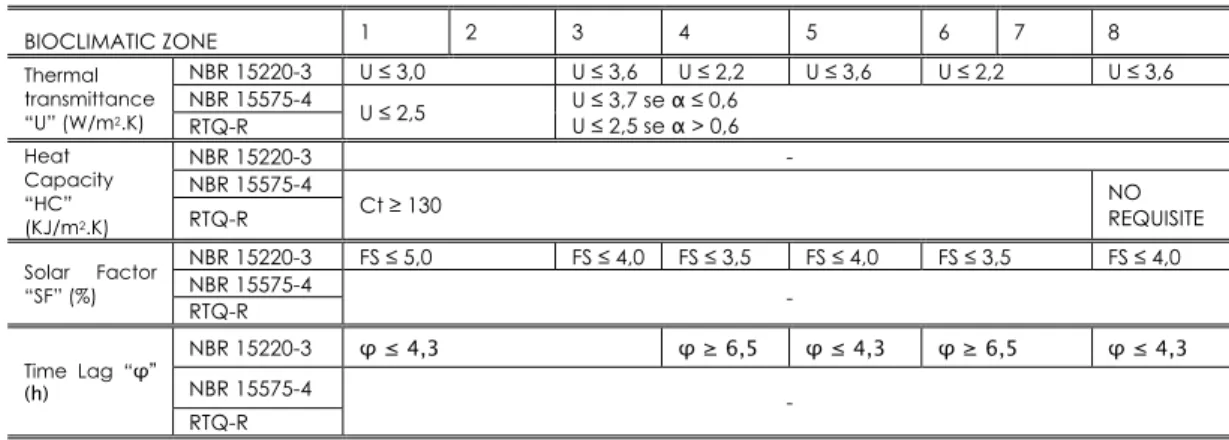
The presented standards and regulations certainly represent a progress on Brazilian building, but it is very important to keep the discussions to continuously improve and update them. Some incoherencies are found in the comparison of building envelope properties among NBR15220 (ABNT, 2005), NBR15575 (ABNT, 2013), and RTQ-R (INMETRO, 2012). Table 4 shows, for each document, the acceptable values of external wall properties: solar factor (SF), thermal transmittance (U-value), heat capacity (HC), and time lag (φ). Different U-values limits are defined between the NBR 15220 and the other regulations. In the first document the guidelines about the solar absorptance values are defined based on the solar factor, and the guidelines about the heat capacity is established by the definition of a maximum time lag for each bioclimatic zone. In the remaining documents a correlation of the surface solar absoptance and its e U-value is considered, and a minimum heat capacity limit is defined.
Table 4. Comparative of wall thermal physical properties from NBR 15220, NBR 15575, and RTQ-R
(Adapted from MARQUES, 2013).
BIOCLIMATIC ZONE 1 2 3 4 5 6 7 8 Thermal
transmittance “U” (W/m2.K)
NBR 15220-3 U ≤ 3,0 U ≤ 3,6 U ≤ 2,2 U ≤ 3,6 U ≤ 2,2 U ≤ 3,6 NBR 15575-4
U ≤ 2,5 U U ≤ 3,7 se α≤ 0,6 ≤ 2,5 se α > 0,6 RTQ-R
Heat Capacity “HC” (KJ/m2.K)
NBR 15220-3 -
NBR 15575-4
Ct ≥ 130 NO
REQUISITE RTQ-R
Solar Factor “SF” (%)
NBR 15220-3 FS ≤ 5,0 FS ≤ 4,0 FS ≤ 3,5 FS ≤ 4,0 FS ≤ 3,5 FS ≤ 4,0 NBR 15575-4
- RTQ-R
Time Lag “φ” (h)
NBR 15220-3 φ≤ 4,3 φ≥ 6,5 φ≤ 4,3 φ≥ 6,5 φ≤ 4,3
NBR 15575-4
- RTQ-R
Table 5 shows a comparison between Brazilian standard and regulation guidelines for the roof
Table 5. Comparative of wall thermal performance strategies from NBR 15220, NBR 15575, and RTQ-R
(Adapted from MARQUES, 2013).
BIOCLIMATIC ZONE 1 2 3 4 5 6 7 8
Thermal Transmittance ” (W/m2.K)
NBR 15220-3 U ≤ 2,0 U ≤ 2,3 FT
NBR 15575-4
U ≤ 2,3 U ≤ 2,3 se α≤ 0,6 U ≤ 1,5 se α > 0,6
U ≤ 2,3 FV se α≤ 0,4 U ≤ 1,5 FV se α > 0,4 RTQ-R
Solar Factor “SF” (%)
NBR 15220-3 FS ≤ 6,5
NBR 15575-4
- RTQ-R
Time lag “φ” (h)
NBR 15220-3 φ≤ 3,3 φ≤ 6,5 φ≤ 3,3 NBR 15575-4
- RTQ-R
Researchers have also been investigating incoherencies between the performances evaluations proposed in these documents. Loura, Assis and Bastos (2011) compared the results from NBR15575 (ABNT 2013) and RTQ-R (INMETRO 2012) assessment methods for a multi-family building in Rio de Janeiro. Using the RTQ-R the building received grade B for energy-efficiency classification, while with the NBR15575 assessment method the same building did not achieved the minimum acceptable performance. Brito et al. (2012), Marques and Chvatal (2013), and Chvatal (2014) indicated inconsistent results between NBR 15575 normative and simulation assessment methods. For the same standard Sorgato et al. (2012) points out some gaps and indicated possible solutions.
3.3. BUILDING THERMAL PERFORMANCE PREDICTIVE MODELS
3.3.1. INTEGRATING BUILDING PERFORMANCE SIMULATION INTO DESIGN PROCESS: CHALLENNGES AND OPPORTUNITIES
Although several building performance simulation (BPS) tools have been developed in recent decade and this disciplinary field has reached a high degree of maturity, its use as guidance to daily design process is still unexpressive and mostly under-exploited.
constructive information to setup the virtual model for simulation. The need of such specialized users may restrict BPS to universities and research centers due to the lack of other institutions that are able to assemble professional experts from different knowledge fields (WESTPHAL, 2007).
Computational performance-based building design cope with the conflict of providing building performance feed back during early design. This is due because many design aspects are typically detailed in the later stages and significantly affect the building performance. This conflict points out the challenge of developing new methodologies to allow the use of BPS since the early design stages (BRAHME et al., 2001).
Contemporary simulation programs may provide a good array of performance assessments; However, their routine application in design practice is subject to many barrier primarily concerning the areas of quality assurance, task sharing during the program development, interoperability between computational programs, and the fact that it is mainly applied to the final stages of building design process (HENSEN et al., 2004).
To simplify and promote the building performance assessment throughout the building design process, especially in early design stages, some reduced models may be applied. These models may be developed with statistic methods based on a set of data from in situ measurements or robust simulation procedures; and its accuracy with regard to the ‘original’ data collector or predictor may be statistically checked. Such models may allow fast and accurate assessment of the building performance providing quantitative information to lead designers to the most efficient design alternatives.
3.3.2. THE USE OF REGRESSION META-MODELS TO ASSESS BUILDING PERFORMANCE DURING THE EARLY DESIGN STAGES
A model is an entity that represents other entity; this is an abstract and reduced representation that focuses only in some of the entity’s features, in a way that it can be used to effectively understand, explore, document, and predict some behaviors and properties of the modeled entity (MAHDAVI, 2004). Therefore, BPS tools are models that predict and represent which would be the thermal and energetic behavior of a building in response to a set of physical phenomena as the heat exchange.
complex and precisely compute detailed tasks and the overall real performance based on fundamental physics; a set of expert tools such as TRNSYS (KLEIN, 1990), Virtual Environment (IES, 2015), and EnergyPlus (EERE, 2014a) use physical calculation methods to generate their models. The necessary information input to run expert simulations, and the knowledge needed to perform and interpret the simulation results are highly extensive (SCHLUETER; THESSELING, 2009). Data-driven modeling, or black box modeling, is developed based on experimental data and statistical methods; these models count with much simpler input-output (KRISTENSEN; MADSEN; JØRGENSEN, 2004). Models based on statistic calculation applies empirically found factors instead of physical processes calculations to generate simplified models that are able to assess the building performance; Compared to the input data required in physical models, a fewer detailed information is needed for the calculation, which facilitates the parameter input. Concerning the computational time the statistic models speed up the performance assessment (SCHLUETER; THESSELING, 2009). The based and data driven hybrid modeling, or gray box modeling, is developed with
physics-based model data and the use of statistical tools. “This way models can be developed, which have almost the same validity range as white-box models, but it can be done in a less time-consuming manner and the models are guaranteed not to be overly complex” (KRISTENSEN; MADSEN; JØRGENSEN, 2004, p. 1432). Therefore, this hybrid modeling generates a meta-model that is a simplified statistical model to represent a physics-base model.
Numerous researches have been developing meta-models with Fourier series, neural network and regression analysis. This latter statistical analysis is widely used to describe the variation of a depended variable ‘y’ to explanatory variables ‘x1’, ‘x2’, xn that are the inputs of the function. It aims to find an appropriate mathematical model by determining the best fit of model’s coefficients to explain a given data. The regression technique is a good alternative in the development of a predictive model as the output variable spans a continuous value range and the influence of the inputs on the outputs is known (CATALINA; IORDACHE; CARACALEANU, 2013).
The regression model’s performance prediction capability is restrict to the set of parameters considered for its development, e.g. the climate patterns, building type, building geometry, building materials, and human occupation patterns. Such restrictions highlight the importance of the parameter correct characterization to meet the demands that motivate its development. The use of regression analysis to generate performance predictive models is recurrently indicated in scientific literature; among these researches some are presented below.
parameters that were selected according to sensibility analysis results: (a) Roof to total building envelope area ratio; (b) Window to wall ratio; (c) Shading factor; (d) glazing shading coefficient; (e) Roof’s U-value; (f) Roof’s absorptance; (g) Facades’ U-value; (h) Facades’ absorptance; (i) Internal loads. The regression was performed based on the outputs of simulation runs; the simulation setup considered two different values for each parameter – except for the facades’ U-value, which was considered as a fixed value. The regression equation showed good accuracy with R2 superior to 0.99 1 to the most climates.
To provide quantitative information to guide designers during the early design stages Catalina, Virgone, and Blanco (2008) developed regression models to predict the monthly heating energy consumption of single-family houses in the temperate climate of sixteen cities in France. The regressions were performed from an extensive data set of performance simulation results on which the following parameters were considered: building shape; building envelope U-value; window to floor area ratio; building time constant; and a climate coefficient. The resultant regression equations showed the maximum deviation of 5,1% from the predicted to the simulated, which demonstrate that it may be used as a predictive model.
Eisenhower et al.(2012) also utilized regression techniques in the development of a meta-model to optimize the building thermal comfort and energy consumption. Uncertainty and sensitivity analysis were performed to determine the influent design parameters, and the model showed accurate prediction.
Concerning Brazilian buildings, regression equations were used to classify energy efficiency in the Energy Efficiency Technical Requisites for Residential and Commercial Building Performance – RTQ-R (INMETRO, 2012) and RTQ-C (INMETRO, 2010) respectively.
Hygh et al. (2012) used Monte Carlo2 simulations and regression analysis to create a multivariate linear meta-model. Twenty-seven design parameters were varied in the simulations: (1) Total building area; (2) Number of stories; (3) Depth; (4) Aspect ratio; (5) Orientation; (6) Roof thermal resistance; (7) Roof color; (8) Roof emissivity; (9 – 12) Window U-value (in facades N, S, E, W); (13 - 16) Window solar heat gain coefficient (in facades N, S, E, W); (17 – 20) Wall U-value (in facades N, S, E, W); (20 – 23) Shading projection factor (in facades N, S, E, W); (24 – 27) Window-to-wall ratio (in facades N, S, E, W). The authors modeled a medium size rectangular office building in EnergyPlus considering three cities of
1!The coefficient of determination (R2) indicates “the portion of the variance in the dependent variable that is
predictable from the independent variable (…) An R2 of 0 means that the dependent variable cannot be predicted
from the independent variable; An R2 of 1 means the dependent variable can be predicted without error from the
independent variable; An R2 between 0 and 1 indicates the extent to which the dependent variable is predictable.
An R2 of 0.10 means that 10 percent of the variance in Y is predictable from X; an R2 of 0.20 means that 20 percent is
predictable; and so on” (STATTREK, [s.d.]).!
2!The Monte Carlo method considers a random sampling of a probabilistic distribution (DONATELLI; KONRATH, 2005).
different bioclimatic zones in the United States. The meta-models showed good prediction accuracy compared to the simulation results. For each analyzed climate standardized regression coefficients were presented, which allowed the classification of the most sensitive parameters in early design.
Other authors have also been applying regression analysis to a set of performance simulation results to generate predictive models e.g. Nielsen (2005), Lam et. al., (2010), Wu; Sun (2012), Catalina, Iordoche, and Caracaleanu (2013), Korolija et al.(2013), etc. Most part of these predictive models has been developed to concern the building heating and cooling energy consumption and they all show good prediction fit between the regression and the robust simulations used as its base.
Therefore, regression models may be used as simplified prediction tools to assess building performance since the early design stages; and they show good accuracy.
3.4. ANSI ASHRAE STANDARD 55 - ADAPTIVE MODEL AND DEGREE-HOUS OF DISCOMFORT
ANSI ASHRAE STANDARD 55 - ADAPTIVE MODEL
The ANSI ASHRAE Standard 55 – “Thermal environmental conditions for human occupancy” has the purpose “to specify the combinations of indoor thermal environmental factors and personal factors that will produce thermal environmental conditions acceptable to a majority of the occupants within the space” (ANSI/ASHRAE, 2013, p. 2). In section 5.4 – “Determining Acceptable Thermal Conditions in Occupant-Controlled Naturally Conditioned Spaces” this standard describes the Adaptive model calculation method “that relates indoor design temperatures or acceptable temperature ranges to outdoor meteorological or climatological parameters” (id. ibid.).
According to this standard, the adaptive model’s applicability is valid for occupant-controlled naturally conditioned spaces that meet four criteria:
a) Neither mechanical cooling system installed nor heating system in operation; b) The metabolic rates of the representative occupants ranges from 1.0 to 1.3 met; c) The representative occupants can adapt their clothing within a range at least as wide
as 0.5 to 1.0 clo.
A comfort range with at least 80% of acceptance is determined based on simple arithmetic means of the daily outdoor air temperatures of 7 to 30 sequential days prior to the day in question. The upper and lower for 80% acceptability limits are calculated according equations 07 and 08 from ANSI ASHRAE Standard 55 (2013).
!""#$!80%!!""#$%!!"#"$%!!"#"$! °! =!0.31!!
!"#(!"#)+21.3!!!!!!!!!!!!!!!!!!!!"#$%&'(!07
!"#$%!80%!!""#$%!&'('%)!!"#"$! °! =!0.31!!
!"#(!"#)+14.3!!!!!!!!!!!!!!!!!!!!"#$%&'(!08
where: !!"#
(!"#) : is the simple arithmetic means of the daily outdoor air temperatures of 7 to 30 sequential days
Figure 2 illustrates the acceptable temperature ranges for naturally conditioned spaces
according to the adaptive method.
Figure 2. Acceptable operative temperature (to) ranges for naturally conditioned spaces. Source:
ASHRAE Standard 55 (ANSI/ASHRAE, 2013)
DEGREE-HOURS (°Ch) OF DISCOMFORT
PAPAKOSTAS; KYRIAKIS, 2005; RORIZ; CHVATAL; CAVALCANTI, 2009; SATMAN; YALCINKAYA, 1999; YU et al., 2011).
Figure 3 illustrates the use of this method to compute the heat and cold discomfort based on
upper and lower temperature limits. When the temperature exceeds such limits the number of degree-hours of discomfort is computed.
Figure 3: Degree-hours of discomfort calculation example. (Source: RORIZ; CHVATAL; CAVALCANTI,
2009)
The heat and cold degree-hours of discomfort during a year is calculated with equations 08 and 09 (Adapted from SILVA; ALMEIDA; GHISI, 2015):
!"!= !"!!"#!>!"#!! !"#−!"#! !!"!!"#!<!"#!0 !"#$
!!!
!!!!!!!!!!!!!!!!!!"#$%&'(!08
!"! = !"!!"#!<!"!!! !"!−!"#! !!"!!"#!>!"!!0 !"#$
!!!
!!!!!!!!!!!!!!!!!!"#$%&'(!09!
where:
DHH = Degree-hours of discomfort by heat during a year DHC = Degree-hours of discomfort by cold during a year !"#! = hourly operative temperature inside a building
!"# = upper 80% acceptability limit according to ASHRAE – 55 (ANSI/ASHRAE, 2013)
4.
METHOD
The research method encompasses the use of regression analysis to develop a set of meta-models to predict the thermal discomfort in Brazilian low-cost houses within three climates. The meta-models can be used as tools to provide decision support to designers by allowing a rapid feedback about the influence of the early design decisions on building’s thermal performance.
Figure 4 shows an overview of the method developed in this research, which is subdivided into three steps: (1) Design Problem Definition, (2) Monte Carlo simulation and (3) Multivariate regression.
Multivariate regressions are performed based on an extensive data set from EnergyPlus simulation runs; the parameter combinations to be simulated are sampled with a Monte Carlo framework. To define the design space to be explored a base model is created and key design parameters variation ranges are determined. The Base Model deals with the characterization of the building in EnergyPlus; it encompasses the fixed parameters that characterize the building and the input data method to be used for the fixed and variable parameters. Because the meta-model prediction capability is restricted to the parameters considered during its development, the base model definition assumes a highly important role. As the objective of this research is to provide designers with quantitative information during the early design stages, the base model must assume some simplifications that provide more flexibility to the model; Therefore, benchmark tests are performed to ensure that these simplifications does not imply in any loose of accuracy, such as the thermal zone and material input methods. According to the Brazilian low-cost housing constructive practice, a group of parameters with great impact on thermal comfort is subjected to value variation in the performance simulation; the parameters and their variations are described as Design Parameters Ranges.