HEAT TRANSFER ENHANCEMENT THROUGH
PCM THERMAL STORAGE BY USE OF COPPER FINS
by
Nedžad R. RUDONJA
a*, Mirko S. KOMATINA
a, Goran S. ŽIVKOVI]
b,
and Dragi Lj. ANTONIJEVI]
ca Faculty of Mechanical Engineering, University of Belgrade, Belgrade, Serbia b Laboratory for Thermal Engineering and Energy, Vinca Institute of Nuclear Sciences,
University of Belgrade, Belgrade, Serbia
c Faculty of Applied Ecology, Singidunum University, Belgrade, Serbia
Original scientific paper DOI: 10.2298/TSCI150729136R
Enhancement of heat transfer over a cylinder shaped thermal energy storage filled by paraffin E53 by use of longitudinal rectangular copper fins was ana-lyzed. The thermo-physical features of the storage material are determined in separate experiments and implemented to FLUENT software over user defined function. Advanced thermal storage geometry comprehension and optimization required introduction of a parameter suitable for the analysis of heat transfer en-hancement, so the ratio of heat transfer surfaces as a factor was proposed and applied. It is revealed that increase of the ratio of heat transfer surfaces leads to the decrease of melting time and vice versa. Numerical analysis, employing the 3-D model built in Ansys software, observed storage reservoir geometries with variable number of longitudinal fins. The adjusted set of boundary condi-tions was carried out and both written in C language and implemented over user defined function in order to define variable heat flux along the height of the heat-er. The comparison of acquired numerical and experimental results showed a strong correlation. Experimental validation of numerical results was done on the real thermal energy storage apparatus.
Key words: thermal energy storage, phase change material, paraffin, numerical modeling
Introduction
Thermal energy storage (TES) is an important part of an efficient thermal engineering system. It has been used for eliminating the mismatch between energy supply and energy de-mand. Furthermore, TES contributes to the lower investment and operational cost (decreasing installed power) of the plants as well as reducing of environmental impacts.
Mainly two types of TES have been used: sensible and latent. Latent TES has gained more attention as result of the fact that materials used for storing energy have nearly constant phase change temperature and high density of stored energy per unit of volume [1, 2]. Neverthe-less, materials that have been used in latent TES, phase change material (PCM) have limited ap-plication due to their low thermal conductivity. This disadvantage lengthens the melting time of PCM as well as its solidification time.
There are few possible approaches for overcoming the problem of low thermal con-ductivity. A common solution is inserting high conductivity materials in shape of grains or ––––––––––––––
small particles into PCM. The result is heat transfer enhancement by approximately 60-150% [3]. However, the main problem of the method is deposition of inserted materials with the time as the result of acting gravitational force. Some researchers [4, 5] explored use of metal foams as the structure whose pores are filled by PCM. Achieved heat transfer enhancement is from 3-10 times. On the other hand, the main disadvantage of this method is sub-cooling of PCM as result of increased flow resistance.
Finally, the most proposed method suggests utilization of metal fins. The metal fins play the role of thermal bridges in PCM [6]. Mosaffa et al. [7] developed an analytical 2-D model as well as numerical model of the solidification process for prediction of temperature dis-tribution inside a thermal storage container with rectangular horizontal fins. They used constant convective heat transfer coefficient and constant temperature along storage walls. The main conclusion was that reduction in total solidification time due to the decrease in the inlet temper-ature of heat transfer fluid was significant. Al-Abbidi et al. [8] developed a 2-D model with in-ternal and exin-ternal fins. They analyzed influence of fins length, number, thickness as well as material of fins to the melting time. It was concluded that fins thickness has negligible influence to the melting time comparing to the fin’s length and number.
However, many articles that have been published the heat transfer enhancement was tracked down based on the number of fins or the fin dimensions [7, 9, 10]. However, for de-sign and optimization of real TES apparatus it is more convenient to introduce a geometric pa-rameter that can unify all fin dimensions. For this reason in the present paper the heat transfer enhancement was tracked down through a geometric parameter that represents the ratio of the heat transfer surfaces. The paraffin E53 (commercial-grade wax) was selected as a working medium because of the fact that such organic materials have nearly constant temperature of the phase change as well as due to low value of oil content (high resistance to explosion). Since the accurate determination of thermo-physical properties of the PCM is essential for numerical simulation of TES they were determined by measurements.
Thermo-physical properties of working medium
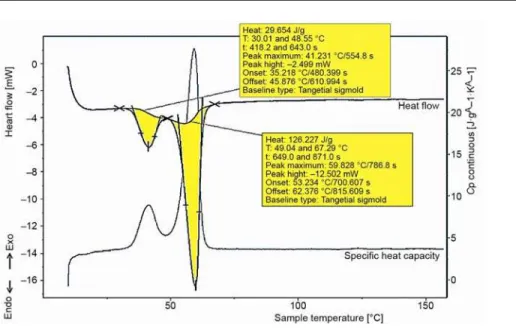
To obtain thermal properties of E53 differential scanning calorimeter (DSC) was used. The measurements were conducted on DSC EVO 131 apparatus in order to obtain latent heat of phase change as well as the specific heat capacity dependence on temperature. Figure 1 shows results obtained during continuous measuring of thermal properties of the paraffin E53. The mass of the sample was 7.2 kg–6. Apparently, there are two peaks as a consequence of presence of more than one fraction in the paraffin. The start of the smaller peak corre-sponds to the solidus curve where the melting process begins while the end of the bigger peak corresponds to the liquids curve where the melting process ends. As a consequence of the presence of two peaks the total latent heat is the sum of the latent heats, i. e. 155931 J/kg.
Thermal conductivity of the paraffin E53 was determined by C-therm analyzer. The results are shown in fig. 2. The peaks have the same cause as in the case of the specific heat capacity measurement.
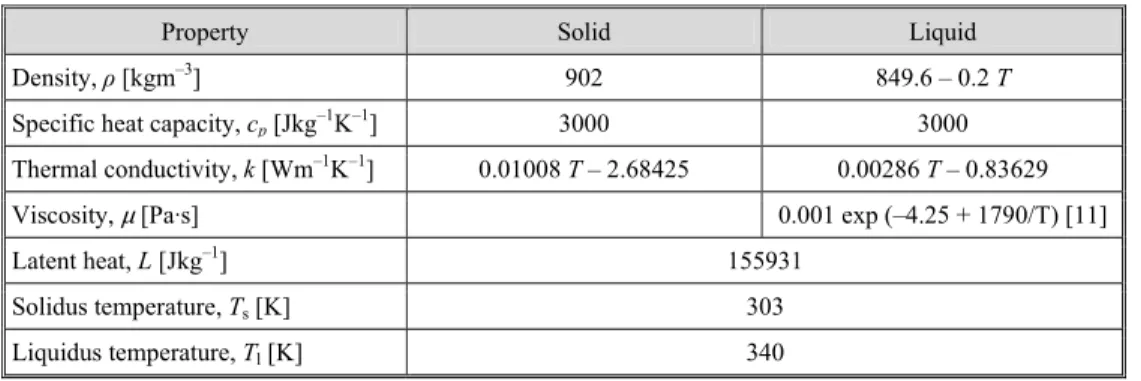
The functional dependencies the thermo-physical properties of the paraffin listed in tab. 1 were used for numerical simulations and implemented to FLUENT model by the user defined function (UDF).
Physical model
Figure 1. The DSC heating curves of paraffin E53
study is shown in fig. 3. Cooper fins (1) are evenly arranged and welded along the inner cyl-inder (3). Inside the cylcyl-inder (3) the electric heater with the total power input 2400 W is placed. The space between the cooper fins, inner and outer cylinder (4) is filled by paraffin E53 as working medium (2). Total height of fins, cylinders and PCM is 500 mm, while other dimensions are shown in fig. 3.
Figure 2. Thermal conductivity of E53 Figure 3. Physical model of the TES with 12 cooper fins: (1) fin, (2) PCM, (3) iner cylinder, and (4) outer cylinder
Three basic lay-outs cases were analyzed: I – heating cylinder without fins, II – with six identical longitudinal fins, and III – with twelve identical longitudinal fins.
Table 1. Properties of paraffin E53 used for numerical simulation
includes all fins dimensions. Let the be a ratio of heat transfer surfaces, defined as ratio of the overall heat transfer surface for fined surface (case II or III) and the heat transfer surface without fins (case I). In the case that fins are rectangular with the negligible thickness and with the negligible thickness of inner cylinder, becomes:
f f f f f f
f
(2 2 2 ) π
π
n l Z l s Z s d l nsl
d l
γ
= + + + − (1)where n is the number of fins, Zf– the height of the fin, 160 mm, s – the fin thickness, 3 mm,
lf – the length, 500 mm, d – the outer diameter of the inner cylinder, 60 mm. The calculated surface ratio for the cases I, II and III is 1, 11.3, and 21.7, respectively.
Governing equations
Governing equations for 3-D melting and solidification problem are given. Continuity equation:
( )
( v)
0
t
ρ
ρ
∂
+ ∇
=
∂
G
(2)where
ρ
is the PCM density and v
G
is the velocity vector.
Momentum equation:
M
( v)
( vv)
p
g
S
t
ρ
ρ
ρ
∂
+ ∇
= −∇ + ∇ +
+
∂
τ
G
G
GG
(3)where
p
is the static pressure,
τ
is the stress tensor, and
S
Mis the momentum source term.
The enthalpy-porosity approach proposed by Brent
et al.
[12] treats the mushy zone as a
porous medium. The porosity in each cell is assumed to be equal to the liquid fraction of
that cell. The momentum source term in eq. (3) includes reduced porosity in the mushy
zone takes the form:
2
M 3 mush
(1 )
v 0.001
S
β
Aβ
− =+
G (4)
where is the liquid volume fraction and
A
mushis the mushy zone constant. The liquid
fraction is defined based on the PCM temperature:
Property Solid Liquid
Density, ρ [kgm–3] 902 849.6 – 0.2 T
Specific heat capacity, cp [Jkg–1K–1] 3000 3000
Thermal conductivity, k [Wm–1K–1] 0.01008 T– 2.68425 0.00286 T – 0.83629
Viscosity, µ [Pa·s] 0.001 exp (–4.25 + 1790/T) [11]
Latent heat, L [Jkg–1] 155931
Solidus temperature, Ts [K] 303
s s s s l
0,
,
1,
l lT
T
T
T
T
T
T
T
T
T
T
β
β
β
=
<
−
=
< <
−
=
<
(5)
where Ts and Tlare solidus and liquidus temperatures, respectively.
Energy equation:
(
H
)
( v )
H
(
k T
)
t
ρ
ρ
Φ
∂
+ ∇
= ∇ ∇ +
∂
G
(6)where H is the enthalpy, T – the thermodynamic temperature, and Φ – the energy of dissipa-tion. The enthalpy of PCM is calculated as the sum of the sensible enthalpy, h and the latent
heat content, ∆H:
H
= + ∆
h
H
(7)H βL
∆ = (8)
Numerical simulations Set-up procedure
Numerical modeling of phase change processes was carried out by FLUENT soft-ware that uses finite volume method for solving continuity, momentum, and energy equations. The procedure of solving those equations by finite volume method was established by Patankar [13]. The coupling between pressure and velocity was conducted by the semi-implicit pressure- -linked equation (SIMPLE) algorithm [13]. The PRESTO [13] scheme was used for discretiza-tion of the pressure correcdiscretiza-tion equadiscretiza-tion, while for the momentum and energy equadiscretiza-tions the first order upwind discretization scheme was used. It was assumed there was no volume change of the paraffin with temperature, its flow through the reservoir during the process was laminar and the energy of dissipation was neglected. Since the shape of TES is cylindrical, the compu-tational domain was divided to two symmetrical halves and thus only a half of the volume was observed. The physical model and the mesh were generated in Ansys software and in each case domain was divided to approximately 45000 cells. In order to achieve convergence at each time step, the time step was set at 1 second. Number of iterations per each time step was 50. The convergence criterion was that the scaled residuals are less than 10–4 for the continuity and momentum equation as well as the residual was 10–6 for the energy equation. The values of under relaxation factors for pressure, density, body forces, momentum, liquid fraction and en-ergy were 0.3, 1, 1, 0.2, 0.9, and 1, respectively. A personal computer with an Intel Core i5 processor (3.2 GHz) and 16 GB random access memory was used.
exp( 5.322 ) 1
21000 64000
W/m
5.322
z
q
=
−
−
−
(9)where qis the surface heat flux and z is the height of the heater.
The switch off temperature sensor was also included in the UDF and geometrically placed as the real control sensor. Thermodynamic properties of E53 were implemented to FLUENT 14.5 software over UDF function.
Numerical results
Figures 4 and 5 show temperature fields inside the TES after 60 and 120 minutes of charging, respectively. Increasing the number of fins results in more intense heat transfer throughout the reservoir and increase the liquid fraction of PCM and thereby causing the de-crease of the charging time.
Figure 4. Temperature field inside the TES after 60 min – Case I (left), Case II (middle), and Case III (right)
Figure 5. Temperature field inside the TES after 120 min – Case I (left), Case II (middle), and Case III (right)
During the numerical simulation the information about the liquid fraction was rec-orded and the curve that represents dependence of the melting time of PCM on time created. Liquid fraction inside the TES for all cases after 120 minutes is shown in fig. 6.
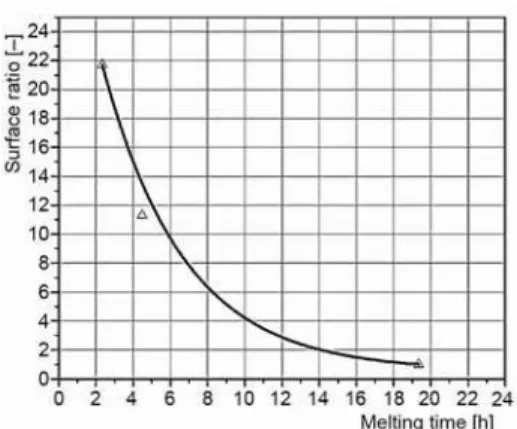
Based on the melting time obtained by numerical simulations of the three cases the dependence of melting time from the ratio of heat transfer surfaces can be derived (fig. 7).
Figure 6. Liquid fraction of PCM after 120 min – Case I (left), Case II (middle), and Case III (right)
)
This dependence/correlation can be used for engineering calculations and it is valid for the PCM and known temperature of the heating source and best exemplifies importance application of the ratio of heat transfer surfaces. It is important to emphasize that the surface ratio includes all dimensions of fins and takes into account their influence to the melt-ing/solidification time. As it was expected the melting time of PCM decreases with the in-crease of the surface ratio. For given geometry of a TES and known the ratio of heat transfer surfaces the melting time of the PCM can be obtained. For instance, if the charging time of a TES is known, the curve of fig. 7. Can be used for the design and optimization of the TES. Experimental set-up and validification
of numerical simulations
In order to verify obtained numerical results experimental investigation was carried out. The experiments were conducted on the experimental installation shown in fig. 8. The main part was the cylindrically shaped tank of about 77 dm3, whose internal space in this case was filled by paraffin E53 as PCM. The PCM was heated by the electric heater (EH), located in the central position of the TES. Four thermocouples (A1, A2, A3, and A4) were placed at the heater surface. The top thermocouple (A1) at the heater surface was used for the heating control (the switch off sensor). If the temperature of the heater reached 473 K the electricity was switched off, until the temperature dropped below the given range. For the measurement of temperature profile inside PCM, eight thermocouples (B1-B4 and C1-C4) were placed in-side the tank, four along the axis and two along the radius. Four thermocouples (D1-D4) were placed at the outer surface of the tank. The enumeration and position are shown in fig. 8.
The frequency of the stored temperature values was each 60 second, which was precise enough for the relatively small change of the temperature field inside the TES. Experimental
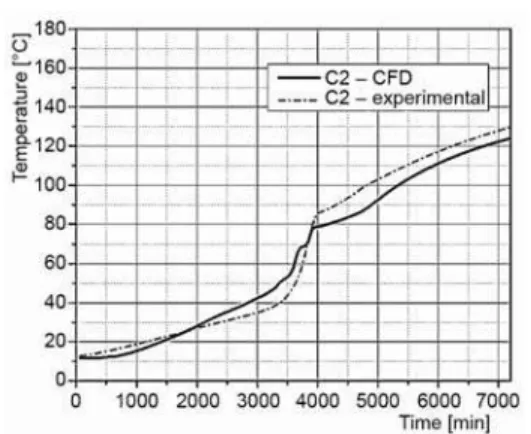
validification of numerical modeling was done by tracking and comparing temperature at the position of the thermocouple C2. This ther-mocouple was selected as result of the fact that has central position in the TES, but also results from rest of thermocouples were satis-fied.
Figure 9 shows the comparison of the numerical and experimental results. The com-parison of acquired numerical and experi-mental results showed a strong correlation. Conclusions
The utilized numerical procedure for de-termination of heat transfer processes in the TES is very sensitive to the storage material thermo-physical properties, hence the exact values of specific heat capacity, thermal conduc-tivity and density of paraffin E53 were obtained experimentally, using a DSC analysis, ther-mal conductivity analyzer and density measurements. It has been detected that there are sig-nificant variations of the specific heat capacity and the thermal conductivity of paraffin E53 during phase change, however values of those quantities for liquid and solid states are nearly constant but different. A geometric parameter named surface ratio was introduced for better tracking of heat transfer enhancement achieved by inserting of rectangular copper fins along the heating cylinder. The surface ratio can be calculated for different fin types and dimensions and used for assessment and optimization of the melting (charging) and solidification (dis-charging) characteristics of the observed TES. This approach is useful for prediction of melt-ing/solidification time of the TES, since the functional dependence between the surface ratio and the melting time is easily determined. Numerical simulations conducted for 3-D model gives opportunity to have a detailed insight in changes of quantities such as density, thermal conductivity, velocity and heat flux over the TES volume. In order to verify the utilized nu-merical approach the results for paraffin temperature change during the TES charging process in the selected point of TES volume, obtained by numerical simulation and experimentally, were compared and showed strong correlation.
Acknowledgment
The authors wish to thank the Serbian Ministry of Education, Science and Techno-logical Development for financing projects III42011, TR 33042 and OI 176006.
Nomenclature
Amush – mushy zone constant, [kgm–3s–1]
d – diameter, [m]
g – gravitational acceleration, [ms–2] H – total enthalpy of the PCM, [Jkg–1] h – sensible enthalpy of the PCM, [Jkg–1] ∆H – latent heat content, [Jkg–1]
k – thermal conductivity, [Wm–1K–1] L – latent heat, [Jkg–1]
l –length, [m]
n – number of fins, [–] p – static pressure, [Pa]
q – surface heat flux, [Wm–2] SM – momentum source term, [Pam–1] s – thickness, [m]
T – temperature, [K]
t – time, [s] v
G – velocity vector, [ms–1
]
x, z – co-ordinates, [m]
Greek symbols
– liquid volume fraction – surface ratio
µ – dynamic viscosity, [Pa·s]
ρ – density, [kgm–3]
– energy of dissipation, [Wm–3]
Subscripts
f – fin, l – liquid, s – solid
Acronyms
PCM – phase change material TES – thermal energy storage
DSC – differential scanning calorimeter UDF – user defined function
References
[1] Waqas, A., et al., Phase Change Material (PCM) Storage for Free Cooling of Buildings – a Review,
Re-newable and Sustainable Energy Reviews, 18 (2013), Feb., pp. 607-625
[2] Ismail, K., et al., Numerical and Experimental Study on the Solidification of PCM around a Vertical Ax-ially Finned Isothermal Cylinder, Applied Thermal Engineering, 21 (2001), 1, pp. 53-77
[3] Ahmad, M., et al., Experimental Investigation and Computer Simulation of Thermal Behavior of Wall-boards Containing a Phase Change Material, Energy and Buildings, 38 (2006), 4, pp. 357-366
[4] Mesalhy, O., et al., Carbon Foam Matrices Saturated with PCM for Thermal Protection Purposes, Car-bon, 44 (2006), 10, pp. 2080-2088
[5] Zhong, Y., et al., Heat Transfer Enhancement of Paraffin Wax Using Graphite Foam for Thermal Energy Storage, Solar Energy Materials and Solar Cells, 94 (2010), 6, pp. 1011-1014
[6] Erek, A., et al., Experimental and Numerical Investigation of Thermal Energy Storage with a Finned Tube, International Journal of Energy Research, 29 (2005), 4, pp. 283-301
[7] Mosaffa, A., et al., Approximate Analytical Model for PCM Solidification in a Rectangular Finned Con-tainer with Convective Cooling Boundaries, International Communications in Heat and Mass Transfer, 39 (2012), 2, pp. 318-324
[8] Al-Abidi, A, et al., Internal and External Fin Heat Transfer Enhancement Technique for Latent Heat Thermal Energy Storage in Triplex Tube Heat Exchangers, Applied Thermal Engineering, 53 (2013), 1, pp. 147-156
[9] Castell, A., et al., Natural Convection Heat Transfer Coefficients in Phase Change Material (PCM)
Modules with External Vertical Fins, Applied Thermal Engineering, 28 (2008), 13, pp. 1676-1686 [10]Mat, S., et al., Enhance Heat Transfer for PCM Melting in Triplex Tube with Internal–External Fins,
Energy Conversion and Management, 74 (2013), Oct., pp. 223-236
[11]Poling, B., The Properties of Gases and Liquids, McGraw-Hill Book Company, New York, USA, 2001
[12]Brent, A., et al., Enthalpy–Porosity Technique for Melting Convection-Diffusion Phase Change: Appli-cation to the Melting of a Pure Metal, Numerical Heat Transfer, 13 (1988), 3, pp. 297-318
[13]Patankar, S., Numerical Heat Transfer and Fluid Flow, McGraw-Hill Book Company, New York, USA,
1980