GRYFUN: A Web Application for GO Term
Annotation Visualization and Analysis in
Protein Sets
Hugo P. Bastos1*, Lisete Sousa2, Luka A. Clarke3, Francisco M. Couto4
1LaSIGE, Departamento de Informática, Faculdade de Ciências, Universidade de Lisboa, Lisboa, Portugal,
2Departamento de Estatística e Investigação Operacional e Centro de Estatística e Aplicações, Faculdade
de Ciências, Universidade de Lisboa, Lisboa, Portugal,3BioFIG - Centre for Biodiversity, Functional and Integrative Genomics, Faculdade de Ciências, Universidade de Lisboa, Lisboa, Portugal,4LaSIGE, Departamento de Informática, Faculdade de Ciências, Universidade de Lisboa, Lisboa, Portugal
Abstract
Functional context for biological sequence is provided in the form of annotations. However, within a group of similar sequences there can be annotation heterogeneity in terms of cover-age and specificity. This in turn can introduce issues regarding the interpretation of actual functional similarity and overall functional coherence of such a group. One way to mitigate such issues is through the use of visualization and statistical techniques. Therefore, in order to help interpret this annotation heterogeneity we created a web application that generates Gene Ontology annotation graphs for protein sets and their associated statistics from simple frequencies to enrichment values and Information Content based metrics. The publicly ac-cessible websitehttp://xldb.di.fc.ul.pt/gryfun/currently accepts lists of UniProt accession numbers in order to create user-defined protein sets for subsequent annotation visualization and statistical assessment. GRYFUN is a freely available web application that allows GO annotation visualization of protein sets and which can be used for annotation coherence and cohesiveness analysis and annotation extension assessments within under-annotated protein sets.
Introduction
The functional annotation of biological sequences is a crucial step for their biological contex-tualization. Such annotations can be derived from biological experimentation or other kinds of evidence such as sequence similarity through expert curation. However, biological experimen-tation and curation are very time and resource consuming tasks and thus this kind of approach is unable to keep up with the current rate of biological sequencing. Therefore, most (>98%) of
the existing functional annotations are assigned by automatic annotation methods [1]. There-fore, it is critical that these automatic methods achieve high accuracy. For this purpose, initia-tives like the Critical Assessment of protein Function Annotation (CAFA) experiment are held
a11111
OPEN ACCESS
Citation:Bastos HP, Sousa L, Clarke LA, Couto FM (2015) GRYFUN: A Web Application for GO Term Annotation Visualization and Analysis in Protein Sets. PLoS ONE 10(3): e0119631. doi:10.1371/journal. pone.0119631
Academic Editor:Silvio C E Tosatto, Universita’di Padova, ITALY
Received:March 31, 2014
Accepted:January 31, 2015
Published:March 20, 2015
Copyright:© 2015 Bastos et al. This is an open access article distributed under the terms of the
Creative Commons Attribution License, which permits
unrestricted use, distribution, and reproduction in any medium, provided the original author and source are credited.
Data Availability Statement:All relevant data can be found within the paper and its Supporting Information files as well as at the following links:
http://merops.sanger.ac.uk/download_list.shtmland
http://wodaklab.org/cyc2008/downloads.
to analyse and evaluate the current state-of-the-art protein function prediction methods and how they tackle different difficulties presented in protein prediction [2].
There are several issues and challenges to protein functional prediction and annotation [3] and among them is the fact that annotations are often incomplete or can even be erroneous. Furthermore, in the case of erroneous annotations this can be even more problematic for auto-matic methods which have a greater potential for error propagation and increased difficulty in backtracking such errors. Hence, the global result of all the annotation methods is an heteroge-neous annotation landscape in terms of annotation quality, completeness and specificity.
The Gene Ontology (GO) Consortium aims at providing generic and consistent descrip-tions for the molecular phenomena in which the gene products are involved. Given their broad scope and wide applicability the GO aspects have become the most popular of ontologies for describing gene and protein biological roles. For that purpose the GO project provides three growing orthogonal ontologies, or aspects, that describe gene product phenomena at different levels: biological processes, cellular components and molecular functions [4]. Structurally, the terms in each GO aspect are organized as DAGs (Directed Acyclic Graphs) where each node represents a concept (term) and the edges represent a relationship between those concepts. Those relationships between concepts can be of three types:is_a,part_ofandregulates.
A plethora of bioinformatics tools relying on GO have been developed either by the GO Consortium or by other third parties (http://neurolex.org/wiki/Category:Resource:Gene_ Ontology_Tools). These tools can serve different purposes, depending on the research focus each tool was designed for. Among these tools, visualization and statistical analysis are com-monly implemented features.
Perhaps, one of the most relevant contributions of Statistics to GO term studies, concerns the enrichment analysis. For instance, micro-array experiments often output lists which can represent hundreds or even thousands of genes that are found to be differentially regulated for a given condition under study. Hence, in this case, the purpose of term enrichment analysis is to identify a representative set of activity terms that summarize the particular biological activi-ties that are characteristic of the particular condition under study. The actual decision as to whether enrichment (or depletion) of annotation terms occurs in any given set is done by re-sorting to commonly used test statistics such as the Fisher exact test and the Chi-squared test. Additionally, Huang,et al. [5] collected and reviewed 68 bioinformatic enrichment tools while categorizing them into three different classes: singular enrichment analysis (SEA), gene set en-richment analysis (GSEA) and modular enen-richment analysis (MEA). For any of these classes, the decision whether the enrichment is relevant is made on the basis of the obtained p-values. For the SEA class methods the p-values are calculated for each term in a list of pre-selected genes deemed of interest, while for the GSEA class methods experimental values are directly in-tegrated into the calculation of the p-values with no need for pre-selection. On the other hand, methods of the MEA class are similar to those of the SEA class, except they include term-term and gene-gene relations into their procedures.
When coupled with enrichment analysis, (graph) visualization of annotations can help with the analysis by enabling the visual identification of the existing relationships between annota-tion terms found to be enriched. Bioinformatic tools like GOBar [6], GOLEM [7], GOrilla [8], StRAnGER [9] among several other tools provide this combination of enrichment analysis and annotation visualization. That is, all of these tools generate and display graphs that subsume the annotation terms of a target gene (or protein) set in addition to computing the respective enrichment values. On the other hand, a tool such as PANADA [10] also provides visualization but instead of annotation centric visualizations it generates protein similarity networks.
Typical enrichment analysis methodologies, especially of the SEA and GSEA classes, do present several limitations [5], [11] chief among them being that the statistics used <http://ec.europa.eu>) through the BiobankCloud
project under the Seventh Framework Programme (grant #317871) to FMC. Additionally we like to thank FCUL for the tuition support for HPB. The funders had no role in study design, data collection and analysis, decision to publish, or preparation of the manuscript.
(considering, for example, test statistics following a hypergeometric distribution, chi-square distribution, etc., under the null hypothesis) do not depend on measured changes. Further-more, the underlying distribution of genes among various functions may not be uniform, so typically inference regarding enrichment of annotation terms must be made with care [6]. The present paper introduces and discusses thegraph analyser offunctional annotation (GRY-FUN) web application. This application provides visualization and statistical metrics of func-tional annotations for input protein sets. GRYFUN, despite being similar to the
aforementioned tools is in turn particularly designed and focused on the analysis of the func-tional annotations in protein families or in funcfunc-tionally related sets of proteins. That is, GRY-FUN provides an organizing data schema that allows for the fitting of proteins into Super-families>families, such as they are commonly organized in many specialized protein databases.
This can in turn enable the harnessing of knowledge implicit in such protein groupings. Fur-thermore, the most distinctive feature in GRYFUN is the ability to interactively create new an-notation sub-graphs out of regions on a parent graph that are deemed of particular interest by the researcher and are supported by the associated enrichment statistics. Hence, a non-uniform annotation distribution, in this case, can in fact be used as an advantage in determining the functional focus of a given target protein family (or functionally related protein set).
Here we present GRYFUN, a web application focused on annotation analysis annotation co-herence and cohesiveness assessments and that is also capable of providing potential annota-tion extension assistance for under-annotated protein sets.
Implementation
Tool Description
GRYFUN can be publicly accessed and is available as a web-based application at:http://xldb.di. fc.ul.pt/gryfun/
The main function of GRYFUN is to generate graphs subsuming the GO annotations of input protein sets. Just like GObar [6] and GOrilla [8] the graph generation output process is handled by the GraphViz [12,13] visualization software package. The GOA project [14] pro-vides a suitable body of GO annotations for GRYFUN. The underlying database is built from the sources of the UniProt knowledgebase February 2014 release as well as the corresponding UniProt gene association (GOA) tables and respective Gene Ontology (GO) tables. The imple-mentation of this tool relies on the Python Web Framework web2py technology.
Input
GRYFUN currently only accepts UniProt accession numbers as input protein identifiers in order to create a user protein Set. In turn, each Set must belong to a Collection which is just a group of Sets. Additionally, Collections while providing a way to group Sets that share some functional similarity, can also and consequently create a coarser level of granularity. However, a proper use of the Collection/Set organization is paramount in p-value calculation and subse-quent GO term enrichment decisions. For any given Set, the statistical tests are applied to de-termine the statistical significance of any given annotation term in the Set being explored, with the remaining Sets in that Collection being thebackground set
The input proteins in each Set are expected to have a close degree of functional similarity, such as is the case of functional protein families or other groups of functionally related pro-teins. Alternatively, a Set can host dissimilar proteins if the intended purpose is just to navigate the generated annotation graph and manually sort and select sub-sets of proteins.
Graph Visualizations
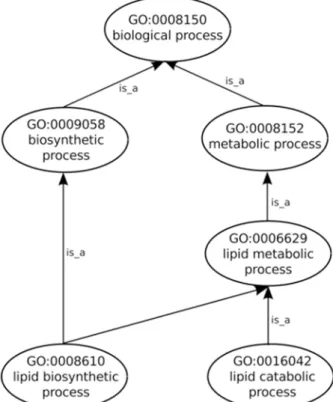
After the input of protein Sets into their appropriate Collections the generation of annotation graphs is enabled. This is the central feature of GRYFUN and all the subsequent analysis is de-rived from these graphs and their supporting metrics and statistics. The annotation graphs gen-erated by GRYFUN are very similar and dependent on GO graphs, however they present a couple of important differences. A GO graph is meant to denote relationships between terms, so each term is represented by a node whereas the relationships between terms are denoted by graph edges.Fig. 1shows a GO sub-graph depicting nodes of thebiological_processGO sub-ontology connected byis_aedges. Each of these edges starts at a child node (term) and points towards a parental node (term), and thus denotes the existing hierarchical relationship between terms. Additionally, all terms converge into a common root node, thus leading to the true path rule that states that“the pathway from a child term all the way up to its top-level parent(s) must always be true”[4].
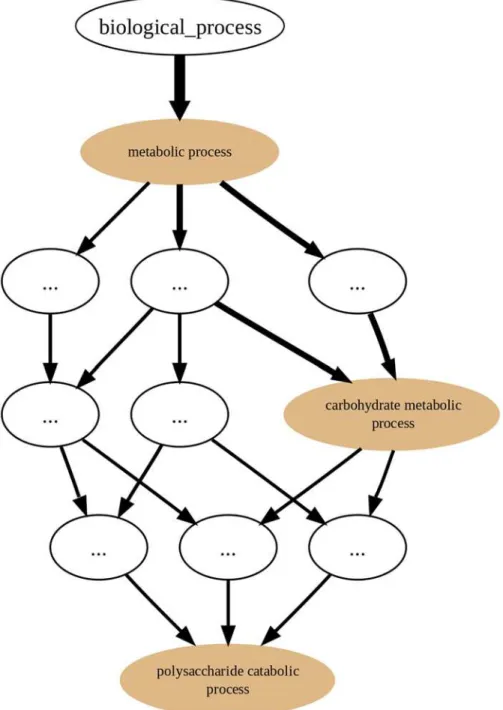
On the other hand, in the GRYFUN annotation graphs, for example, the one shown in
Fig. 2, the edge direction is reversed. Every protein in a Set generating an annotation graph is mandatorily annotated to at least the root term (biological_processin this case). Depending on how well-annotated any given protein is, it will“flow down”the graph towards more specific
nodes. That“flow”can be immediately discernible from the annotation graph given that the edge thickness is proportional to the number of proteins that“flow down”from one parent node to its child node. In fact, what is happening in an annotation graph is that undirected edges between protein accessions and their respective GO annotation terms are being added to the original GO DAG nodes. Thus, proteins annotated to highly specific terms will be associat-ed with a path of relatassociat-ed nodes leading to one or more specific nodes. Therefore, by represent-ing the“annotation flow”on the graph image, an immediate visual cue is provided regarding
Fig 2. GRYFUN annotation graph.Example of a GRYFUN annotation graph subsuming the GObiological processsub-ontology annotations in a sample protein set.
the annotation terms that are more frequent in any given protein Set and at the same time how they relate to each other. Furthermore, this type of annotation graph enables analyses such as the ones previously proposed by the authors [15].
Term Enrichment
While the“annotation flow”in the annotation graph provides a visual cue of the more frequent terms in a given Set, term enrichment will allow users to ascertain the statistical significance of such terms. A commonly usedterm-for-termapproach is applied in GRYFUN to determine en-richment of GO term annotations in protein Sets. For any given term annotation in a (study) Set, the purpose is to test the null hypothesis that states that there is no association between the number of annotated proteins in a Set and the number of annotations of that given term, against the alternative hypothesis of association between them. That is, each Set is considered to be, by the null hypothesis, just a random sample of the population, which in GRYFUN is de-fined as the Collection, hence the importance of defining relevant Collections when adding data. The statistical evidence of enrichment is postulated if the p-values are small, these p-val-ues being calculated by the Fisher’s exact test. However, the graph nature of GO causes an issue with statistical dependencies when using theterm-for-termapproach, that is, for a given term annotating a certain number of proteins, at least that same number of proteins or more will also be annotated by the parental terms. Thus, in order to mitigate this propagation issue a To-pology-based Elimination (Elim) strategy [16,17] (using a significance level of 0.05) was imple-mented using the Python programming language. Given that the computed p-values for the GO terms under this strategy are conditioned on their children terms, and thus not indepen-dent, direct application of the multiple testing theory is not possible. It is then preferable to in-terpret the returned p-values as corrected or not affected by multiple testing.
IC-based term score
A commonly used node property is the IC, which is a frequency-based measure of how specific a term is within a given corpus [18]. The IC of a term can then be given by the following equa-tion:
ICðtÞ ¼ log2fðtÞ ð1Þ
wheref(t)is the fraction of proteins annotated to termtor any of its descendants in the annota-tion corpus. The GOA project [14] provides a suitable body of GO annotations and is used in GRYFUN as an annotation corpus. Furthermore, in GRYFUN the IC is scaled as previously de-scribed [19] using the following equation:
ICuðtÞ ¼ ICðtÞ
log2N ð2Þ
whereNis the total number of annotations within the corresponding GO sub-ontology being considered.
Finally the empirical IC-based term score is calculated through the use of the following equation:
ICscoreðtÞ ¼ICuðtÞ sðtÞ ð3Þ
Graph Re-root
One of the most interesting features of GRYFUN is the ability tore-rootannotation graphs. This feature is similar to the GOLEM [7] focus feature which reduces the graph to a selected GO annotation term and its vicinity (parents and children). On the other hand, GRYFUN’s re-rootallows the selection of any non-leaf term node in an annotation graph followed by genera-tion of a new sub-graph rooted at the term represented by the chosen node.
A typical good choice for are-rootingoperation would be a non-leaf node representing a term bearing a large IC-based term score that is also deemed significant by its p-value. Thus, performing are-rootingoperation will create a new annotation sub-graph subsuming only the annotations that are descendants of the new chosen root term, and thus considering only the proteins annotated with this new root term and its descendants, despite keeping a Set whole.
Hence, this feature enables the focus on more specific functional branches and terms of in-terest while abstracting from terms sometimes describing accessory activities that despite being associated to some proteins in a set can be considered as noise. The IC-based term score will re-main the same after are-rootingoperation for the retained terms because this metric is only de-pendent on the frequency of the term itself both in the current Set and in the background GOA annotation corpus. On the other hand, the p-values obtained after are-rootingprocedure are subject to change because statistical testing is done over thecurrent graph viewand thus, does not consider themaskedannotation terms.
Graph Interactivity
The annotation graphs displayed by GRYFUN while apparently static do offer some interactive elements. The colored nodes represent the direct annotations while the white unlabelled notes the inherited ones. However, hovering the mouse cursor over any node will display a tooltip with the full term name plus its annotation frequency within that Set. Furthermore, clicking on a node will open a new floating modal window listing all the protein identifiers that are anno-tated to the term represented by the clicked node. The displayed protein list can be exported, either entirely or a selection, as a simple tab separated value (TSV) file for use with external programs and subsequent analysis. Additionally, there-rootingfeature is accessible from within these dynamically generated information floating modal windows (as well as directly from the term statistics information tables).
Datasets
In order to illustrate the feasibility of GRYFUN we demonstrate its use with four different datasets.
CAZy (Polysaccharide Lyases)
Additionally, we created a Collection containing only the 21 families belonging to the Polysac-charide Lyase (PL) class (n = 1839). Each Set in those Collections matched the public UniProt protein primary entries (as of October, 2014) found in the CAZy website for each of the fami-lies in the CAZy database.
YHTP2008
The CYC2008 project (http://wodaklab.org/cyc2008/) makes available two catalogues of yeast protein complexes resulting of systematic curation efforts. The first one, CYC2008, is a com-prehensive catalogue of 408 manually curated heteromeric protein complexes reliably backed by small-scale experiments reported in the current literature [22]. Whereas the second cata-logue, YHTP2008, comprises 400 high-throughput complexes derived from high-throughput Tandem Affinity Purification/Mass Spectrometry (TAP/MS) studies [23]. These are either manually annotated with current literature citations if they share subunits with literature-re-ported complexes, or marked as putative complexes if they are not yet characterized in any small-scale studies. We have downloaded this latter catalogue, and each cluster with four or more UniProt identifiers was recreated as a Set in a GRYFUN Collection totalling 133 Sets (n = 1255).
MEROPS
The MEROPS database (http://merops.sanger.ac.uk) aims at providing an integrated source of information on peptidases, their substrates and inhibitors. This database has hierarchical clas-sifications in which homologous sets of peptidases and protein inhibitors are grouped into pro-tein species, which are grouped into families, which are in turn grouped into clans [24]. The family classification in this database also makes it convenient for functional annotation assess-ments using the web application GRYFUN. Thus, we extracted all the UniProt identifiers from this database (MEROPS release 9.9) family classifications. Families with four or more identifi-ers were recreated as Sets in a GRYFUN Collection that was finally composed of 238 Sets (n = 93124).
Gene Expression Micro-array Data
We made use of a small-scale micro-array study of differential gene expression in human na-tive nasal epithelial cells from five F508del-homozygous cystic fibrosis (CF) patients vs. five control individuals [25]. Data analysis using the Rank Products method [26] resulted in a list of differentially expressed genes, many of which were found to be functionally relevant to CF pathophysiology, based on GO term enrichment using (e.g.) the open-source software package DAVID [5]. For the GRYFUN analysis we converted genes up-regulated 2-fold or more in CF samples compared to controls into Uniprot accession IDs (n = 150), and ran this single set against a background of Uniprot IDs (n = 9083) converted from named genes on the Affyme-trix HsAirway micro-array used in the study. The results obtained with GRYFUN were then compared with those obtained for the same gene list using two other GO term enrichment soft-ware platforms; GOrilla [8], using the same background as GRYFUN, and DAVID, using the defaultH. sapiensbackground.
Results and Discussion
Polysaccharide Lyases
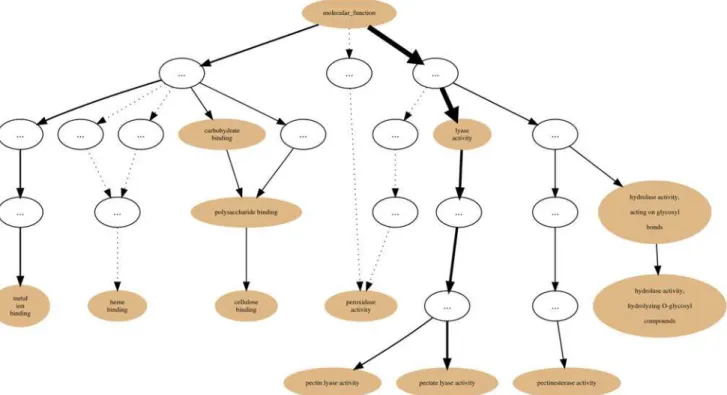
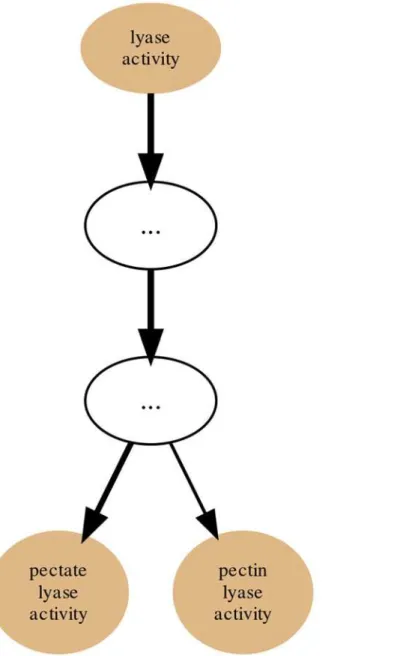
using the GRYFUN web application. All evidence code annotation types were considered. The PL1 family/set is comprised of 564 UniProt protein entries of which 466 are annotated with terms from the GOmolecular functionsub-ontology. This information is also displayed at the header of the generated page as shown inFig. 3. In addition, the header also displays informa-tion such as the Superkingdom taxonomical breakdown of the proteins in the current Set. The central element of the dynamically generated page is an interactive annotation graph such as the one depicted inFig. 4for the PL1 set. Visual inspection of the graph immediately makes ev-ident that the mainannotation flowoccurs from the root term (molecular function) towards the two leaf-terms:pectate lyase activityandpectin lyase activity. Furthermore, by inspecting
Fig 3. PL1 set summary header.Header with summary statistics regarding the PL1 (CAZy family) Set respective to the GOmolecular functionsub-ontology annotation coverage.
doi:10.1371/journal.pone.0119631.g003
the path between the root term and these two leaf-terms we can find, not unexpectedly, the termlyase activity. Hence the graph confirms the expected dominant annotation with the term
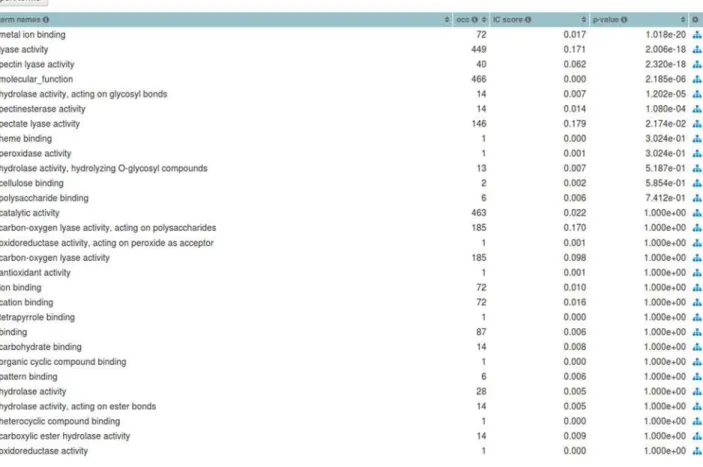
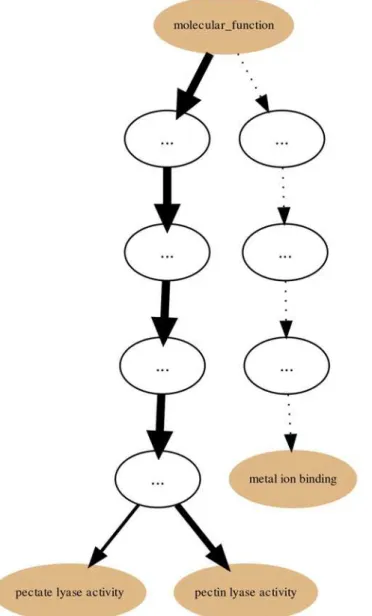
lyase activityand sibling terms in a protein Set that is itself a sub-set of proteins belonging to Polysaccharide Lyase class protein family of the CAZy classification. Hence, in our current PL1 Set example thelyase activityterm node would be a good candidate for are-rootpoint. That is further supported by the p-values and IC-based term score statistics (respectively 2,006 × 10−18 and 0.171).Fig. 5depicts the generated page footer containing the term names and respective statistics sorted by p-value. Given that the IC-based term score is the product of the IC of a term (in a given corpus) and its respective frequency in a given Set, it then provides a measure ofspecific representativityof a term in that Set. In other words, by having a high scorelyase ac-tivityis one of the most frequent of the most specific annotation terms in the Set. However, since this is not a leaf-term there is a potential for annotation extension of the proteins not an-notated beyond this term. We can then perform GRYFUNre-rootoperation on thelyase activi-tynode which results in a new sub-graph as depicted inFig. 6. Thus, in this case three separate sets of proteins (one for each of the two leaf-siblings in the current Set and another for all the proteins annotated to thelyase activityterm) can be exported and submitted to annotation analysis (manual or otherwise) that could lead to annotation extension.
On the other hand, despite our terms deemed of interest and relevance being identified as enriched (statistically significant), the ranking of their p-values does not entirely match the an-notation flow. However, we have to consider that the background against which the enrichment
Fig 5. Term statistics for the PL1 Set.Footer table listing themolecular functionGO term names and their respective statistics, such as, occurrence (occ), IC-based score and p-value for the PL1 (CAZy family) Set.
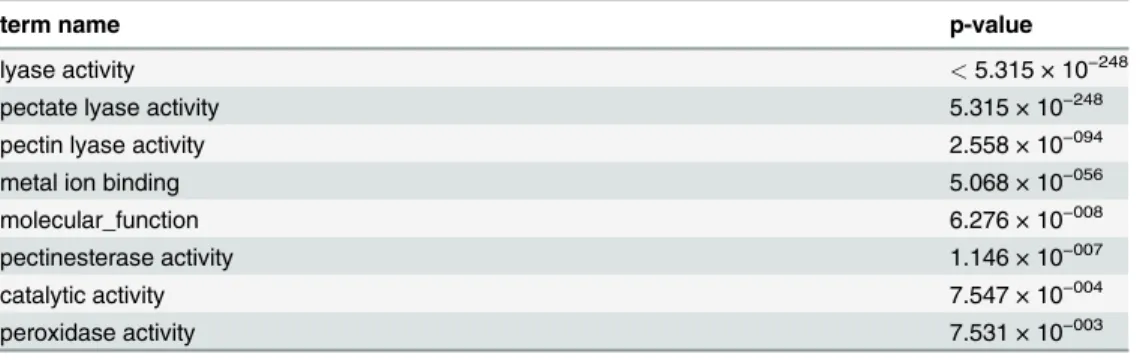
hypothesis was being tested was only the remainder of PL sets, which was therefore expected to retain a degree of functional closeness, that is, a number of these activities would also be pres-ent in other Sets within this Collection. Nevertheless, when we use all CAZy database families as the Collection (and hence background), the enrichment results are closer to the expected val-ues.Table 1displays a sample of the term enrichment list, ranked by p-value, of the PL1 family (set) relation to a background of 237 CAZy families of catalytic classes Glycoside Hydrolases (GH), GlycosylTransferases (GT), Polysaccaride Lyases and Carbohydrate Esterases (CE). The top ranked terms here match the annotation flow as depicted inFig. 6, thus illustrating the im-portance of defining a good background if a reliable enrichment analysis is desired.
In addition, we used the Evidence Code Filter to filter out Inferred Electronic Annotations (IEA) and generate a new annotation graph for the PL1 Set. The resulting graph seen inFig. 7
Fig 6. PL1 Set annotation graphre-rootedat thelyase activityterm.Annotation graph of the PL1 (CAZy family) Set for the GOmolecular functionsub-ontologyre-rootedat thelyase activityterm.
is simpler than the one inFig. 4where all available annotations were used regardless of their Evidence Codes. Because the bulk of all annotations consist of IEA annotations the PL1 Set only has 32 out of 564 proteins with non-IEA annotations. Hence, this filtering focuses the PL1 Set on its annotations considered to be of higher quality but at the cost of coverage. Further-more, the simplification of the graph also matches that of the previously shown term enrich-ment (using all annotations) thus reinforcing the previous enrichenrich-ment results.
Furthermore, we also generated the GO annotation graph (using all Evidence Codes) in the
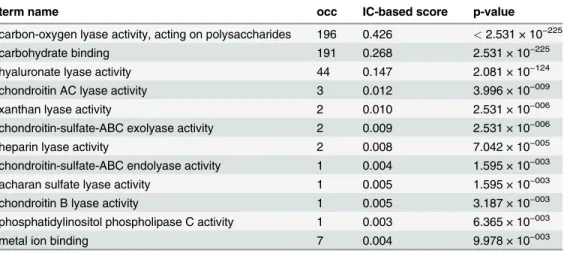
molecular functionsub-ontology for the 197 proteins that amount to the PL8 Set (Family) with the CAZy Collection as background.Table 2shows the term annotation occurrence numbers, IC-based scores and p-values for the enriched terms in Set PL8. The top three statistically sig-nificant terms are also the most representative in terms of Information Content as can be seen by the values of the IC-based score. Among these three, the termcarbon-oxygen lyase activity, acting on polysaccharideshas the higher score (0.426). When considering that score in conjunc-tion with the“annotation flow”shown onFig. 8, we see that about 70% of the proteins are not annotated beyond this term thus making it a good“pivot point”to attempt annotation exten-sion. The remaining proteins that are annotated with terms that are its descendants are mostly (44 proteins) annotated to the termhyaluronate lyase activity, the third most IC significant term (IC-based score = 0.147). Furthermore, family PL8 has 3 sub-families (1–3) [21], which in our set are constituted by 88, 33, 4 proteins respectively. Additionally, there are still 77 remain-ing proteins in Set PL8 that are not classified into any of the sub-families. The examination of PL8 sub-family 1 shows that it is characterized by (27) proteins that are annotated to the hya-luronate lyase activityterm (this term is enriched in the sub-family using the family as back-ground). On the other hand, sub-families 2 and 3 are scarcely annotated beyond the term
carbon-oxygen lyase activity, acting on polysaccharidesand thus do not provide statistical sup-port for what are their most specific representative activities. Hence, further annotation would be required for the members of sub-families 2 and 3 in order to assess a more specific function-al profile for them.
YHTP2008
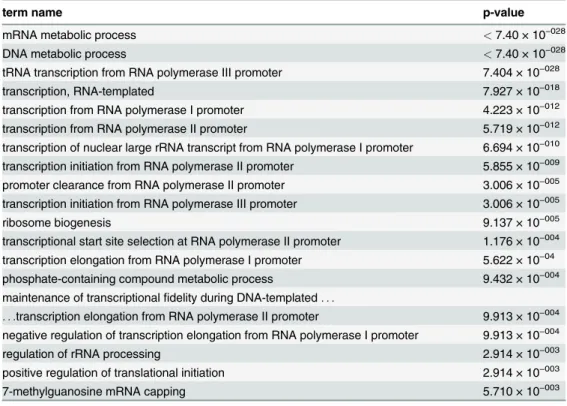
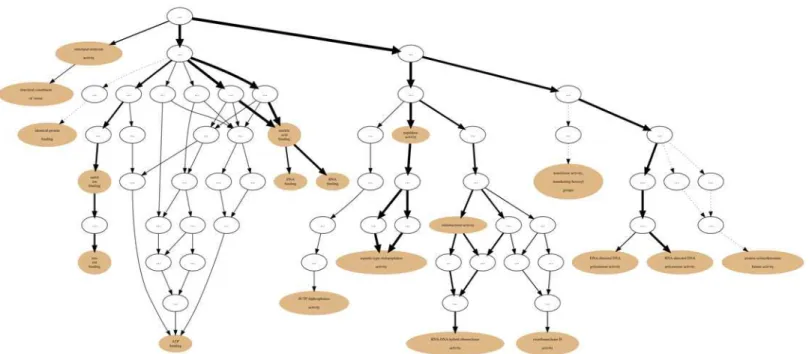
We have chosen to generate thebiological processsub-ontology annotation graph for Complex 3 of our Collection containing 133 YHTP2008 complexes we had previously loaded into GRY-FUN. This complex had been reported to contain multiple complexes, sharing sub-units exten-sively, specifically all three RNA polymerases [22].Table 3shows the terms found enriched in this Complex (for a significance level of 0.01). As expected, several terms related to RNA poly-merase I-III processes can be found in the list of enriched terms. SupplementaryS1 Fig.shows
Table 1. Term enrichment p-values for the PL1 Set significant terms (alpha = 0.01) while using the complete CAZy Collection as background.
term name p-value
lyase activity <5.315 × 10−248
pectate lyase activity 5.315 × 10−248
pectin lyase activity 2.558 × 10−094
metal ion binding 5.068 × 10−056
molecular_function 6.276 × 10−008
pectinesterase activity 1.146 × 10−007
catalytic activity 7.547 × 10−004
peroxidase activity 7.531 × 10−003
the respective annotation graph for Complex 3. Typically terms on thebiological process sub-ontology are more interconnected (as opposed to themolecular functionandcellular compo-nentsub-ontologies) and navigation can be more complicated. In this particular case, using the enrichment results alone does not clarify which node(s) to use forre-rooting, and hence simpli-fy the graph. However, following the“annotation flow”we reach the termRNA biosynthetic processthat annotates 37 of the 40 proteins in Complex 3 and is a parent to a number of en-riched terms in this Set and thus a likely candidate for are-rootingoperation. The resulting an-notation graph can be seen inFig. 9which is considerably easier to navigate than the original full annotation graph while retaining 11 of the 19 terms originally found enriched. This sub-set of 11 terms also present in the re-rooted graph also captures 3 of the most specific and
Fig 7. PL1 Set non-IEA annotation graph for the GOmolecular functionsub-ontology.Annotation graph subsuming the PL1 (within the CAZy Collection) Set GOmolecular functionsub-ontology annotations without electronic annotations (IEA).
representative terms for this protein Set (as indicated by their IC-based term score): transcrip-tion from RNA polymerase I promoter(0.229),transcription from RNA polymerase II promoter
(0.120) andtRNA transcription from RNA polymerase III promoter(0.345).
Additionally, we submitted the Cluster 3 (and respective background) proteins to the GOril-la enrichment analysis and visualization tool. SupplementaryS2 Fig.shows the respective an-notation graph generated by GOrilla. The graph produced by GOrilla is less extensive (in number of nodes) than the one generated by GRYFUN. That can easily be explained by the dif-ferent annotation corpus used by the two tools. Although the graph generated by GRYFUN is originally more extensive, that can be dynamically changed by using there-rootingfeature and thereby“reducing”the graph to its more relevant sub-graph branches. Interestingly, GOrilla graphs represent the statistical significance found for each term by coloring the respective
Table 2. Term annotated occurrence (occ) number, IC-based term score and enrichment p-values for the PL8 Set significant terms (alpha = 0.01) while using the complete CAZy Collection as background.
term name occ IC-based score p-value
carbon-oxygen lyase activity, acting on polysaccharides 196 0.426 <2.531 × 10−225
carbohydrate binding 191 0.268 2.531 × 10−225
hyaluronate lyase activity 44 0.147 2.081 × 10−124
chondroitin AC lyase activity 3 0.012 3.996 × 10−009
xanthan lyase activity 2 0.010 2.531 × 10−006
chondroitin-sulfate-ABC exolyase activity 2 0.009 2.531 × 10−006
heparin lyase activity 2 0.008 7.042 × 10−005
chondroitin-sulfate-ABC endolyase activity 1 0.004 1.595 × 10−003
acharan sulfate lyase activity 1 0.005 1.595 × 10−003
chondroitin B lyase activity 1 0.005 3.187 × 10−003
phosphatidylinositol phospholipase C activity 1 0.003 6.365 × 10−003
metal ion binding 7 0.004 9.978 × 10−003
doi:10.1371/journal.pone.0119631.t002
nodes according to a p-value color scale, while GRYFUN uses proportional edge thickness to represent the previously described“annotation flow”. Regarding the enriched terms, GOrilla detected 45 terms for a less restrictive p-value cut-off of 1.0 × 10⁻³(see SupplementaryS1 File). On the other, for the same cut-off, GRYFUN only identifies 16 terms as significant (see Supple-mentaryS2 File) of which 12 are contained in the GOrilla list. The difference in number of en-riched terms arises from the use of the Elim procedure [16,17] in GRYFUN. As previously explained, this technique mitigates the statistical dependencies between nodes downplaying an-cestor nodes. This is a desired effect, since (for a similar level of annotation quality) a more spe-cific annotation is preferable to a general annotation. Through the inspection of the GOrilla graph it can be seen that the bulk of the terms it identifies as significant are ancestors of the termsRNA biosynthesis processandtranscription DNA-templated. On the other hand, through GRYFUN we can see that both these terms annotate 37 of the 40 proteins in the Set. Further-more, 10 out of the 12 terms on the intersection of the enrichment lists from GRYFUN and GOrilla are children of these two terms. Therefore, from an annotation perspective the
Table 3. Term enrichment p-values for Complex 3 Set significant terms (alpha = 0.01) for the YHTP2008 Collection.
term name p-value
mRNA metabolic process <7.40 × 10−028
DNA metabolic process <7.40 × 10−028
tRNA transcription from RNA polymerase III promoter 7.404 × 10−028
transcription, RNA-templated 7.927 × 10−018
transcription from RNA polymerase I promoter 4.223 × 10−012
transcription from RNA polymerase II promoter 5.719 × 10−012
transcription of nuclear large rRNA transcript from RNA polymerase I promoter 6.694 × 10−010
transcription initiation from RNA polymerase II promoter 5.855 × 10−009
promoter clearance from RNA polymerase II promoter 3.006 × 10−005
transcription initiation from RNA polymerase III promoter 3.006 × 10−005
ribosome biogenesis 9.137 × 10−005
transcriptional start site selection at RNA polymerase II promoter 1.176 × 10−004
transcription elongation from RNA polymerase I promoter 5.622 × 10−04
phosphate-containing compound metabolic process 9.432 × 10−004
maintenance of transcriptionalfidelity during DNA-templated. . .
. . .transcription elongation from RNA polymerase II promoter 9.913 × 10−004
negative regulation of transcription elongation from RNA polymerase I promoter 9.913 × 10−004
regulation of rRNA processing 2.914 × 10−003
positive regulation of translational initiation 2.914 × 10−003
7-methylguanosine mRNA capping 5.710 × 10−003
doi:10.1371/journal.pone.0119631.t003
Fig 9. Complex 3 Set annotation graphre-rootedat theRNA biosynthetic processterm.Annotation graph of the Complex 3 (YHTP2008 Collection) Set for the GObiological processsub-ontologyre-rootedat theRNA biosynthetic processterm.
ancestors of these two terms are less interesting and GRYFUN becomes advantageous by re-ducing their relevance through the internal use of the Elim technique.
MEROPS
Within the MEROPS families previously imported into a GRYFUN Collection we randomly picked Set (family) A2 and generated its annotation graph and associated statistics for the GO
molecular functionsub-ontology. The annotation graph is shown inFig. 10whileTable 4
displays the associated statistics. The MEROPS website (http://merops.sanger.ac.uk/cgi-bin/ famsum?family=A2) describes peptidase family A2 as containing“endopeptidases with
Fig 10. A2 annotation graph.Annotation graph subsuming the A2 Set (MEROPS Collection) GOmolecular functionsub-ontology annotations. doi:10.1371/journal.pone.0119631.g010
Table 4. Term annotated occurrence (occ) number, IC-based term score and enrichment p-values for the A2 Set significant terms (alpha = 0.01) while using the complete collection of MEROPS Collection as background.
term name occ IC-based term score p-value
RNA-directed DNA polymerase activity 109 0.194 7.24 × 10−271
RNA-DNA hybrid ribonuclease activity 68 0.158 5.01 × 10−171
RNA binding 105 0.106 3.27 × 10−165
aspartic-type endopeptidase activity 120 0.222 1.05 × 10−131
exoribonuclease H activity 16 0.077 4.80 × 10−045
nucleic acid binding 134 0.074 1.82 × 10−041
DNA binding 48 0.035 4.86 × 10−035
DNA-directed DNA polymerase activity 18 0.034 5.18 × 10−032
zinc ion binding 73 0.091 3.36 × 10−031
structural molecule activity 33 0.039 3.86 × 10−022
structural constituent of virion 5 0.013 1.70 × 10−014
dUTP diphosphatase activity 4 0.012 4.88 × 10−011
phosphotransferase activity, alcohol group as acceptor 1 0.001 3.57 × 10−003
transferase activity, transferring hexosyl groups 1 0.002 3.57 × 10−003
catalytic sites of aspartic type”.Table 4shows that the enriched termaspartic-type endopepti-dase activityis the most specific and prevalent one (IC-based term score = 0.222; annotates 77% of the Set), thus supporting the MEROPS family classification for this Set. Additional high-scoring terms in this Set areRNA-directed DNA polymerase activity,RNA-DNA hybrid ri-bonuclease activityandRNA bindingall of which are functions inherently related to the re-ported family type, HIV-1 retropepsin. Furthermore, for this family the annotation graph is easy to navigate and there are several“annotation flow”paths flowing towards specific relevant terms. Hence, there are still potential annotation extension opportunities down each of these paths since none of the significant terms annotates all the proteins in the dataset.
Gene Expression Micro-array Data
Performance of GRYFUN was compared with that of two publicly available platforms for GO term enrichment (GOrilla & DAVID), with biological process terms being investigated, for a list of upregulated genes taken from a CF micro-array study [25]. GRYFUN identified 90 GO terms (out of 2006) considered statistically significant (alpha = 0.01) annotating the 150 pro-tein identifiers submitted, compared to the 5 identified by DAVID at the same significance level, and the 56 identified by GOrilla (default alpha = 0.001). Some terms were among the most significant identified by all three platforms, while others were only considered significant by one or two platforms, and there were some variations in the number of genes identified as annotated under specific GO terms (seeTable 5). The variations in the number of annotation occurrences for each term stem from the fact that each of the enrichment tools does not rely ex-actly on the same releases of annotation databases. GRYFUN also identified as being enriched several GO terms of definite biological significance in the pathophysiology of CF (eg,Positive Regulation of Cell Differentiation,Programmed Cell Death) which were undetected by other platforms (seeTable 5).
The relevance of enriched processes to CF, or any other condition being studied, has for GRYFUN as for other enrichment platforms including GOrilla and DAVID, to be assessed by the user, based on knowledge of the processes involved. Additionally, when analysing micro-array data such as this, where there is a high number of biological processes involved, the use of the occurrence number (on statistically enriched terms) can be a quick indicator of how gen-eral a process might be. Among the 90 significant GO terms identified by GRYFUN in our CF data set, approximately 30 had occurrence numbers between 5 and 15, and represented the most functionally relevant, including some of those shown inTable 5. The identification of
Table 5. Comparison of GO term enrichment analyses of micro-array data by GRYFUN, DAVID and GOrilla.Selected examples of GO terms found to be enriched in list of differentially expressed genes (upregulated in cysticfibrosis nasal epithelium [25]) by GRYFUN, DAVID or GOrilla. Occurrence (occ) numbers and p-values are shown.“Not found”means the GO term was not considered significant.
Terms (biological process) GRYFUN DAVID GOrilla
p-value occ p-value occ p-value occ
Response to Wounding 3.6 × 10−08 12 3.2 × 10−03 13 2.1 × 10−04 11
Immune Response 2.2 × 10−05 15 4.0 × 10−03 15 8.8 × 10−05 21
RNA Biosynthetic Process <1.0 × 10⁻¹³ 15 Not found Not found
Programmed Cell Death <1.0 × 10⁻¹³ 11 Not found Not found
Positive Regulation of Cell Differentiation 2.7 × 10−06 14 Not found 3.0 × 10−06 20
Negative Regulation of Cell Communication Not found 7.5 × 10−03 8 9.6 × 10−04 19
Inflammatory Response Not found 9.6 × 10−03 9 3.1 × 10−04 11
Ectoderm Development Not found 9.6 × 10−03 7 Not found
significantly enriched processes by DAVID and not by GRYFUN or GOrilla, and vice versa, may result from the different backgrounds used: the default DAVID background is composed of all human genes with at least one annotation in the category being analysed, whereas the GRYFUN/GOrilla backgrounds are user-defined, in this case being composed of genes repre-sented on the micro-array for which a UniProt accession number or Gene Symbol (respective-ly) was available. Future implementation of a default genome-wide background might
standardize the results of enrichment analyses, but the greater number of significant terms pro-duced by GRYFUN in the present analysis could nevertheless prove useful in generating func-tional hypotheses. For example, the three GO terms identified by GRYFUN inTable 5, of which only one was found by GOrilla and none by DAVID (RNA Biosynthetic Process, Pro-grammed Cell Death,Positive Regulation of Cell Differentiation), all have important roles in CF-mediated airway pathology [27–29].
The dataset generated here is subsumed by over two thousand (highly interconnected) GO terms (in the biological function sub-ontology), that in turn, renders an extremely complex in-teractive graph of difficult navigation and interpretation. This is a limitation of our current graph rendering engine. However, GRYFUN provides the possibility to download the underly-ing graph file (by pressunderly-ing the button“Export.dot”on the Set header) which can then be opened with a suitable external viewer application such as the free and cross-platform
ZGRViewer (http://zvtm.sourceforge.net/zgrviewer.html). In the future, we plan to implement strategies that help deal with very big graphs, such as pre-rendering additional filters and par-tial iterative graph loading. Notwithstanding, when a graph of difficult interpretation (due to number of nodes and edges) is generated it is currently possible to immediately perform re-rootingoperations from the associated term table while guided by the presented statistics. Thesere-rootingoperations will then result in smaller and more interpretable branches of the original graph.
Future Work
In the future we expect to extend the number of identifiers allowed and handled as input by GRYFUN, with the possibility of uploading customised annotation mapping files. Additionally, we intend to add features that enable the direct handling of data (such as directly creating new sets out of sub-selections of a set) in the main Graph Exploring interface page and supply pre-loaded Collections asbackgroundoptions. Regarding the graph output we plan to implement additional rendering options and apply other strategies in order to more efficiently deal with especially larger graphs. More importantly, we will be adding further metrics, that we are cur-rently developing, to measure and perform global assessments of the coherence and cohesive-ness of functional annotations and overall completecohesive-ness of annotation in a protein set. Furthermore, all code is available (under an MIT license) on a public GIT server (https:// bitbucket.org/hpbastos/gryfunserver/) so that anyone can modify, contribute to or simply de-ploy GRYFUN in their own servers.
Supporting Information
S1 Fig. Complex 3 Set annotation graph generated by GRYFUN.Annotation graph of the Complex 3 (YHTP2008 Collection) Set for the GObiological processsub-ontology graph gener-ated by GRYFUN.
(TIF)
by GOrilla. (TIF)
S1 File. Complex 3 Set enrichment results spreadsheet file output by GOrilla.Enrichment results spreadsheet file of the Complex 3 (YHTP2008 Collection) Set for the GObiological pro-cesssub-ontology generated by GOrilla.
(XLS)
S2 File. Complex 3 Set enrichment results TSV file output by GRYFUN.Enrichment results TSV file of the Complex 3 (YHTP2008 Collection) Set for the GObiological process sub-ontolo-gy generated by GRYFUN.
(TSV)
Acknowledgments
We wish to thank Bruno Tavares, Juliana Duque, Ana Teixeira and João Ferreira for their avail-ability in testing GRYFUN during the development and deployment stage and their respective feedback that was used to improve the web application.
Author Contributions
Conceived and designed the experiments: HPB FMC. Performed the experiments: HPB. Ana-lyzed the data: LS LAC. Wrote the paper: HPB LS LAC FMC.
References
1. du Plessis L,Škunca N, Dessimoz C (2011) The what, where, how and why of gene ontology—a primer
for bioinformaticians. Briefings in Bioinformatics 12: 723–735. doi:10.1093/bib/bbr002PMID: 21330331
2. Radivojac P, Clark WT, Oron TR, Schnoes AM, Wittkop T, et al. (2013) A large-scale evaluation of computational protein function prediction. Nat Meth 10: 221–227.
3. Valencia A (2005) Automatic annotation of protein function. Current Opinion in Structural Biology 15: 267–274. doi:10.1016/j.sbi.2005.05.010PMID:15922590
4. Ashburner M, Ball C, Blake J, Botstein D, Butler H, et al. (2000) Gene ontology: tool for the unification of biology. the gene ontology consortium. Nat Genet 25: 25–9.
5. Huang DW, Sherman BT, Lempicki RA (2009) Bioinformatics enrichment tools: paths toward the com-prehensive functional analysis of large gene lists. Nucleic Acids Research 37: 1–13. doi:10.1093/nar/ gkn923
6. Lee J, Katari G, Sachidanandam R (2005) Gobar: A gene ontology based analysis and visualization tool for gene sets. BMC Bioinformatics 6: 189. doi:10.1186/1471-2105-6-189PMID:16042800 7. Sealfon R, Hibbs M, Huttenhower C, Myers C, Troyanskaya O (2006) Golem: an interactive
graph-based gene-ontology navigation and analysis tool. BMC Bioinformatics 7: 1–9. doi: 10.1186/1471-2105-7-1
8. Eden E, Navon R, Steinfeld I, Lipson D, Yakhini Z (2009) Gorilla: a tool for discovery and visualization of enriched go terms in ranked gene lists. BMC Bioinformatics 10: 48. doi:10.1186/1471-2105-10-48 PMID:19192299
9. Chatziioannou AA, Moulos P (2011) Exploiting statistical methodologies and controlled vocabularies for prioritized functional analysis of genomic experiments: The stranger web application. Frontiers in Neuroscience 5. doi:10.3389/fnins.2011.00008PMID:21293737
10. Martin AJM, Walsh I, Domenico TD, MičetićI, Tosatto SCE (2013) Panada: Protein association network annotation, determination and analysis. PLoS ONE 8: e78383. doi:10.1371/journal.pone.0078383 PMID:24265686
11. Khatri P, Sirota M, Butte AJ (2012) Ten years of pathway analysis: Current approaches and outstanding challenges. PLoS Comput Biol 8: e1002375. doi:10.1371/journal.pcbi.1002375PMID:22383865 12. Gansner ER, North SC (2000) An open graph visualization system and its applications to software
13. Ellson J, Gansner ER, Koutsofios E, North SC, Woodhull G (2001) Graphviz - Open Source Graph Drawing Tools. Graph Drawing: 483–484.
14. Barrell D, Dimmer E, Huntley RP, Binns D, O’Donovan C, et al. (2009) The goa database in 2009 - an integrated gene ontology annotation resource. Nucleic Acids Research 37: 396–403. doi:10.1093/nar/ gkn803
15. Bastos HP, Clarke LA, Couto F (2013) Annotation extension through protein family annotation coher-ence metrics. Frontiers in Genetics 4. doi:10.3389/fgene.2013.00201PMID:24130572
16. Alexa A, Rahnenführer J, Lengauer T (2006) Improved scoring of functional groups from gene expres-sion data by decorrelating go graph structure. Bioinformatics 22: 1600–1607. doi:10.1093/
bioinformatics/btl140PMID:16606683
17. Robinson P, Bauer S (2011) Introduction to Bio-Ontologies. Chapman & Hall/CRC Mathematical & Computational Biology. Boca Raton: Taylor & Francis.
18. Resnik P (1995) Using information content to evaluate semantic similarity in a taxonomy. In: In Pro-ceedings of the 14th International Joint Conference on Artificial Intelligence. pp. 448–453.
19. Pesquita C, Faria D, Bastos H, Ferreira A, Falcão A, et al. (2008) Metrics for go based protein semantic
similarity: a systematic evaluation. BMC Bioinformatics 9: S4. doi:10.1186/1471-2105-9-S5-S4PMID: 18460186
20. Cantarel BL, Coutinho PM, Rancurel C, Bernard T, Lombard V, et al. (2009) The carbohydrate-active enzymes database (cazy): an expert resource for glycogenomics. Nucleic Acids Research 37: D233–
D238. doi:10.1093/nar/gkn663PMID:18838391
21. Lombard V, Bernard T, Rancurel C, Brumer H, Coutinho PM, et al. (2010) A hierarchical classification of polysaccharide lyases for glycogenomics. Biochemical Journal 432: 437–444. doi:10.1042/ BJ20101185PMID:20925655
22. Pu S, Wong J, Turner B, Cho E, Wodak SJ (2009) Up-to-date catalogues of yeast protein complexes. Nucleic Acids Research 37: 825–831. doi:10.1093/nar/gkn1005PMID:19095691
23. Pu S, Vlasblom J, Emili A, Greenblatt J, Wodak SJ (2007) Identifying functional modules in the physical interactome of saccharomyces cerevisiae. PROTEOMICS 7: 944–960. doi:10.1002/pmic.200600636 PMID:17370254
24. Rawlings ND, Barrett AJ, Bateman A (2012) Merops: the database of proteolytic enzymes, their sub-strates and inhibitors. Nucleic Acids Research 40: D343–D350. doi:10.1093/nar/gkr987PMID: 22086950
25. Clarke LA, Sousa L, Barreto C, Amaral MD (2013) Changes in transcriptome of native nasal epithelium expressing f508del-cftr and intersecting data from comparable studies. Respiratory Research 14: 38. doi:10.1186/1465-9921-14-38PMID:23537407
26. Breitling R, Armengaud P, Amtmann A, Herzyk P (2004) Rank products: a simple, yet powerful, new method to detect di erentially regulated genes in replicated microarray experiments. FEBS letters 573: 83–92. doi:10.1016/j.febslet.2004.07.055PMID:15327980
27. Booton R, Lindsay M (2014) Emerging role of micrornas and long noncoding rnas in respiratory dis-ease. Chest 146: 193–204. doi:10.1378/chest.13-2736PMID:25010962
28. Soleti R, Porro C, Martínez M (2013) Apoptotic process in cystic fibrosis cells. Apoptosis 18: 1029–
1038. doi:10.1007/s10495-013-0874-yPMID:23793868
29. Hajj R, Lesimple P, Nawrocki-Raby B, Birembaut P, Puchelle E, et al. (2007) Human airway surface ep-ithelial regeneration is delayed and abnormal in cystic fibrosis. The Journal of Pathology 211: 340–