Comparative transcriptome and potential antiviral signaling pathways analysis
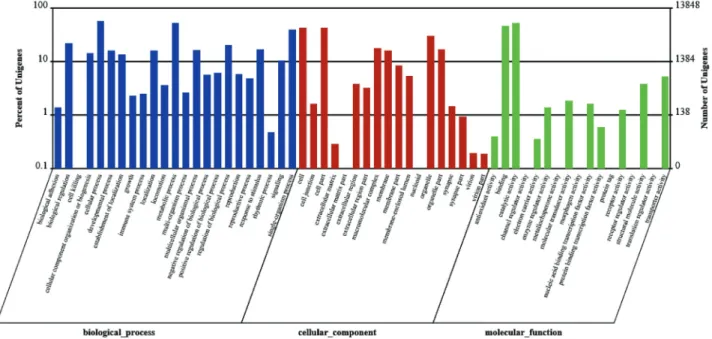
of the gills in the red swamp crayfish,
Procambarus clarkii
infected with White
Spot Syndrome Virus (WSSV)
Zhi-Qiang Du, Yan-Hui Jin
School of Life Science and Technology, Inner Mongolia University of Science and Technology, Baotou, Inner
Mongolia Autonomous Region, China.
Abstract
Red swamp crayfish is an important model organism for research of the invertebrate innate immunity mechanism. Its excellent disease resistance against bacteria, fungi, and viruses is well-known. However, the antiviral mechanisms of crayfish remain unclear. In this study, we obtained high-quality sequence reads from normal and white spot syn-drome virus (WSSV)-challenged crayfish gills. For group normal (GN), 39,390,280 high-quality clean reads were randomly assembled to produce 172,591 contigs; whereas, 34,011,488 high-quality clean reads were randomly as-sembled to produce 182,176 contigs for group WSSV-challenged (GW). After GO annotations analysis, a total of 35,539 (90.01%), 14,931 (37.82%), 28,221 (71.48%), 25,290 (64.05%), 15,595 (39.50%), and 13,848 (35.07%) unigenes had significant matches with sequences in the Nr, Nt, Swiss-Prot, KEGG, COG and GO databases, re-spectively. Through the comparative analysis between GN and GW, 12,868 genes were identified as differentially up-regulated DEGs, and 9,194 genes were identified as differentially down-regulated DEGs. Ultimately, these DEGs were mapped into different signaling pathways, including three important signaling pathways related to innate immu-nity responses. These results could provide new insights into crayfish antiviral immuimmu-nity mechanism.
Keywords: Procambarus clarkii; WSSV; gills; Illumina sequencing;de novoassembly; comparative transcriptomics.
Received: May 12, 2016; Accepted: July 5, 2016.
Introduction
Unlike vertebrates, invertebrates lack an acquired im-mune system, but they develop the innate imim-mune system, including cellular and humoral immune responses (Duet al., 2010). When hosts suffer insults or infections from pathogens, these genes can be synergistically mobilized to play their respective roles in cellular defense, especially in the humoral immune response (Taffoni and Pujol, 2015). Further study of the coordination mechanisms of the inver-tebrate innate immune system by immune-related genes is crucial.
As a typical invertebrate, the red swamp crayfish is used as a model organism to research the response princi-ples of the invertebrate innate immune system. This species is native to Northeastern Mexico and South America and was introduced into China from Japan in the 1930s (Shenet al., 2014). Because of its good fitness characteristics, strong adaptability to a changing environment, and high fe-cundity, the red swamp crayfish has been widely aqua-cultured in China (Manfrin et al., 2015). Currently, this
crayfish has become one of the economically most impor-tant aquacultured species. Additionally, the excellent resistances of red swamp crayfish against bacteria, fungi, and viruses are well-known. Recent studies have shown that antibacterial and antifungal mechanisms, such as the Toll and Imd pathways, are strongly conserved (Ermolaeva and Schumacher, 2014). However, the antiviral mechanism in this species remains unclear (Ramos and Fernandez-Ses-ma, 2015). Systematically identifying the antiviral genes and antivirus-related signaling pathways in this species through transcriptome sequencing is crucial.
Recently, several reports have described transcrip-tome sequencing results of crayfish tissues, including the hepatopancreas, muscle, ovary, testis, eyestalk, spermary, epidermis, branchia, intestines, and stomach (Shenet al., 2014; Manfrinet al., 2015). However, the transcriptome of crayfish gills or white spot syndrome virus (WSSV)-chal-lenged tissues have not been reported. More importantly, the crayfish gills are in direct contact with the external envi-ronment, and gill cells are crucial in the response to external biotic and abiotic factors, especially pathogenic microor-ganisms (Clavero-Salaset al., 2007). Due to their large number of hemocytes, gills play an important role in cellu-lar host defense against pathogens (Egaset al., 2012). The Send correspondence to Zhi-Qiang Du. School of Life Science and
Technology, Inner Mongolia University of Science and Technology, No.7 Arding Street, Baotou City, Inner Mongolia Autonomous Re-gion 014010, China. E-mail: [email protected]
gills are a vital organ that can remove invasive pathogens through an efficient and specific immune response. The study of the gill transcriptome will define an important part of the research field of the innate immune response mecha-nism.
Next-generation sequencing (NGS) technology has been widely used to explore and uncover vast genetic infor-mation in model organisms (Jianget al., 2014). NGS tech-nology is superior to the traditional Sanger sequencing technology in many aspects. For example, NGS technology can provide enormous amounts of sequence data in much shorter times and at a much lower cost (Martin and Wang, 2011). The expressed sequences produced using NGS tech-nologies are usually 10-to100-fold greater than the number identified by traditional Sanger sequencing technologies (Christieet al., 2015). In this study, the HiSeq sequencing technology was used to sequence the transcriptomes of nor-mal and WSSV-challenged crayfish gills. This approach was used to generate expression profiles and to discover differentially expressed genes (DEGs) between normal and WSSV-challenged crayfish gills. The functions of DEGs were annotated and classified by the Gene Ontology (GO), Cluster of Orthologous Groups (COG), and Kyoto Ency-clopedia of Genes and Genomes (KEGG) databases. We believe the data obtained from this study could provide an important resource for research about genes functions, mo-lecular events, and signaling pathways related to the inver-tebrate antiviral immune response.
Materials and Methods
Preparation of crayfish tissues and immune challenge
P. clarkii (weighing approximately 15–20 g) were purchased from an aquaculture commercial market in Hangzhou, Zhejiang Province, China. The collected cray-fish were originally cultured in water tanks at 26–28°C for 10 days and fed twice a day with artificial food throughout the whole experiment (Li Yet al., 2012). To mimic WSSV infection, WSSV (3.2 107copies per crayfish) was injected into the abdominal segment of each crayfish (Duet al., 2009). Thirty-six hours after the viral challenge, gills were collected from at least ten WSSV-challenged crayfish (Group WSSV-challenged (GW)). Gills were also col-lected from ten controls, uninfected crayfish designated as the Group normal (GN). All gills were immediately frozen in liquid nitrogen after collection, and samples were tempo-rarily stored at –80°C until total RNA extraction (Du and Jin, 2015).
RNA isolation and Illumina sequencing
The two types of gill tissue samples (GN and GW) previously frozen in liquid nitrogen were delivered to the Beijing Genomics Institute-Shenzhen (BGI, Shenzhen, China) for total RNA extraction. In brief, total RNA from
crayfish gills was extracted with TRIzol reagent in accor-dance with manufacturer’s protocol (Invitrogen, Life Technologies, Grand Island, NY, USA). The quality of RNA samples treated with DNase I (Invitrogen) was exam-ined for subsequent procedures, including mRNA purifica-tion, cDNA library construction and transcriptome se-quencing. Approximately 5mg of DNase-treated total RNA was used to construct a cDNA library following the proto-cols of the Illumina TruSeq RNA Sample Preparation Kit (Illumina, San Diego, CA, USA). After necessary quantifi-cation and qualifiquantifi-cation, the library was sequenced using an Illumina HiSeq 2000 instrument with 100 bp paired-end (PE) reads for both groups.
Transcriptomede novoassembly and analysis
Transcriptomede novoassembly for all samples was carried out by the RNA-Seq de novo assembly program Trinity (Dedeineet al., 2015). In brief, raw reads generated by the Illumina HiSeq 2000 sequencer were originally trimmed by removing the adapter sequences. After low-quality reads with low-quality scores£20 and short reads with a length£10 bp were removed, high-quality clean reads were obtained to execute transcriptomede novoassembly using the Trinity software with the default parameters. Generally, three steps were performed, including Inchworm, Chrysalis and Butterfly (Heet al., 2015). Initially, high-quality clean reads were processed by Inchworm to form longer frag-ments, called contigs. Then, contigs were connected by Chrysalis to obtain unigenes, which could not be extended on either end. Unigenes resulted in de Bruijn graphs. Finally, the de Bruijn graphs were processed by Butterfly to obtain transcripts (Liet al., 2013).
Transcriptome annotation and Gene Ontology analysis
were analyzed using the Blast2GO software (http://www.blast2go.com/b2ghome) (Conesa et al., 2005). Based on the KEGG database, the complex biologi-cal behavior of the genes was analyzed through pathway annotation.
Identification of differentially expressed genes
To acquire the expression profiles of transcripts in crayfish gills, cleaned reads were first mapped to all tran-scripts using Bowtie software (Langmead and Salzberg, 2012). Then, DEGs were obtained on the basis of fragments per kilobase of exon per million fragments mapped (FPKM) of the genes, followed by a False Discovery Rate (FDR) control, to correct for the P-value (Mortazaviet al., 2008). DEGs were identified using EDGER software (em-pirical analysis of digital gene expression data in R) (Rob-insonet al., 2010). In the analysis process, the filtering threshold was set as a 0.5 FDR control. Ultimately, an FDR
£0.001 and the absolute value of the log2Ratio³1 were used as the filtering threshold to determine the significance of DEGs (Bananiet al., 2016). DEGs (GWvs GN) were identified through a comparative analysis of the above data.
Quantitative real-time PCR
Quantitative real-time PCR (qRT-PCR) methods were used to determine the RNA levels for 15 selected genes related to innate immune response (Wang et al., 2015). For the qRT-PCR analysis, cDNA templates from the samples were diluted 20-fold in nuclease-free water and used as templates for the PCR reaction. Gene-specific primers sequences were designed using Primer Premier 6 software on the basis of each identified gene sequence from the transcriptome library (Lu et al., 2014). The specific primersPc-18 S RNA-qRT-F (5’-tct tct tag agg gat tag cgg-3’) andPc-18 S RNA-qRT-R (5’-aag ggg att gaa cgg gtt a-3’) were used to amplify the18 S RNAgene as an internal control. qRT-PCR was performed following the manufac-turer’s instructions of SYBR Premix Ex Taq (Takara, Da-lian, China) using a real-time thermal cycler (Bio-Rad, USA) in a total volume of 10ml containing 5ml of 2 Premix Ex Taq, 1ml of the 1:20 diluted cDNA, and 2ml (1mM) each of the forward and reverse primers. The amplification procedure was comprised of an initial denaturation step at 95°C for 3min, followed by 40 cycles of 95°C for 15s, 58°C for 40 s, and melting from 65°C to 95°C. Three parallel ex-periments were performed (Duet al., 2015). Furthermore, the differentially expressed levels of the target genes be-tween the groups were calculated by the 2-DDCT analysis
method (Livak and Schmittgen, 2001). Data obtained were subjected to a statistical analysis, followed by an unpaired samplet-test. A significant difference was assigned when P < 0.05 or P < 0.01.
Results
Illumina sequencing of the crayfish gills transcriptome
After the GN sample was cleaned and quality-tested, 39,390,280 clean reads were identified from 40,384,330 raw reads, which corresponded to 3,939,028,000 total nu-cleotides (nt). The Q20 percentage (percentage of bases whose quality was³20 in the clean reads), N percentage (percentage of uncertain bases after filtering) and GC per-centage were 98.02%, 0.00% and 41.52%, respectively (Table 1). For the GW sample, 34,011,488 clean reads were identified from 34,840,334 raw reads, which corresponded to 3,401,148,800 total nucleotides (nt). The Q20 percent-age, N percentage and GC percentage were 98.04%, 0.00% and 41.98%, respectively (Table 1). All these sequences were used for further analysis.
De novoassembly of the transcriptome
After the low-quality and short length reads were re-moved, high-quality clean reads were obtained, and trans-criptomede novo assembly was performed using Trinity software with its default parameters (Aliet al., 2015). For GN, 39,390,280 high-quality clean reads were randomly assembled to produce 172,591 contigs with an N50 of 690 bp. The contigs were further assembled and clustered into 94,479 unigenes with a mean length of 644 nt, which were composed of 10,931 distinct clusters and 83,548 distinct singletons. The N50 of the above unigenes was 1,345 bp (Table 2). For GW, 34,011,488 high-quality clean reads were randomly assembled to produce 182,176 contigs with an N50 of 528 bp. The contigs were further assembled and clustered into 95,959 unigenes with a mean length of 558 nt, which were composed of 8,299 distinct clusters and 87,660 distinct singletons. The N50 of the above unigenes was 1,007 bp (Table 2).
For GN, the lengths of unigenes were primarily dis-tributed between 200 nt and 2,000 nt. The percentage of unigenes with lengths from 201–500 bp was 70.30% (66,423), from 501–1,000 bp was 14.07% (13,294), from 1,001–1,500 bp was 5.40% (5,099), from 1,501–2,000 bp was 3.23% (3,048), and > 2,000 bp was 7.00% (6,615). For GW, the percentage of unigenes with lengths from 201–500
Table 1- Summary of Illumina sequencing output for the GN and the GW.
bp was 74.12% (71,124), from 501–1,000 bp was 13.44% (12,897), from 1,001–1,500 bp was 4.91% (4,711), from 1,501–2,000 bp was 2.58% (2,479), and > 2,000 bp was 4.95% (4,748).
Functional annotation of predicted proteins
Transcripts were combined with data from two other transcriptomes from Mousaviet al.(2014). First, sequence annotation was carried out on the basis of unigenes from the merged group (Garcia-Secoet al., 2015). Then, the putative functions of all unigenes were analyzed based on GO and COG classifications (Younget al., 2010). In the present study, based on the merged group transcriptome data (98,676 unigenes), a basic sequence analysis was perfor-med to understand the functions of the crayfish gill trans-criptome before the analysis of DEGs related to WSSV infection. Among the predicted sequences, a total of 39,482 unigene sequences were annotated using a BLASTx align-ment with an E-value£10-5. A total of 35,539 (90.01%), 14,931 (37.82%), 28,221 (71.48%), 25,290 (64.05%), 15,595 (39.50%), and 13,848 (35.07%) unigenes had sig-nificant matches with sequences in the Nr, Nt, Swiss-Prot, KEGG, COG and GO databases, respectively. In brief, a to-tal of 35,539 transcripts (90.01% of all annotated tran-scripts) had significant hits in the Nr protein database. The gene names of the top BLAST hits were assigned to each transcript with significant hits. Among them, 2,682 (7.55%) transcripts were matched with genes from Para-mecium tetraurelia, 2,362 (6.65%) transcripts were matched with genes fromDaphnia pulex; 3,265 (9.19%) transcripts were matched with genes from Tetrahymena thermophila; 1,302 (3.66%) transcripts were matched with genes from Tribolium castaneum; 1,292 (3.64%) tran-scripts were matched with genes from Ichthyophthirius multifiliis; and 929 transcripts were matched with genes fromPediculus humanus.
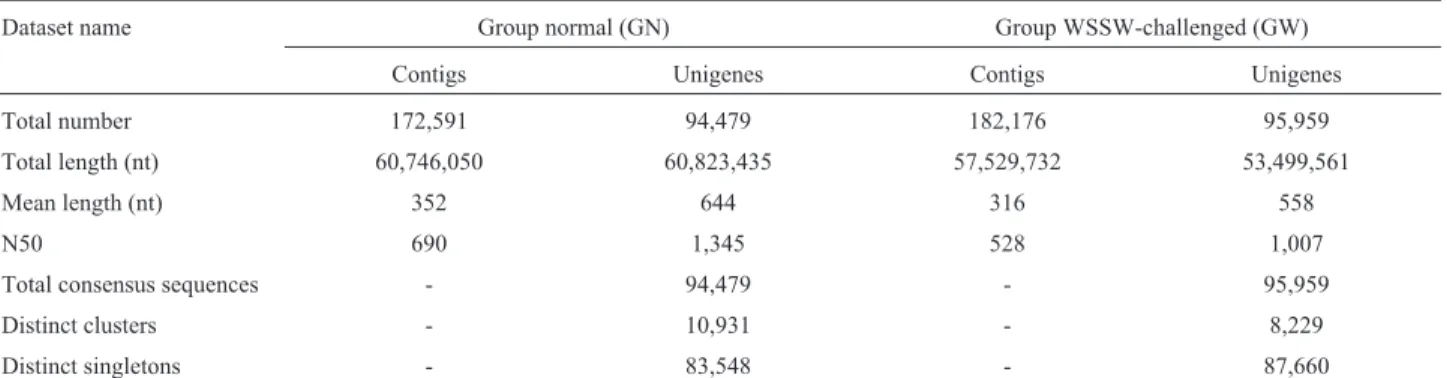
The GO classification is an international standardized gene function classification system that provides a dynami-cally updated controlled vocabulary and an exactly defined conception to describe genes’ characteristics and their products in any organism (Diet al., 2015). The GO classifi-cation includes three ontologies: biological process,
cellu-lar component and molecucellu-lar function (Chenet al., 2015). In this study, a GO analysis was carried out using Blast2GO software. A total of 13,848 transcripts annotated in the GO database were categorized into 58 functional groups, in-cluding the three main GO ontologies (Figure 1). Among these functional groups, “biological regulation”, “cellular process”, “metabolic process”, “cell”, “single-organism process”, “cell part”, “binding”, and “catalytic activity” terms were predominant.
COGs were delineated by comparing protein se-quences encoded in complete genomes, representing major phylogenetic lineages (Tatusovet al., 2003). COG classifi-cation analysis is also an important method for unigene functional annotation and evolutionary research (Lai and Lin, 2013). We used the COG classification to further eval-uate the completeness of the transcriptome library and the effectiveness of the annotation methods. A total of 15,959 unigenes were mapped to 25 different COG categories. In these 25 different categories, the largest COG group was category R, representing “general function prediction only” (6,435 unigenes, 41.26%), followed by category J, repre-senting “translation, ribosomal structure and biogenesis” (3,347 unigenes, 21.46%); category K, representing “tran-scription” (3,044 unigenes, 19.52%); and category L, repre-senting “replication, recombination and repair” (2,802 unigenes, 17.97%; Figure 2).
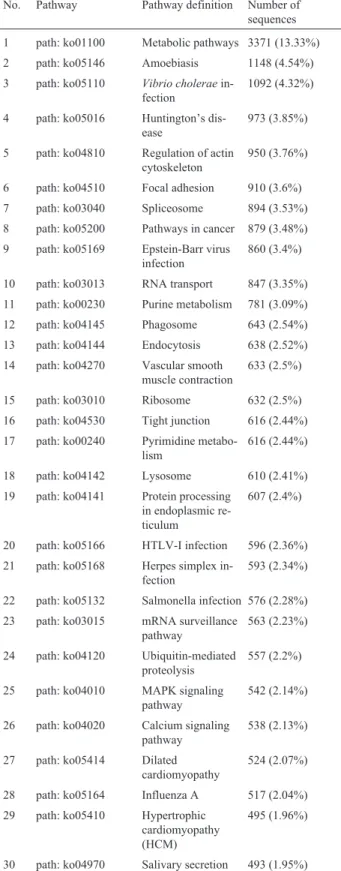
KEGG is a bioinformatics resource for linking geno-mes to life and the environment (Maoet al., 2005). The KEGG pathway database records networks of molecular in-teractions in cells and variants specific to particular organ-isms (Chenet al., 2015). The genes from the merged groups (GN and GW) were categorized using the KEGG database to obtain more information to predict the unigene functions (Fenget al., 2015). A total of 25,290 unigenes were classi-fied into 257 KEGG pathways. Among these KEGG path-ways, the top 30 statistically significant KEGG classifica-tions are shown in Table 3. Moreover, some important innate immunity-related pathways were predicted in this KEGG database, includingVibrio choleraeinfection (1092 sequences, 4.32%), focal adhesion (910 sequences, 3.6%), Epstein-Barr virus infection (860 sequences, 3.40%), lysosome (610 sequences, 2.41%), HTLV-I infection (596 Table 2- Summary of the assembly analysis for GN and GW.
Dataset name Group normal (GN) Group WSSW-challenged (GW) Contigs Unigenes Contigs Unigenes
Total number 172,591 94,479 182,176 95,959
Total length (nt) 60,746,050 60,823,435 57,529,732 53,499,561
Mean length (nt) 352 644 316 558
N50 690 1,345 528 1,007
Total consensus sequences - 94,479 - 95,959
Distinct clusters - 10,931 - 8,229
sequences, 2.36%), Herpes simplex infection (593 sequen-ces, 2.34%), salmonella infection (576 sequensequen-ces, 2.28%), MAPK signaling pathway (542 sequences, 2.14%),
adherens junction (467 sequences, 1.85%), and so on (Table 3). Notably, the insulin signaling pathway, Wnt sig-naling pathway, mRNA surveillance pathway, endocytosis,
Figure 1- Gene ontology (GO) classification of transcripts from the two gill samples (GN and GW). The three main GO categories include biological process (blue), cellular component (red), and molecular function (green).
phagosome, and tight junction functions were present in the top 40 statistically significant KEGG classifications.
Differentially expressed genes analysis of crayfish gills after WSSV infection
Previous sequence analysis and annotation for all unigenes in the merged group provided some useful infor-mation to analyze the crayfish gills transcriptome. Even more importantly, variation in the gene expression level of crayfish gills after WSSV infection was expected. In this study, an FDR£0.001 and an absolute value of log2Ratio³
1 were used as the filtering threshold to determine up-regulated or down-up-regulated genes between normal and WSSV-challenged crayfish gills. As shown in Figure 3, a total of 22,062 DEGs with a > two-fold change were identi-fied by the comparative analysis between the GN and GW samples, including 12,868 differentially up-regulated and 9,194 differentially down-regulated genes. In brief, among these 22,062 DEGs, 12,826 genes were expressed in both GN and GW, including 3,632 differentially up-regulated genes and 9,194 differently down-regulated genes. More-over, 9,236 genes were only expressed in the GW sample.
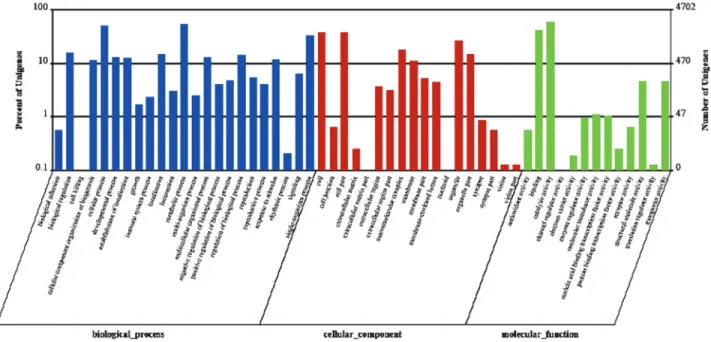
To confirm the biological function of DEGs between GN and GW, GO classification and KEGG pathway analy-sis for the DEGs were carried out (Guptaet al., 2015). A GO classification analysis was conducted on the annotated transcripts using Blast2GO. As shown in Figure 4, a total of 4,702 DEGs were identified after a comparison between GN and GW. Significantly altered expression (up/down) was present for 45 GO terms (P < 0.05) and 32 GO terms, respectively (P < 0.01). Among the former group, there were 15, 8, and 22 GO terms that belonged to “cellular component (C)”, “molecular function (F)” and “biological process (P)”, respectively. Among the latter group, there were 14, 3, and 15 GO terms that belonged to “cellular component (C)”, “molecular function (F)” and “biological Table 3- Top 30 statistically significant KEGG classifications.
No. Pathway Pathway definition Number of sequences 1 path: ko01100 Metabolic pathways 3371 (13.33%) 2 path: ko05146 Amoebiasis 1148 (4.54%) 3 path: ko05110 Vibrio cholerae
in-fection
1092 (4.32%)
4 path: ko05016 Huntington’s dis-ease
973 (3.85%)
5 path: ko04810 Regulation of actin cytoskeleton
950 (3.76%)
6 path: ko04510 Focal adhesion 910 (3.6%) 7 path: ko03040 Spliceosome 894 (3.53%) 8 path: ko05200 Pathways in cancer 879 (3.48%) 9 path: ko05169 Epstein-Barr virus
infection
860 (3.4%)
10 path: ko03013 RNA transport 847 (3.35%) 11 path: ko00230 Purine metabolism 781 (3.09%) 12 path: ko04145 Phagosome 643 (2.54%) 13 path: ko04144 Endocytosis 638 (2.52%) 14 path: ko04270 Vascular smooth
muscle contraction
633 (2.5%)
15 path: ko03010 Ribosome 632 (2.5%) 16 path: ko04530 Tight junction 616 (2.44%) 17 path: ko00240 Pyrimidine
metabo-lism
616 (2.44%)
18 path: ko04142 Lysosome 610 (2.41%) 19 path: ko04141 Protein processing
in endoplasmic re-ticulum
607 (2.4%)
20 path: ko05166 HTLV-I infection 596 (2.36%) 21 path: ko05168 Herpes simplex
in-fection
593 (2.34%)
22 path: ko05132 Salmonella infection 576 (2.28%) 23 path: ko03015 mRNA surveillance
pathway
563 (2.23%)
24 path: ko04120 Ubiquitin-mediated proteolysis
557 (2.2%)
25 path: ko04010 MAPK signaling pathway
542 (2.14%)
26 path: ko04020 Calcium signaling pathway
538 (2.13%)
27 path: ko05414 Dilated cardiomyopathy
524 (2.07%)
28 path: ko05164 Influenza A 517 (2.04%) 29 path: ko05410 Hypertrophic
cardiomyopathy (HCM)
495 (1.96%)
30 path: ko04970 Salivary secretion 493 (1.95%)
process (P)”, respectively. The GO analysis revealed that gene clusters with significant differential expression mainly concentrated in the aspect of biological process.
Next, all DEGs were mapped in the KEGG database to search for genes involved in innate immune response or signaling pathways. A total of 7,918 DEGs were assigned to 256 KEGG pathways. The KEGG pathway analysis identified 100 pathways that were significantly changed (P < 0.05),of which 80 reached a higher level of significance
(P < 0.01) in the GW compared with the GN. Some of the significantly altered KEGG pathways were related to the innate immunity response, including apoptosis, Staphylo-coccus aureusinfection, lysosome, melanogenesis, TGF-beta signaling pathway, NOD-like receptor signaling path-way, PPAR signaling pathpath-way, focal adhesion, toll-like re-ceptor signaling pathway, and bacterial invasion of epithelial cells (Table 4).
Figure 4- Gene ontology (GO) classification analysis of differentially expressed genes (DEGs) between GN and GW. The three main GO categories in-clude biological process (blue), cellular component (red), and molecular function (green).
Table 4- Top 80 differentially expressed pathways between GW and GN.
No. Pathway Number of DEGs
P-value Pathway ID
1 Glycolysis / Gluconeogenesis
99 (1.25%) 3,78E-199 ko00010
2 RNA transport 219 (2.77%) 4.26E-92 ko03013 3 Epithelial cell
signal-ing
64 (0.81%) 3.64E-19 ko05120
4 Apoptosis 73 (0.92%) 2.29E-17 ko04210 5 Allograft rejection 3 (0.04%) 7.15E-15 ko05330 6 Renin-angiotensin
sys-tem
31 (0.39%) 2.42E-14 ko04614
7 p53 signaling pathway 55 (0.69%) 1.62E-12 ko04115 8 mTOR signaling
path-way
126 (1.59%) 2.34E-12 ko04150
9 Endocytosis 177 (2.24%) 2.35E-11 ko04144 10 Staphylococcus aureus
infection
36 (0.45%) 1.87E-10 ko05150
11 Leishmaniasis 28 (0.35%) 4.16E-10 ko05140 12 Protein processing in
ER
249 (3.14%) 9.51E-10 ko04141
No. Pathway Number of DEGs
P-value Pathway ID
13 Synthesis and degrada-tion of ketone bodies
12 (0.15%) 1.05E-09 ko00072
14 Metabolism of xeno-biotics by P450
50 (0.63%) 3.28E-09 ko00980
15 Phe, Tyr and Try biosynthesis
13 (0.16%) 4.22E-09 ko00400
16 Taurine and hypo-taurine metabolism
5 (0.06%) 5.99E-09 ko00430
17 Collecting duct acid secretion
44 (0.56%) 9.75E-09 ko04966
18 Chronic myeloid leu-kemia
43 (0.54%) 2.35E-08 ko05220
19 Pentose phosphate pathway
30 (0.38%) 2.69E-08 ko00030
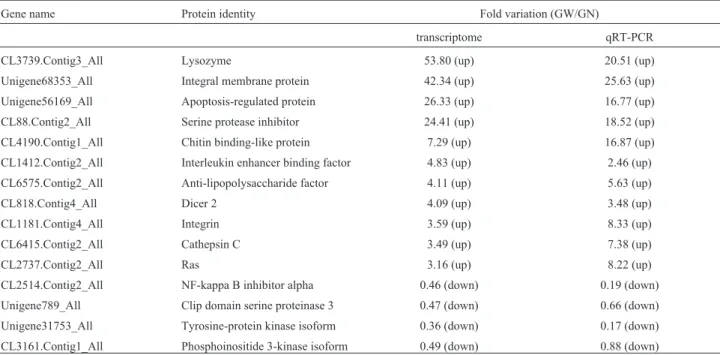
Analysis of transcriptome data by qRT-PCR
We chose 15 genes related to the innate immunity re-sponse and evaluated their differential expression level be-tween the GW and the GN, using qRT-PCR (Gaoet al., 2015). For these candidate genes, the variation trends of the
qRT-PCR expression profiles were found to be consistent with the RNA-seq data (Table 5). There were similar trends in the genes that were up-/down-regulated between the qRT-PCR and the transcriptome data, implying that the dif-ferential expression changes identified by the RNA-Seq data were reliable.
No. Pathway Number of DEGs
P-value Pathway ID
24 Valine, leucine and isoleucine biosynthesis
12 (0.15%) 2.72E-07 ko00290
25 Melanogenesis 108 (1.36%) 5.39E-07 ko04916 26 Butanoate metabolism 40 (0.51%) 5.58E-07 ko00650 27 Base excision repair 45 (0.57%) 6.18E-07 ko03410 28 Long-term depression 41 (0.52%) 6.57E-07 ko04730 29 Hepatitis C 73 (0.92%) 2.47E-06 ko05160 30 Mismatch repair 23 (0.29%) 3.24E-06 ko03430 31 Salivary secretion 185 (2.34%) 3.85E-06 ko04970 32 Histidine metabolism 38 (0.48%) 4.50E-06 ko00340 33 Bacterial invasion of
epithelial cells
102 (1.29%) 1.05E-05 ko05100
34 Amoebiasis 458 (5.78%) 1.21E-05 ko05146 35 Propanoate
metabo-lism
72 (0.91%) 1.25E-05 ko00640
36 Synaptic vesicle cycle 85 (1.07%) 1.39E-05 ko04721 37 Ubiquinone and
terpe-noid-quinone biosyn-thesis
11 (0.14%) 1.48E-05 ko00130
38 Influenza A 201 (2.54%) 1.78E-05 ko05164 39 Retrograde
endocan-nabinoid signaling
71 (0.9%) 2.46E-05 ko04723
40 Prostate cancer 113 (1.43%) 3.11E-05 ko05215 41 Metabolic pathways 1189
(15.02%)
3.81E-05 ko01100
42 Starch and sucrose me-tabolism
52 (0.66%) 3.95E-05 ko00500
43 Glyoxylate and dicar-boxylate metabolism
50 (0.63%) 7.25E-05 ko00630
44 Cocaine addiction 39 (0.49%) 0.000103 ko05030 45 Endocrine 97 (1.23%) 0.000119 ko04961 46 Phenylalanine
metabo-lism
33 (0.42%) 0.000136 ko00360
47 HTLV-I infection 198 (2.5%) 0.000137 ko05166 48 Chemokine signaling
pathway
116 (1.47%) 0.000142 ko04062
49 Vasopressin-regulated water reabsorption
88 (1.11%) 0.000148 ko04962
50 Endometrial cancer 42 (0.53%) 0.00015 ko05213 51 TGF-beta signaling
pathway
65 (0.82%) 0.000158 ko04350
52 NOD-like receptor sig-naling pathway
68 (0.86%) 0.000224 ko04621
53 Regulation of actin cytoskeleton
228 (2.88%) 0.000291 ko04810
No. Pathway Number of DEGs
P-value Pathway ID
54 Transcriptional mis-regulation in cancer
116 (1.47%) 0.000355 ko05202
55 GnRH signaling path-way
103 (1.3%) 0.000478 ko04912
56 Glycine, serine and threonine metabolism
68 (0.86%) 0.000653 ko00260
57 Citrate cycle (TCA cy-cle)
89 (1.12%) 0.000814 ko00020
58 Pancreatic cancer 67 (0.85%) 0.000861 ko05212 59 Cardiac muscle
con-traction
95 (1.2%) 0.000893 ko04260
60 Tyrosine metabolism 66 (0.83%) 0.000972 ko00350 61 Sphingolipid
metabo-lism
31 (0.39%) 0.00143 ko00600
62 Oocyte meiosis 203 (2.56%) 0.001598 ko04114 63 Adipocytokine
signal-ing pathway
68 (0.86%) 0.001695 ko04920
64 Gastric acid secretion 151 (1.91%) 0.001769 ko04971 65 Peroxisome 173 (2.18%) 0.001809 ko04146 66 PPAR signaling
path-way
106 (1.34%) 0.001873 ko03320
67 Drug metabolism -other enzymes
44 (0.56%) 0.001887 ko00983
68 Neurotrophin signaling pathway
128 (1.62%) 0.002169 ko04722
69 Tryptophan metabo-lism
69 (0.87%) 0.002208 ko00380
70 Cysteine and methio-nine metabolism
45 (0.57%) 0.002622 ko00270
71 Taste transduction 26 (0.33%) 0.003256 ko04742 72 Fatty acid biosynthesis 2 (0.03%) 0.003716 ko00061 73 Focal adhesion 268 (3.38%) 0.004214 ko04510 74 Glycosphingolipid
bio-synthesis - ganglio se-ries
13 (0.16%) 0.004679 ko00604
75 Huntington’s disease 315 (3.98%) 0.005037 ko05016 76 Toll-like receptor
sig-naling pathway
66 (0.83%) 0.00549 ko04620
77 Insect hormone biosynthesis
12 (0.15%) 0.005932 ko00981
78 D-Arginine and D-or-nithine metabolism
13 (0.16%) 0.007501 ko00472
79 Progesterone-mediated oocyte maturation
151 (1.91%) 0.007619 ko04914
80 Pancreatic secretion 122 (1.54%) 0.009396 ko04972
Discussion
Transcriptome sequencing is an effective method for obtaining genomic information from non-model organism with no available reference genome. The genomic informa-tion is the important basis to discover molecular mecha-nisms of the organism’s biological traits. Due to its superior antiviral immune characteristics, crayfish has become the economically most important aquacultured species in China. However, research on the antiviral molecular mech-anisms is scarce. In the present study,de novoassembled transcriptomes of crayfish gills were analyzed, and a large number of sequences were obtained. DEGs that differed in expression between normal and WSSV-challenged cray-fish gills were studied in detail. All these transcriptomes data are valuable to shed light on the antiviral immune mechanism of crayfish.
So far, several studies based on the NGS technology have reported transcriptome sequencing results for crayfish tissues, including hepatopancreas, muscle, ovary, testis, eyestalk, spermary, epidermis, branchia, intestines, and stomach. Those studies mainly focused on gonadal devel-opment (Jianget al., 2014), neuroendocrinology (Manfrin
et al., 2015), and genetic markers (Shen et al., 2014). Transcriptome sequencing results for crayfish antiviral im-munity are very limited, and very few works about crayfish transcriptomes changing after virus challenge are reported. So, the aim of the present study was an in-depth analysis of DEGs by functional annotation, orthologous protein clus-tering, and annotation of signaling pathways related to the immune system to determine the underlying mechanisms involved in the crayfish anti-WSSV immune response.
Based on the KEGG pathway analysis for DEGs be-tween the GN and GW, some signaling pathways related to the invertebrate innate immune system were identified. Apoptosis is an indispensable physiologic and biochemical process that evolved in eukaryotes to remove excessive and damaged cells to maintain organismal integrity. Apoptosis plays an important role in the processes of cell differentia-tion, development, and proliferation (Elmore, 2007). When organisms encounter a pathogen infection and other envi-ronment stresses, apoptosis can be mobilized to regulate cell metabolism (Igney and Krammer, 2002). Cell prolifer-ation controlled by apoptosis has been reported to be in-volved in the antiviral immunity response (Duet al., 2013). In the present study, 73 representative innate immune-related genes were significantly differentially expressed in the apoptosis signaling pathway. Within this group, 52 DEGs were significantly up-regulated, and 21 DEGs were significantly down-regulated (Figure 5).
Melanogenesis is an important biochemical pathway responsible for melanin synthesis that is controlled by com-plex regulatory mechanisms (Kim, 2015). Melanin is a vital intermediate in the arthropod humoral immunity response. In the present study, 108 innate immunity-related genes in the melanogenesis pathway were significantly differen-tially expressed, including 73 significantly up-regulated genes and 35 significantly down-regulated genes (Figure 6).
Toll-like receptors (TLRs) are a group of highly con-served molecules that play a vital role in the recognition of pathogen-associated molecular patterns (PAMPs) and in the activation of innate immune responses to infectious agents (Zhang and Lu, 2015). Many studies have implied the TLRs signaling pathway in both antibacterial and anti-Table 5- Comparison of relative fold change of RNA-Seq and qRT-PCR results between GW and GN.
Gene name Protein identity Fold variation (GW/GN)
transcriptome qRT-PCR CL3739.Contig3_All Lysozyme 53.80 (up) 20.51 (up) Unigene68353_All Integral membrane protein 42.34 (up) 25.63 (up) Unigene56169_All Apoptosis-regulated protein 26.33 (up) 16.77 (up) CL88.Contig2_All Serine protease inhibitor 24.41 (up) 18.52 (up) CL4190.Contig1_All Chitin binding-like protein 7.29 (up) 16.87 (up) CL1412.Contig2_All Interleukin enhancer binding factor 4.83 (up) 2.46 (up) CL6575.Contig2_All Anti-lipopolysaccharide factor 4.11 (up) 5.63 (up) CL818.Contig4_All Dicer 2 4.09 (up) 3.48 (up) CL1181.Contig4_All Integrin 3.59 (up) 8.33 (up) CL6415.Contig2_All Cathepsin C 3.49 (up) 7.38 (up)
CL2737.Contig2_All Ras 3.16 (up) 8.22 (up)
Figure 5- Significant differentially expressed genes (DEGs) identified by KEGG as involved in the apoptosis signaling pathway. Red boxes indicate sig-nificantly increased expression, green boxes indicate sigsig-nificantly decreased expression and blue boxes indicate unchanged expression.
fungal defense (De Nardo, 2015). In this study, 66 innate immunity-related genes in the TLRs signaling pathway were significantly differentially expressed, including 49 significantly up-regulated genes and 17 significantly down-regulated genes (Figure 7).
The three abovementioned signaling pathways were significantly changed (P < 0.01) between GN and GW, which suggests that they may play an important role in crayfish antiviral immunity responses. These results could provide new insights for future research on crayfish antivi-ral immunity.
In conclusion, many genes and pathways related to innate immunity were modified after WSSV infection of crayfish gills. Leveraging the gene expression changes into a model of altered network functions could provide new in-sights into the crayfish antiviral immunity mechanism and could also highlight candidate proteins that should be tar-geted to solve viral disease problems in the crayfish breed-ing process.
Acknowledgments
This work was financially supported by the National Natural Science Foundation of China (Grant No. 31460698).
References
Ali MY, Pavasovic A, Mather PB and Prentis PJ (2015) Trans-criptome analysis and characterisation of gill-expressed car-bonic anhydrase and other key osmoregulatory genes in freshwater crayfish Cherax quadricarinatus. Data Brief 5:187-193.
Banani H, Marcet-Houben M, Ballester AR, Abbruscato P, Gon-zález-Candelas L, Gabaldón T and Spadaro D (2016) Ge-nome sequencing and secondary metabolism of the
postharvest pathogen Penicillium griseofulvum. BMC
Genomics 17:e19.
Chen K, Li E, Li T, Xu C, Wang X, Lin H, Qin JG and Chen L (2015) Transcriptome and molecular pathway analysis of the hepatopancreas in the Pacific White ShrimpLitopenaeus vannamei under chronic low-salinity stress. PLoS One 7:e0131503.
Chen K, Li E, Xu Z, Li T, Xu C, Qin JG and Chen L (2015) Com-parative transcriptome analysis in the hepatopancreas tissue of Pacific White ShrimpLitopenaeus vannameifed different lipid sources at low salinity. PLoS One 12:e0144889. Christie AE, Chi M, Lameyer TJ, Pascual MG, Shea DN,
Stan-hope ME, Schulz DJ andDickinson PS (2015) Neuro-peptidergic signaling in the American Lobster Homarus americanus: New insights from high-throughput nucleotide sequencing. PLoS One 12:e0145964.
Clavero-Salas A, Sotelo-Mundo RR, Gollas-Galván T, Hernán-dez-López J, Peregrino-Uriarte AB, Muhlia-Almazán A and Yepiz-Plascencia G (2007) Transcriptome analysis of gills from the white shrimpLitopenaeus vannameiinfected with White Spot Syndrome Virus. Fish Shellfish Immunol 2:459-472.
Conesa A, Götz S, García-Gómez JM, Terol J, Talón M and Robles M (2005) Blast2GO: A universal tool for annotation, visualization and analysis in functional genomics research. Bioinformatics 18:3674-3676.
De Nardo D (2015) Toll-like receptors: Activation, signalling and transcriptional modulation. Cytokine 2:181-189.
Dedeine F, Weinert LA, Bigot D, Josse T, Ballenghien M, Cahais V, Galtier N and Gayral P (2015) Comparative analysis of transcriptomes from secondary reproductives of three
Di Lena P, Domeniconi G, Margara L and Moro G (2015) GOTA: GO term annotation of biomedical literature. BMC Bioin-formatics 16:e346.
Du ZQ and Jin YH (2015) Molecular characterization and anti-bacterial activity analysis of two novel penaeidin isoforms from Pacific White Shrimp, Litopenaeus vannamei. Appl Biochem Biotechnol 8:1607-1620.
Du ZQ, Ren Q, Zhao XF and Wang JX (2009) A double WAP do-main (DWD)-containing protein with proteinase inhibitory
activity in Chinese white shrimp, Fenneropenaeus
chinensis. Comp Biochem Physiol B Biochem Mol Biol 2:203-210.
Du ZQ, Li XC, Wang ZH, Zhao XF and Wang JX (2010) A single
WAP domain (SWD)-containing protein with
anti-pathogenic relevance in red swamp crayfish,Procambarus clarkii.Fish Shellfish Immunol 1:134-142.
Du ZQ, Lan JF, Weng YD, Zhao XF and Wang JX (2013) BAX inhibitor-1 silencing suppresses white spot syndrome virus replication in red swamp crayfish, Procambarus clarkii. Fish Shellfish Immunol 1:46-53.
Du ZQ, Yuan JJ and Ren DM (2015) A novel single WAP do-main-containing protein isoform with antibacterial rele-vance in Litopenaeus vannamei. Fish Shellfish Immunol 2:478-484.
Egas C, Pinheiro M, Gomes P, Barroso C and Bettencourt R (2012) The transcriptome ofBathymodiolus azoricusgill re-veals expression of genes from endosymbionts and free-living deep-sea bacteria. Mar Drugs 8:1765-1783.
Elmore S (2007) Apoptosis: A review of programmed cell death. Toxicol Pathol 4:495-516.
Ermolaeva MA and Schumacher B (2014) Insights from the worm: The C elegans model for innate immunity. Semin Immunol 4:303-309.
Feng D, Li Q, Yu H, Zhao X and Kong L (2015) Comparative transcriptome analysis of the Pacific Oyster Crassostrea gigascharacterized by shell colors: Identification of genetic bases potentially involved in pigmentation. PLoS One 12:e0145257.
Gao Y, Zhang X, Wei J, Sun X and Yuan J (2015) Whole transcriptome analysis provides insights into molecular mechanisms for molting in Litopenaeus vannamei.PLoS One 12:e0144350.
Garcia-Seco D, Zhang Y, Gutierrez-Mañero FJ, Martin C and Ramos-Solano B (2015) RNA-Seq analysis and transcripto-me assembly for blackberry (Rubus sp Var Lochness) fruit. BMC Genomics 16:e5.
Gupta P, Goel R, Agarwal AV, Asif MH, Sangwan NS, Sangwan RS and Trivedi PK (2015) Comparative transcriptome anal-ysis of different chemotypes elucidates withanolide
bio-synthesis pathway from medicinal plant Withania
somnifera.Sci Rep 5:e18611.
He W, Zhuang H, Fu Y, Guo L, Guo B, Guo L, Zhang X and Wei Y (2015)De novotranscriptome assembly of a Chinese Lo-coweed (Oxytropis ochrocephala) species provides insights into genes associated with drought, salinity, and cold toler-ance. Front Plant Sci 6:e1086.
Igney FH and Krammer PH (2002) Death and anti-death: Tumour resistance to apoptosis. Nat Rev Cancer 4:277-288. Jiang H, Xing Z, Lu W, Qian Z, Yu H and Li J (2014)
Transcripto-me analysis of red swamp crawfishProcambarus clarkii
re-veals genes involved in gonadal development. PLoS One 8:e105122.
Kim K (2015) Effect of ginseng and ginsenosides on melano-genesis and their mechanism of action. J Ginseng Res 1:1-6. Lai ZX and Lin YL (2013) Analysis of the global transcriptome of
longan (Dimocarpus longanLour) embryogenic callus us-ing Illumina paired-end sequencus-ing. BMC Genomics 14:e561.
Langmead B and Salzberg SL (2012) Fast gapped-read alignment with Bowtie 2. Nat Methods 4:357-359.
Leng X, Jia H, Sun X, Shangguan L, Mu Q, Wang B and Fang J (2015) Comparative transcriptome analysis of grapevine in response to copper stress. Sci Rep 5:e17749.
Li D, Liang Y, Wang X, Wang L, Qi M, Yu Y and Luan Y (2015) Transcriptomic analysis ofMusca domesticato reveal key genes of the prophenoloxidase-activating system. G3 (Bethesda) 9:1827-1841.
Li S, Zhang X, Sun Z, Li F and Xiang J (2013) Transcriptome analysis on Chinese shrimpFenneropenaeus chinensis dur-ing WSSV acute infection. PLoS One 3:e58627.
Li ST, Zhang P, Zhang M, Fu CH, Zhao CF, Dong YS, Guo AY
and Yu LJ (2012a) Transcriptional profile of Taxus
chinensis cells in response to methyl jasmonate. BMC Genomics 13:295.
Li Y, Deng W, Yang K and Wang W (2012b) The expression of
prophenoloxidase mRNA in red swamp crayfish,
Procambarus clarkii, when it was challenged. Genomics 6:355-360.
Livak KJ and Schmittgen TD (2001) Analysis of relative gene ex-pression data using real-time quantitative PCR and the 2(-Delta Delta C(T)). Methods 4:402-408.
Lu X, Kim H, Zhong S, Chen H, Hu Z and Zhou B (2014)De novo
transcriptome assembly for rudimentary leaves in Litchi chinesis Sonnand identification of differentially expressed genes in response to reactive oxygen species. BMC Geno-mics 15:e805.
Manfrin C, Tom M, De Moro G, Gerdol M, Giulianini PG and Pallavicini A (2015) The eyestalk transcriptome of red swamp crayfishProcambarus clarkia.Gene 1:28-34. Mao XZ, Cai T, Olyarchuk JG and Wei LP (2005) Automated
ge-nome annotation and pathway identification using the KEGG Orthology (KO) as a controlled vocabulary. Bioin-formatics 19:3787-3793.
Martin JA and Wang Z (2011) Next-generation transcriptome as-sembly. Nat Rev Genet 10:671-682.
Mortazavi A, Williams BA, McCue K, Schaeffer L and Wold B (2008) Mapping and quantifying mammalian transcrip-tomes by RNA-Seq. Nat Methods 7:621-628.
Mousavi S, Alisoltani A, Shiran B, Fallahi H, Ebrahimie E, Imani A and Houshmand S (2014)De novotranscriptome assem-bly and comparative analysis of differentially expressed genes inPrunus dulcis Millin response to freezing stress. PLoS One 8:e104541.
Ramos I and Fernandez-Sesma A (2015) Modulating the innate immune response to influenza A virus: Potential therapeutic use of anti-inflammatory drugs. Front Immunol 6:e361. Robinson MD, McCarthy DJ and Smyth GK (2010) EdgeR: A
Shen H, Hu Y, Ma Y, Zhou X, Xu Z, Shui Y, Li C, Xu P and Sun X (2014) In-depth transcriptome analysis of the red swamp crayfishProcambarus clarkii. PLoS One 10:e110548.
Taffoni C and Pujol N (2015) Mechanisms of innate immunity in
C elegansepidermis. Tissue Barriers 4:e1078432.
Tatusov RL, Fedorova ND, Jackson JD, Jacobs AR, Kiryutin B, Koonin EV, Krylov DM, Mazumder R, Mekhedov SL, Nikolskaya AN,et al.(2003) The COG database: An up-dated version includes eukaryotes. BMC Bioinformatics 1:e41.
Wang P, Wang J, Su YQ, Mao Y, Zhang JS, Wu CW, Ke QZ, Han KH, Zheng WQ and Xu ND (2015) Transcriptome analysis
of the Larimichthys crocea liver in response to
Cryptocaryon irritans.Fish Shellfish Immunol 48:1-11. Young MD, Wakefield MJ, Smyth GK and Oshlack A (2010)
Gene ontology analysis for RNA-seq: Accounting for selec-tion bias. Genome Biol 2:R14.
Zhang E and Lu M (2015) Toll-like receptor (TLR)-mediated in-nate immune responses in the control of hepatitis B virus (HBV) infection. Med Microbiol Immunol 1:11-20.
Associate Editor: Houtan Noushmehr