Predictors of Disease Evolution and Acute
Events in COPD Patients
Paolo Pandolfi1*, Alessandro Zanasi2, Muriel Assunta Musti1, Elisa Stivanello1, Lara Pisani3, Sabrina Angelini4, Francesca Maffei5, Silvana Hrelia5, Cristina Angeloni5, Corrado Zenesini1, Patrizia Hrelia4
1Department of Public Health, Local Health Authority of Bologna, Bologna, Italy,2Pneumology Unit, Sant’Orsola-Malpighi Hospital, Bologna, Italy,3Department of Clinical, Integrated and Experimental Medicine, Respiratory and Clinical Care Unit, Sant’Orsola-Malpighi Hospital, Bologna, Italy,4Department of Pharmacy and Biotechnology, Alma Mater Studiorum, University of Bologna, Bologna, Italy,5Department for Life Quality Studies, Alma Mater Studiorum, University of Bologna, Rimini, Italy
Abstract
Background
Socio-economic, cultural and environmental factors are becoming increasingly important determinants of chronic obstructive pulmonary disease (COPD). We conducted a study to investigate socio-demographic, lifestyle and clinical factors, and to assess their role as pre-dictors of acute events (mortality or hospitalization for respiratory causes) in a group of COPD patients.
Methods
Subjects were recruited among outpatients who were undertaking respiratory function tests at the Pneumology Unit of the Sant’Orsola-Malpighi Hospital, Bologna. Patients were classi-fied according to the GOLD Guidelines.
Results
229 patients with COPD were included in the study, 44 with Mild, 68 Moderate, 52 Severe and 65 Very Severe COPD (GOLD stage). Significant differences among COPD stage, in terms of smoking status and fragility index, were detected. COPD stage significantly affected the values of all clinical tests (spirometry and ABG analysis). Kaplan-Meier esti-mates showed a significant difference between survival curves by COPD stage with lower event-free probability in very severe COPD stage. Significant risk factors for acute events were: underweight (HR = 4.08; 95% CI 1.01–16.54), having two or more comorbidities (HR = 4.71; 95% CI 2.52–8.83), belonging to moderate (HR = 3.50; 95% CI 1.01–12.18) or very severe COPD stage (HR = 8.23; 95% CI 2.35–28.85).
a11111
OPEN ACCESS
Citation:Pandolfi P, Zanasi A, Musti MA, Stivanello E, Pisani L, Angelini S, et al. (2015) Socio-Economic and Clinical Factors as Predictors of Disease Evolution and Acute Events in COPD Patients. PLoS ONE 10(8): e0135116. doi:10.1371/journal. pone.0135116
Editor:William Checkley, Johns Hopkins University, UNITED STATES
Received:August 7, 2014
Accepted:July 19, 2015
Published:August 7, 2015
Copyright:© 2015 Pandolfi et al. This is an open access article distributed under the terms of the Creative Commons Attribution License, which permits unrestricted use, distribution, and reproduction in any medium, provided the original author and source are credited.
Data Availability Statement:All relevant data are within the paper and its Supporting Information files.
Funding:The study has been supported by Fondazione del Monte di Bologna e Ravenna (http:// www.fondazionedelmonte.it/) and Fondazione CARISBO, Bologna (http://www.fondazionecarisbo.it/ fondazionecarisbo/page.do). The funders had no role in study design, data collection and analysis, or preparation of the manuscript.
Conclusions
Our findings indicate that fragility is associated with COPD stage and that comorbidities and the low body mass index are predictors of mortality or hospitalization. Besides spirometric analyses, FeNO measure and comorbidities, body mass index could also be considered in the management and monitoring of COPD patients.
Introduction
Chronic obstructive pulmonary disease (COPD) is a complex disease characterized by persis-tent airflow limitation, usually progressive, associated with enhanced chronic inflammatory
response in the airways and the lung to noxious particles or gases [1]. COPD is a leading cause
of morbidity and mortality worldwide, with peaks in particular in low and middle-income countries, and is responsible for an increase in social costs by governments and individuals.
The Global Burden of Disease Study estimated that COPD will become the third leading
cause of death worldwide by 2020 [2]. In addition, considering the sum of years lost because of
premature mortality and years of life lived with disability [Disability-Adjusted Life Year (DALY)], it has been estimated that by 2030 COPD will be the seventh leading cause of DALYs
lost worldwide [2]. In Italy, COPD affects about 14% of the older population (65 years or
more) and is the fifth cause of hospital admission in this age group. Several variables have been identified as factors influencing COPD life expectancy, including smoking, degree of dyspnoea, age, exercise capacity, body mass index (BMI), exacerbations, comorbidities, and quality of life
[3–10]. They may be valuable in the assessment of severity and progression of disease and
eval-uate the response to medical intervention [11–12]. Several prognostic COPD indices have been
identified [12]. However applying a prognostic index in a patient population other than the
one in which it was developed, may require recalibration and/or modification [12].
At the base of major chronic diseases, such as COPD, there are common and modifiable risk factors, including unhealthy diet, tobacco use, alcohol abuse, and lack of physical activity but also non-modifiable risk factors such as age and genetic predisposition. In the last years, socio-economic, cultural, political and environmental factors are becoming increasingly important determinants of COPD. In view of this, we conducted a study to investigate socio-demographic, lifestyle and clinical factors in a population affected by COPD, and to assess their role as predictors of acute events (mortality or hospitalization for respiratory causes) in a group of COPD patients.
Materials and Methods
Subjects
The study was conducted as part of the multidisciplinary projectRespirare Bologna(Breath
Bologna) aimed at assessing determinants of health status outcomes in COPD patients. Subjects were enrolled consecutively among outpatients who were undertaking respiratory
function tests at the Pneumology Unit of the Sant’Orsola-Malpighi Hospital, Bologna, from
guidelines [1] in: Mild (GOLD 1), Moderate (GOLD 2), Severe (GOLD 3) and Very Severe (GOLD 4).
Ethics Statement
The present is an observational study where no new diagnostic tool and/or drug treatment was provided to any participant. Participants were treated according to routine clinical care. Like-wise, patients data were collected as part of standard clinical care during a routine consultation. The authors were not involved in the patients medical treatment. According to the Italian law on retrospective evaluation of case series (Gazzetta Ufficiale n. 76, 31-3-2008) ethics approval was not necessary and authors did not ask for it. Nevertheless the study was conducted in accordance to the Italian Law n. 196/2003 about personal data treatment (D. Lgs 30 giugno 2003, n. 196. Gazzetta Ufficiale 2003, 174, S.O., 2003). Data were anonymized prior to the anal-yses after database linkage was done. Only one author conducting database linkage had access to patients identifying information. Only patients who provided written informed consent prior to participating in the study were enrolled according to the Helsinki Declaration and later Amendments. No minors/children were enrolled in the present study.
Socio-demographic and clinical variables
Comprehensive socio-demographic, lifestyle and clinical data were collected by physician interviewers through the use of a predefined questionnaire during a routine clinical consulta-tion. In particular, as far as socio-demographic and lifestyle characteristics, the following infor-mation were collected: age, gender, educational status, smoking status, including n. packs of cigarettes/year and physical activity (having carried out any physical activity that caused an increase in breathing, heart pulses or sweating). Moreover, for each participant a deprivation and a fragility index were attributed.
The deprivation index was developed by Caranci et al. using variables from the 2001
Gen-eral Census of Population and Housing [13]. Five traits that represented the
multidimensional-ity of the social and material deprivation concept were considered: low level of education, unemployment, non-home ownership, one-parent family and household overcrowding. The
index is calculated by summing standardized indicators [13]. The fragility index, developed by
the Local Health Authority of Bologna represents the probability of acute hospitalization or death in the following year and ranges from 0 to 100. The index was derived from a predictive
model following the experience of the Combined Predictive Model [14] which aims to identify
individuals at high-risk of re-hospitalization or death. The predictive model included demo-graphic variables (age, gender), clinical variables such as heart failure, diabetes, cancer, lung disease, hospitalizations and access to emergency care during the previous year and social vari-ables (deprivation index).
The following clinical characteristics were collected for each participant: Charlson index, Fraction Exhaled Nitric Oxide (FeNO), PaO2, PaCO2, pH, FVC, FEV1, FEV1/FVC (%), FVC (% of total) and FEV1 (% of total). The Charlson Comorbidity Index contains 19 categories of
comorbidity [15]. In this paper this index is expressed in 3 categories: no comorbidity, one
comorbidity and two or more comorbidities. FeNO levels were evaluated using a Niox chemi-luminescence analyser (Aerocrine AB, Solna, Sweden). According to the American Thoracic Society (ATS) guideline, the subjects inhaled nitric oxide free air to total lung capacity and then
exhaled at a constant flow rate against a valve connected to the nitric oxide analyzer [16]. We
used the mean value of FeNO levels obtained in two tests. The measurements of pH, PaO2and
PaCO2were evaluated using arterial blood gas (ABG) analysis. FEV1 and FVC were obtained
In addition, two anthropometric characteristics were collected: BMI and waist circumference. BMI was determined from height and weight measured at the time of the first visit, and
catego-rized into four groups: underweight (<18.5kg/m2), normal (18.5–24.9kg/m2), overweight (25–
29.9 kg/m2) and obese (>30kg/m2).
Outcome
Acute events were defined in case of death for respiratory causes (X International Classification of Diseases codes J00-J99) or hospitalization for respiratory causes (IX International
Classifica-tion of Diseases codes 460–519.9) occurred from October 2010 to December 2012 in and
out-side Bologna. Data were extracted from the Mortality Registry and the Hospital Admission Database of the Local Health Authority of Bologna.
Statistical analysis
Continuous variables are presented as mean ± standard deviation (SD), while categorical
vari-ables as absolute frequency (relative frequency). Kruskal-Wallis, Pearson’s chi-square and
Fish-er’s exact tests were used to compare variables among COPD GOLD stages as appropriate. The
unit of analysis was the patient. The survival function was calculated with Kaplan-Meier esti-mates for each GOLD stage and compared using log-rank test. Univariate and multivariate Cox regression analyses were performed to study the association between acute events and the following risk factors: age, gender, BMI, educational qualification, physical activity, smoking status, deprivation index, Charlson index and GOLD stages (Model 1). In a second model we replicated the analyses omitting the GOLD stage (Model 2). In a sensitivity analyses clinical
variables such as PaO2 and FEV1 were considered instead of the GOLD stage. AllP-values are
based on 2-sided tests andP0.05 were considered significant. Statistical analysis was
per-formed using statistical package Stata Intercooled for Windows, version 12.0.
Results
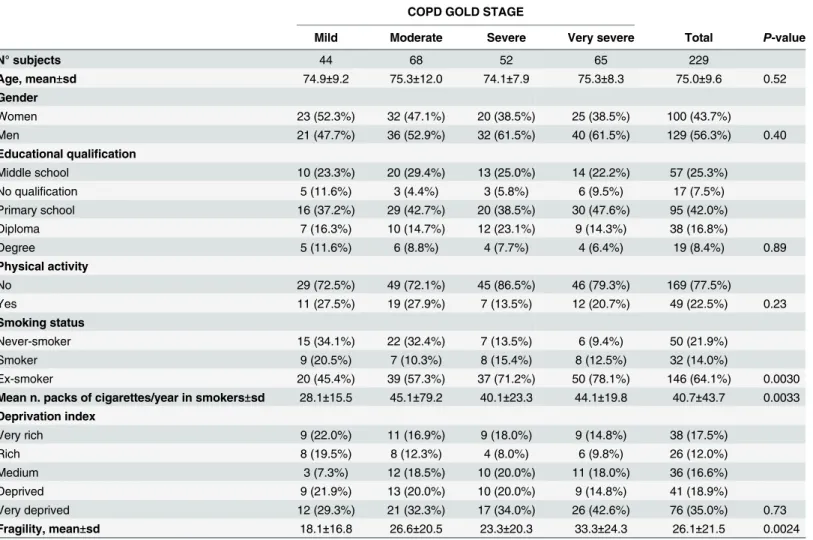
Table 1shows the results regarding the social and lifestyles characteristics observed in the study population. 229 patients (129 male and 100 female; mean age 75±9.6 years) affected by COPD were enrolled in the study. According to the GOLD Guideline patients were classified as follows: 44 mild COPD, 68 moderate COPD, 52 severe COPD and 65 very severe COPD. In the overall population 42% of the patients had an education level of primary school, the major-ity (77.5%) did not practice any physical activmajor-ity, more than 60% were ex-smokers and more than 50% turned out to be deprived or very deprived. The mean fragility index was 26.1. Signif-icant differences within COPD stage, in terms of smoking status, were detected. Interestingly, a relationship between the increase of the fragility index and the severity of COPD was observed.
Table 2provides the details of clinical and anthropometric characteristics of the study popu-lation. There were non-significant differences in BMI and waist circumference among COPD stage. On the contrary, the stage was significantly associated with the values of all clinical tests (spirometry and ABG analysis). Furthermore the highest percentage of patients (42.2%) who had two or more comorbidities was observed in the group suffering from very severe COPD.
During the study period 71 patients experienced at least one acute event (69 hospitalizations and 14 deaths). Kaplan-Meier estimates show that there is a significant difference between
sur-vival curves by COPD stage (P<0.001) (Fig 1).
In particular, by considering the single curves, patients in the mild group have a higher
event-free probability than patients in the moderate group (P= 0.024), patients in the severe
moderate group patients do not show a significant difference in event-free probability
com-pared with the severe group (P= 0.93).
Characteristics significantly associated with acute events in the univariate analyses were the
Charlson index, COPD stage (Table 3) and FEV1(data not shown). In model 1, two or more
comorbidities and COPD stage (mild and very severe) were confirmed as risk factors. Two or
more comorbidities were associated with a 4.5-fold increased risk (HR = 4.50; 95% CI 2.39–
8.49;P<0.001); moderate and very severe COPD stages were associated with a 3.5 and a 8.23
–fold increased risk for acute events (HR = 3.50; 95% CI 1.01–12.18,P= 0.049 and HR = 8.23;
95% CI 2.35–28.85,P= 0.0010 respectively). As the GOLD stage could be on the causal
path-way between some prognostic variables and COPD health status outcomes [17], we performed
a multivariate analysis omitting GOLD stage as a covariate (Model 2). In this analysis
under-weight was a risk factors for acute events (HR = 4.08; 95% CI 1.01–16.54;P= 0.049). In the
sen-sitivity analyses, when we included FEV1 and PaO2instead of COPD stage in the model,
gender, the Charlson index and FEV1 proved to be associated with acute events. A greater risk
is observed in male gender vs female (HR 2.01; 95% CI 1.05–3.84), in patients with two or
more comorbidities versus patients without comorbidities (HR = 4.17; 95% CI 2.16–8.04). A
reduced risk is observed for every increase in 1 litre FEV1 (HR = 0.26; 95% CI 0.13–0.54) (S1
Table).
Table 1. Social and lifestyles characteristics in COPD population.
COPD GOLD STAGE
Mild Moderate Severe Very severe Total P-value
N° subjects 44 68 52 65 229
Age, mean±sd 74.9±9.2 75.3±12.0 74.1±7.9 75.3±8.3 75.0±9.6 0.52
Gender
Women 23 (52.3%) 32 (47.1%) 20 (38.5%) 25 (38.5%) 100 (43.7%)
Men 21 (47.7%) 36 (52.9%) 32 (61.5%) 40 (61.5%) 129 (56.3%) 0.40
Educational qualification
Middle school 10 (23.3%) 20 (29.4%) 13 (25.0%) 14 (22.2%) 57 (25.3%)
No qualification 5 (11.6%) 3 (4.4%) 3 (5.8%) 6 (9.5%) 17 (7.5%)
Primary school 16 (37.2%) 29 (42.7%) 20 (38.5%) 30 (47.6%) 95 (42.0%)
Diploma 7 (16.3%) 10 (14.7%) 12 (23.1%) 9 (14.3%) 38 (16.8%)
Degree 5 (11.6%) 6 (8.8%) 4 (7.7%) 4 (6.4%) 19 (8.4%) 0.89
Physical activity
No 29 (72.5%) 49 (72.1%) 45 (86.5%) 46 (79.3%) 169 (77.5%)
Yes 11 (27.5%) 19 (27.9%) 7 (13.5%) 12 (20.7%) 49 (22.5%) 0.23
Smoking status
Never-smoker 15 (34.1%) 22 (32.4%) 7 (13.5%) 6 (9.4%) 50 (21.9%)
Smoker 9 (20.5%) 7 (10.3%) 8 (15.4%) 8 (12.5%) 32 (14.0%)
Ex-smoker 20 (45.4%) 39 (57.3%) 37 (71.2%) 50 (78.1%) 146 (64.1%) 0.0030
Mean n. packs of cigarettes/year in smokers±sd 28.1±15.5 45.1±79.2 40.1±23.3 44.1±19.8 40.7±43.7 0.0033 Deprivation index
Very rich 9 (22.0%) 11 (16.9%) 9 (18.0%) 9 (14.8%) 38 (17.5%)
Rich 8 (19.5%) 8 (12.3%) 4 (8.0%) 6 (9.8%) 26 (12.0%)
Medium 3 (7.3%) 12 (18.5%) 10 (20.0%) 11 (18.0%) 36 (16.6%)
Deprived 9 (21.9%) 13 (20.0%) 10 (20.0%) 9 (14.8%) 41 (18.9%)
Very deprived 12 (29.3%) 21 (32.3%) 17 (34.0%) 26 (42.6%) 76 (35.0%) 0.73
Fragility, mean±sd 18.1±16.8 26.6±20.5 23.3±20.3 33.3±24.3 26.1±21.5 0.0024
Discussion
In this study we investigated a panel of socio-demographic and clinical factors in a population affected by COPD, resident in Bologna. The overall study population consisted mostly of men, ex-smokers, not practicing any physical activity, obese or overweight. With regard to the depri-vation index, the majority of patients were deprived or very deprived, regardless of COPD
stage. Our findings are in line with previous literature’s results showing that smoking, aging,
Table 2. Clinical and anthropometric characteristics in COPD population.
COPD GOLD STAGE
Mild Moderate Severe Very severe Total P-value
BMI
Underweight 2 (4.6%) 0 (0.0) 3 (5.8%) 3 (4.7%) 8 (3.5%)
Normal 17 (38.6%) 16 (23.9%) 17 (32.7%) 25 (39.1%) 75 (33.0%)
Overweight 17 (38.6%) 32 (47.8%) 21 (40.4%) 22 (34.3%) 92 (40.5%)
Obese 8 (18.2%) 19 (28.3%) 11 (21.1%) 14 (21.9%) 52 (22.9%) 0.34
Waist circumference (cm) 96.4±12.5 101.6±12.3 101.0±14.6 100.1±15.0 100.0±13.7 0.39
Charlson index
No comorbidity 32 (72.7%) 33 (49.2%) 24 (46.2%) 20 (31.2%) 109 (48.0 &)
One comorbidity 3 (6.8%) 16 (23.9%) 9 (17.3%) 17 (26.6%) 45 (19.8%)
Two or more comorbidities 9 (20.5%) 18 (26.9%) 19 (36.5%) 27 (42.2%) 73 (32.2%) 0.0030
FeNO (ppb) 16.7±5.9 19.5±6.7 20.1±7.2 27.0±10.3 21.1±8.6 <0.001
PaO2 (mmHg) 79.7±8.9 73.8±10.0 69.9±10.1 71.1±14.8 73.1±12.2 <0.001
PaCO2 (mmHg) 38.3±4.1 40.4±5.6 41.8±6.9 49.7±10.5 43.0±8.7 <0.001
pH 7.44±0.03 7.43±0.03 7.44±0.08 7.42±0.04 7.43±0.05 0.048
FVC (L) 2.8±0.8 2.2±0.8 2.0±0.6 1.6±0.6 2.2±0.8 <0.001
FEV1 (L) 1.9±0.6 1.3±0.4 1.0±0.3 0.7±0.3 1.2±0.6 <0.001
FEV1/FVC (%) 67.6±6.6 59.9±11.1 51.9±12.9 45.5±11.8 55.6±13.6 <0.001
FVC (% of total) 102.9±19.5 81.3±14.5 69.6±16.3 57.1±17.8 76.0±23.2 <0.001
FEV1 (% of total) 87.8±13.5 61.4±7.5 44.8±9.6 32.8±12.2 54.7±22.3 <0.001
doi:10.1371/journal.pone.0135116.t002
Fig 1. Kaplan-Meier analyses show that there is a significant difference between survival curves by COPD stage.The very severe COPD group has a lower event-free probability than subjects in the other stages. The mild COPD group has the highest event-free probability.
gender, and socio-economic factors are well established risk factors for COPD development
[18]. Interestingly, taking into account the COPD GOLD stage, we observed a significant
asso-ciation between the fragility value, smoking status and the severity of the disease. Moreover we noted the highest percentage of patients with two or more comorbidities in patients suffering from very severe COPD. According to the literature, FeNO values are normal or mildly
Table 3. Cox proportional hazards model of COPD population.
Model 1 Model 2
Event HR unadjusted (95% CI) P-value HR adjusteda(95% CI) P-value HR adjustedb(95% CI) P-value
Age, mean±sd 76.33±8.48 1.02 (0.99–1.05) 0.25 1.00 (0.96–1.03) 0.80 1.00 (0.97–1.04) 0.88 Gender
Women 29 (40.9%) 1.00 1.00 1.00
Men 42 (59.2%) 1.19 (0.74–1.91) 0.48 1.33 (0.73–2.42) 0.35 1.27 (0.71–2.25) 0.42
BMI
Normal 22 (31.4%) 1.00 1.00 1.00
Underweight 3 (4.3%) 1.88 (0.56–6.31) 0.31 3.20 (0.73–14.11) 0.12 4.08 (1.01–16.54) 0.049 Overweight 29 (41.4%) 1.09 (0.62–1.89) 0.77 1.25 (0.66–2.36) 0.49 1.25 (0.67–2.34) 0.49 Obese 16 (22.9%) 1.01 (0.53–1.93) 0.96 0.87 (0.42–1.80) 0.71 0.87 (0.42–1.80) 0.70
Educational qualification
Middle school 16 (22.9%) 1.00 1.00 1.00
No qualification 6 (8.6%) 1.27 (0.50–3.24) 0.62 1.15 (0.40–3.32) 0.80 1.24 (0.46–3.39) 0.67 Primary school 31 (44.3%) 1.26 (0.69–2.31) 0.45 0.97 (0.50–1.88) 0.92 1.03 (0.53–2.03) 0.92 Diploma 10 (14.3%) 0.95 (0.43–2.09) 0.89 1.04 (0.44–2.45) 0.94 1.10 (0.48–2.51) 0.83 Degree 7 (10.0%) 1.26 (0.52–3.07) 0.61 1.41 (0.51–3.91) 0.51 1.32 (0.47–3.68) 0.60
Physical activity
No 56 81.2%) 1.00 1.00 1.00
Yes 13 (18.8%) 1.04 (0.56–1.91) 0.90 1.28 (0.62–2.62) 0.51 1.50 (0.73–3.07) 0.27
Smoking status
Never-smoker 13 (18.3%) 1.00 1.00 1.00
Smoker 8 (11.3%) 0.98 (0.40–2.36) 0.96 0.83 (0.28–2.41) 0.73 1.12 (0.39–3.23) 0.83 Ex-smoker 50 (70.4%) 1.48 (0.80–2.72) 0.21 0.94 (0.43–2.08) 0.89 1.39 (0.66–2.93) 0.39
Charlson index
No comorbidity 17 (24.3%) 1.00 1.00 1.00
One comorbidity 12 (17.1%) 1.76 (0.84–3.70) 0.13 1.27 (0.55–2.89) 0.58 1.74 (0.78–3.93) 0.18 Two or more comorbidities 41 (58.6%) 4.44 (2.52–7.82) <0.001 4.50 (2.39–8.49) <0.001 4.71 (2.52–8.83) <0.001 Deprivation index
Very rich 13 (19.1%) 1.00 1.00 1.00
Rich 5 (7.4%) 0.50 (0.18–1.40) 0.19 0.51 (0.14–1.84) 0.31 0.49 (0.15–1.63) 0.25
Medium 11 (16.2%) 0.83 (0.37–1.85) 0.65 1.02(0.35–2.95) 0.97 1.35 (0.51–3.54) 0.55 Deprived 11 (16.2%) 0.65 (0.29–1.46) 0.30 0.72 (0.27–1.93) 0.51 0.89 (0.35–2.25) 0.80 Very deprived 28 (41.2%) 1.06 (0.55–2.05) 0.86 0.98 (0.36–2.67) 0.97 1.28 (0.52–3.14) 0.59
COPD stage
Mild 4 (5.6%) 1.00 1.00
-Moderate 19 (26.8%) 3.21 (1.09–9.44) 0.034 3.50 (1.01–12.18) 0.049
-Severe 15 (21.1%) 3.22 (1.07–9.70) 0.038 2.87 (0.78–10.54) 0.11
-Very severe 33 (46.5%) 7.37 (2.61–20.82) <0.001 8.23 (2.35–28.85) 0.0010
-aHR adjusted for age, gender, BMI, educational qualification, physical activity, smoking status, Charlson index, deprivation index and COPD stage bHR adjusted for age, gender, BMI, educational qualification, physical activity, smoking status, Charlson index and deprivation index
increased in stable COPD [19] and measurement of FeNO represents a non-invasive marker that may be useful to detect exacerbations and inflammation reduction in small airway disease
[20]. In our study population FeNO values are associated with the severity of COPD. Given the
type of study, we cannot deduce the direction of the association: frail subjects evolve more rap-idly to very severe COPD stage but on reverse, COPD stage could increase the fragility of the patients.
Another objective of the present study was to identify predictors of acute events in terms of death or hospitalization in COPD patients. During the study period 71 patients had at last one acute event. Our findings indicate that subjects with very severe COPD or low FEV1 are at higher risk of death or hospitalization for respiratory causes compared to patients with mild COPD, confirming the validity of the spirometric test as prognostic factor. Our data confirm that patients classification according to the GOLD spirometric grading systems represents a
predictor of exacerbations, hospitalizations and death [21–22].
COPD often coexists with other diseases and the scientific literature highlights that they
may significantly impact on prognosis [1]. Our analyses confirms that the Charlson index is a
risk factor for acute events, strengthening its role in COPD diagnosis and prognosis of poor outcomes. In addition, some studies highlighted a role of low BMI as an important risk factor for acute events, in particular showing that underweight and low skeletal muscle mass are
sig-nificant determinants of mortality in COPD [23–27]. Our multivariate analysis provides results
in line with the literature suggesting that recording of weight should be part of the follow up of these patients. The heterogeneous distribution of underweight among patients with different characteristics (e.g. deprivation) and the sample size may explain the non significant results of BMI as a risk factor in the bivariate analyses.
Previous studies have examined the association between socio-economic status and COPD health outcomes but results are controversial, possibly due to the different accessibility to
health care [28–31]. Eisner et al. [17] found that socio-economic status represents a risk factor
for adverse COPD health outcomes; in contrast, in our study the deprivation index does not influence the incidence of acute events. Differences between the US and the Italian health care system could explain the different results between the two studies. In particular, the access to the national health service guaranteed to the entire population might mitigate the effect of deprivation.
Our study measured only respiratory-associated events. Deaths in individuals with COPD are frequently attributed to a cause other than respiratory such as cardiovascular disease or
other causes [18]. Our results are therefore not directly generalizable to events for other
causes. Indeed, this could represent a limitation of our study, however the main aim has been to assess the efficacy of a panel of life-style and clinical factors as predictors of acute events, including mortality and/or hospitalization, for respiratory causes. Another limitation is the small sample size, consequently we cannot exclude that predictors investigated in the present study might result significantly associated with the outcomes under investigation in larger studies.
Supporting Information
S1 Database. (XLS)
S1 Table. Cox proportional hazards model of COPD population. (DOC)
Acknowledgments
The study has been supported byFondazione del Monte di Bologna e RavennaandFondazione
CARISBO,Bologna. The funders had no role in study design, data collection and analysis, or preparation of the manuscript.
Author Contributions
Conceived and designed the experiments: PP AZ SA FM SH CA PH. Performed the experi-ments: AZ LP. Analyzed the data: MAM ES CZ. Contributed reagents/materials/analysis tools: AZ LP CA CZ. Wrote the paper: PP MAM ES LP SA FM SH PH.
References
1. Roisin RR, Anzueto A, Bourbeau J, deGuia TS, Hui DSC, Martinez F et al. Global Strategy for the Diag-nosis, Management and Prevention of COPD, Global Initiative for Chronic Obstructive Lung Disease (GOLD) 2010.
2. Mathers CD, Loncar D. Projections of global mortality and burden of disease from 2002 to 2030. PLoS Med 2006; 3:e442. PMID:17132052
3. Scognamiglio A, Matteelli G, Pistelli F, Baldacci S, Carrozzi L, Viegi G. L’epidemiologia della broncop-neumopatia cronica ostruttiva. Ann Ist Super Sanità2003; 39(4):467–484. PMID:15098569 4. Ferrer M, Alonso J, Morera J, Marrades RM, Khalaf A, Aguar MC et al. Chronic obstructive pulmonary
disease stage and health-related quality of life. Ann Intern Med 1997; 127:1072–9. PMID:9412309 5. Jones PW. Health status measurement in chronic obstructive pulmonary disease. Thorax 2001;
56:880–7. PMID:11641515
6. Nishimura K, Izumi T, Tsukino M, Oga T. Dyspnea is a better predictor of 5-year survival than airway obstruction in patients with COPD. Chest 2002; 121:1434–40. PMID:12006425
7. Soler-Cataluña JJ, Martínez-García MA, Román Sánchez P, Salcedo E, Navarro M, Ochando R.
Severe acute exacerbations and mortality in patients with chronic obstructive pulmonary disease. Tho-rax 2005; 60(11):925–31. PMID:16055622
8. Mannino DM, Thorn D, Swensen A, Holguin F. Prevalence and outcomes of diabetes, hypertension and cardiovascular disease in COPD. Eur Respir J 2008; 32:962–9. doi:10.1183/09031936.00012408
PMID:18579551
9. Landbo C, Prescott E, Lange P, Vestbo J, Almdal TP. Prognostic Value of Nutritional Status in Chronic Obstructive Pulmonary Disease. Am J Respir Crit Care Med 1999; 160:1856–61. PMID:10588597 10. Eisner MD, Anthonisen N, Coultas D, Kuenzli N, Perez-Padilla R, Postma D et al. Committee on
Non-smoking COPD, Environmental and Occupational Health Assembly. An Official American Thoracic Society Public Policy Statement: Novel Risk Factors and the Global Burden of Chronic Obstructive Pul-monary Disease. Am J Respir Crit Care Med 2010; 182:693–718. doi:10.1164/rccm.200811-1757ST
PMID:20802169
11. Celli BR. Predictors of mortality in COPD. Respir Med 2010; 104(6):773–9. doi:10.1016/j.rmed.2009. 12.017
12. Dijk WD, Bemt L, Haak-Rongen S, Bischoff E, Weel CV, Veen JC et al. Multidimensional prognostic indices for use in COPD patient care. A systematic review. Respir Res 2011; 2:151. doi:10.1186/ 1465-9921-12-151
14. Wennberg D, Siegel M, Darin B, Filipova N, Russell R, Kenney L et al. Combined predictive model. Final report & technical documentation. Cambridge, UK: HealthDialog UK Limited, King’s Fund, New York University 2006.
15. Charlson ME, Pompei P, Ales KL, MacKenzie CR. A new method of classifying prognostic comorbidity in longitudinal studies: development and validation. J Chronic Dis 1987; 40:373–83. PMID:3558716 16. Dweik RA, Boggs PB, Erzurum SC, Irvin CG, Leight MW, Lundberg JO et al. An official ATS clinical
practice guideline: interpretation of exhaled nitric oxide levels (FENO) for clinical applications. Am J Respir Crit Care Med 2011; 184:602–615. doi:10.1164/rccm.9120-11STPMID:21885636
17. Eisner MD, Blanc PD, Omachi TA, Yelin EH, Sidney S, Katz PP et al. Socioeconomic status, race and COPD health outcomes. J Epidemiol Community Health 2011; 65(1):26–34. doi:10.1136/jech.2009. 089722
18. Mannino DM, Buist AS. Global burden of COPD: risk factors, prevalence, and future trends. Lancet 2007; 370(9589):765–73. PMID:17765526
19. Taylor DR, Pijnenburg MW, Smith AD, Jongste JCD. Exhaled nitric oxide measurements: clinical appli-cation and interpretation. Thorax 2006; 61:817e27.
20. Papi A, Romagnoli M, Baraldo S, Braccioni F, Guzzinati I, Saetta M, et al. Partial reversibility of airflow limitation and increased exhaled NO and sputum eosinophilia in chronic obstructive pulmonary dis-ease. Am J Respir Crit Care Med 2000; 162(5):1773–1777. PMID:11069811
21. Revill SM, Morgan MD, Singh SJ, Williams J, Hardman AE. The endurance shuttle walk: a new field test for the assessment of endurance capacity inchronic obstructive pulmonary disease. Thorax 1999; 54(3):213–22. PMID:10325896
22. Agusti A, Calverlev PM, Celli B, COxson HO, Edwards LD, Lomas DA et al. Characterisation of COPD heterogeneity in the ECLIPSE cohort. Respir Res 2010; 11:122.PMID:20831787
23. Schols AM, Broekhuizen R, Weling-Scheepers CA, Wouters EF. Body composition and mortality in chronic obstructive pulmonary disease. Am J Clin Nutr 2005; 82(1):53–9. PMID:16002800
24. Vestbo J, Prescott E, Almdal T, Dahl M, Nordestgaard BG, Andersen T et al. Body mass, fat-free body mass, and prognosis in patients with chronic obstructive pulmonary disease from a random population sample: findings from the Copenhagen City Heart Study. Am J Respir Crit Care Med 2006; 173 (1):79–83. PMID:16368793
25. Rutten E, Calverley P, Casaburi R, Agusti A, Bakke P, Celli B et al. Changes in Body Composition in Patients with Chronic Obstructive Pulmonary Disease: Do They Influence Patient-Related Outcomes?. Ann Nutr MEtab 2013; 63:239–247 doi:10.1159/000353211PMID:24216978
26. Zhou Y, Wang D, Liu S, Lu J, Zheng J, Zhong N et al. The association between BMI and COPD: the results of two population-based studies in Guangzhou, China. COPD 2013; 10(5):567–72. doi:10. 3109/15412555.2013.781579. Epub 2013 Jul 11.
27. Cazzola M, Calzetta L, Lauro D, Bettoncelli G, Cricelli C, Di Daniele N et al. Asthma and COPD in an Italian adult population: role of BMI considering the smoking habit. Respir Med 2013; 107(9):1417–22. doi:10.1016/j.rmed.2013.04.021PMID:23702090
28. Ketelaars CA, Schlösser MA, Mostert R, Huyer Abu-Saad H, Halfens RJ, Wouters EF. Determinants of health-related quality of life in patients with chronic obstructive pulmonary disease. Thorax 1996; 51:39–43. doi:10.1136/thx.51.1.39PMID:8658367
29. Afessa B, Morales IJ, Scanlon PD, Peters SG. Prognostic factors, clinical course, and hospital outcome of patients with chronic obstructive pulmonary disease admitted to an intensive care unit for acute respi-ratory failure. Crit Care med 2002; 30(7):1610–5. PMID:12130987
30. Prescott E, Godtfredsen N, Vestbo J, Osler M. Social position and mortality from respiratory diseases in males and females. Eur Respir J 2003; 21(5):821–6. PMID:12765428