Association between inadequate body composition and
sociodemographic factors in adolescents
Composição corporal inadequada em adolescentes: associação com fatores sociodemográicos
Composición corporal inadecuada en adolescentes: asociación con factores sociodemográficos
Giseli Minatto1, Andreia Pelegrini2, Diego Augusto S. Silva3, Adelson Fernandes da Silva4, Edio Luiz Petroski5
Instituição: Universidade Federal de Santa Catarina (UFSC), Florianópolis, SC, Brasil
1Mestranda em Educação Física pela UFSC; Núcleo de Pesquisa em Cin-eantropometria e Desempenho Humano, Florianópolis, SC, Brasil 2Doutora em Educação Física pela UFSC; Docente da UFSC, Florianópolis, SC, Brasil
3Mestre em Educação Física pela UFSC; Núcleo de Pesquisa em Cineant-ropometria e Desempenho Humano, Florianópolis, SC, Brasil
4Mestre em Educação Física pela Universidade de Trás-os-Montes e Alto Douro, Vila Real, Portugal; Docente da Universidade Estadual de Montes Claros, Januária, MG, Brasil
5Pós-Doutor pela Universidade de Montreal, Canadá; Professor Titular do Departamento de Educação Física da UFSC, Florianópolis, SC, Brasil
ABSTRACT
Objective: To evaluate the association between inad-equate body composition and sociodemographic factors in adolescents.
Methods: A cross-sectional study was conducted on 627 ado-lescent boys and girls aged 14 to 17 years old from a town with a low/medium human development index. Sociodemographic (gender, age, socioeconomic level, and area of residence) and anthropometric data (body weight, height, waist circumference, and thickness of ive skinfolds) were collected. The Canadian Physical Activity, Fitness and Lifestyle Appraisal was applied to analyze inadequate body composition.
Results: The prevalence of inadequate body composition was 24.1%. Inadequate indices of adiposity were more preva-lent among adolescent males (PR 3.16; 95%CI 1.72-5.82) from high/medium socioeconomic strata (PR 2.44; 95%CI 1.55-3.85), whereas the age of 14-15 years old was a protective factor against inadequate body composition (PR 0.58; 95%CI 0.37-0.90) compared to older ages (16-17 years old).
Conclusions: Inadequate body composition was associ-ated with gender, age and socioeconomic level. Interventions should consider the sociodemographic characteristics of the target population.
Key-words: anthropometry; nutritional status; social class.
RESUMO
Objetivo: Veriicar a associação da composição cor-poral inadequada com fatores sociodemográficos em adolescentes.
Métodos: Estudo transversal realizado em 627 adolescen-tes, com idades de 14 a 17 anos, de ambos os sexos, de uma cidade de Índice de Desenvolvimento Humano (IDH) médio/ baixo. Foram coletadas informações sociodemográicas (sexo, idade, nível econômico e área de domicílio) e antropométricas (peso corporal, estatura, perímetro da cintura e espessura de cinco dobras cutâneas). Para análise da composição corporal inadequada, utilizou-se a proposta do Plano Canadense de Atividade Física, Aptidão e Estilo de vida.
Resultados: A prevalência de composição corporal inadequada foi de 24,1%. Adolescentes do sexo masculino (RP 3,16; IC95% 1,72-5,82) e dos estratos econômicos alto e intermediário (RP 2,44; IC95% 1,55-3,85) tiveram maior prevalência de índices inadequados de adiposidade, enquanto a faixa etária de 14-15 anos representou fator de proteção para composição corporal inadequada (RP 0,58; IC95% 0,37-0,90), comparada à faixa de 16-17 anos.
Conclusões: A composição corporal inadequada esteve associada ao sexo, à idade e ao nível econômico. Intervenções devem levar em consideração as diferenças em função das características sociodemográicas.
Endereço para correspondência: Edio Luiz Petroski
Universidade Federal de Santa Catarina.
Campus Universitário –Trindade – Caixa Postal 476. CEP 88040-900 – Florianópolis/SC
E-mail: [email protected]
Conflito de interesse: nada a declarar
Fonte financiadora: Coordenação de Aperfeiçoamento Pessoal de Nível Superior (Capes) - bolsas outorgadas
Palavras-chave: antropometria; estado nutricional; classe social.
RESUMEN
Objetivo: Verificar la asociación de la composición corporal inadecuada con factores sociodemográficos en adolescentes.
Métodos: Estudio transversal realizado en 627 adolescen-tes, con edades entre 14 y 17 años, de ambos sexos, de una ciudad de Índice de Desarrollo Humano (IDH) mediano/ bajo. Se recogieron informaciones sociodemográficas (sexo, edad, nivel económico y área de domicilio) y antropométricas (peso corporal, estatura, perímetro de la cintura, espesor de cinco pliegues cutáneos). Para análisis de la composición cor-poral inadecuada, se utilizó la propuesta del Plan Canadiense de Actividad Física, Aptitud y Estilo de Vida.
Resultados: La prevalencia de composición corporal inadecuada fue de 24,1%. Adolescentes del sexo mascu-lino (RP 3,16; IC95% 1,72-5,82) y de los niveles econó-micos alto e intermediario (RP 2,44; IC95% 1,55-3,85) tuvieron mayores prevalencias de índices inadecuados de adiposidad, mientras que la edad de 14-15 años presentó factor de protección para composición corporal inadecuada (RP 0,58; IC95% 0,37-0,90), comparada a la franja de edad de 16-17 años.
Conclusiones: La composición corporal inadecuada estuvo asociada al sexo, la edad y al nivel económico. Intervenciones deben tener en cuenta las diferencias en función de las ca-racterísticas sociodemográficas.
Palabras clave: antropometría; estado nutricional; nivel socioeconómico.
Introduction
World Health Organization data show that signiicant changes in body composition are being observed in many dif-ferent countries(1). Studies(2-4) have been drawing attention to
increases in the prevalence rates of inadequate body fat levels among children and adolescents from all social strata.
Brazil is currently in a process of nutritional transition that is characterized by a reduction in nutritional deicits accompanied by increasing rates of elevated adiposity levels, not only among adults, but also in children and
adolescents(5). This transition can be observed in
popula-tions resident in urban and rural areas and from higher and lower economic strata(4).
As children become adolescents, a gradual increase in fat mass is observed. Excess body fat that is acquired during
adolescence tends to be maintained in adulthood(6) and is
associated with cardiovascular risk factors such as arterial
hypertension, dyslipidemia and insulin resistance(7,8).
Dis-eases that emerge because of these high levels of adiposity may be exacerbated further, depending on a person’s lifestyle and on the intensity of their weight gain(9).
There is evidence that the prevalence of unhealthy body composition is increasing, particularly at the start of adoles-cence and among people from higher economic strata(2,10,11). In
representative samples of schoolchildren (7 to 18 years), it is observed that 15-to-18-year-old students have higher rates of unhealthy body composition than their 7-to-10-year-old peers. A cross-sectional study conducted by Tassitano et al(12) analyzed
associations between demographic, socioeconomic, academic and behavioral factors and the prevalence rates of unhealthy body composition among adolescents (15 to 19 years). They observed greater proportions of unhealthy composition among male adolescents and among adolescents from urban areas.
Farias Junior and Silva(3) found evidence that there is a
greater probability of unhealthy body composition among boys from higher economic classes. These indings were ob-served in a study that assessed unhealthy body composition using body mass index (BMI) and investigated its associa-tions with demographic and socioeconomic factors among adolescents (15 to 18 years).
Although many researchers have collected information related to the behavior of body composition indicators in Brazilian schoolchildren, the majority of published data are restricted to analyses of adolescents’ body composition that had been measured in terms of BMI. It is therefore neces-sary to investigate body composition using a selection of additional anthropometric indicators, in order to determine the proportion of adolescents who have unhealthy body fat levels.
The objective of this study was therefore to investigate associations between unhealthy body composition and socio-demographic factors (sex, age, economic level and location of residence) among adolescent schoolchildren, aged 14 to 17 and living in an area with a low/medium human develop-ment index (HDI).
Method
the cross-sectional study “Analysis of physical activity and health-related physical itness in rural and urban schoolchildren”,
which was approved by the Ethics Committee at the
Facul-dades Unidas do Norte de Minas (FUNORTE). The study was conducted in 2009 with a representative sample of adoles-cents from state-run public schools from the municipality
of Januária, MG, Brazil, which is in the Médio São Francisco
region. The municipality has 67,516 inhabitants (IBGE,
2000)(13) and its human development index is 0.699, which
classiies it as having a low/medium level of human
develop-ment (PNUD, 2000)(14).
The sampling process was stratiied by primary and sec-ondary public schools and the clusters were classes in those schools. For the irst stage, only schools that offered both primary and secondary education were selected since these were the largest schools in the region, where the largest quantity of students were concentrated. Once these schools had been identiied, participating schools were selected by lots, using a list provided by the schools themselves and containing the ages of their students. In the second stage, all adolescents aged 14 to 17 who were in class on the data collection day were invited to take part.
Several different sample size calculations were performed because this study is nested within a larger research proj-ect with many different health outcomes. For the analysis presented here, the sample size calculation was based on an unknown prevalence of outcome (50%), an acceptable error of ive percentage points, a 95% conidence level and a design effect of 1.5, and then 15% was added for possible losses and refusals. Considering that there were 4,495 schoolchildren in primary and secondary education in Januária, MG, the sample estimate was 611 adolescents. The characteristics of the sampling process, based on recruitment of all members of each cluster, meant that the inal sample comprised 627 students.
Fieldwork was conducted by professors and students from the Physical Education department who were trained to carry out the necessary procedures, in order to standardize data collection methods. Sociodemographic data were col-lected (sex, age, economic level and location of residence), plus anthropometric variables (body weight - W, height - H and waist circumference – WC) and indicators of body composition (skinfold thicknesses at the triceps - TR, biceps – BI, subscapular - SS, iliac crest - IC and medial calf – MC regions). Skinfolds were measured in mm us-ing Cescorf brand fat calipers, accurate to 0.1mm, and a skin pencil to mark the anatomic landmarks. Body weight
(kg) was measured on a balance accurate to 100 grams and height (m) was measured using a stadiometer accurate to 0.1cm. Waist circumference was measured using a lexible Sanny tape measure accurate to 0.1mm. Anthropometric variables and body composition indicators were all measured
using standardized procedures(15).
The prevalence of unhealthy body composition was esti-mated according to the Canadian Physical Activity, Fitness
and Lifestyle Appraisal(15). The Canadian protocol employs a
combination of body adiposity indicators: BMI, obtained by
dividing body weight by height squared (BMI = Wkg / Hm²),
WC, the sum of ive skinfolds [(∑5SF TR, BI, SS, SI and MC] and the sum of two skinfolds [(∑2SF), SS and SI]. The plan includes tables of normal values for each indicator (BMI, WC, ∑2SF and ∑5SF) that classify subjects as within or outside of the beneicial zone for their sex and age. Us-ing these normalized igures, each indicator (BMI, WC, ∑2SF and ∑5SF) was classiied as healthy or unhealthy, with healthy being reserved for those adolescents within the zone that is beneicial to health. Once this preliminary classiica-tion has been completed, there is another table which scores combinations of BMI, ∑5SF, WC and ∑2SF and on the basis of these scores body composition is classiied into one of ive categories: Excellent, Very Good, Good, Regular or Must Improve. For the purposes of this study, we classiied body composition as “Unhealthy” if an adolescent was classiied in one of the health-risk zones (Regular or Must Improve) and as “Healthy” if they were classiied in one of the health-risk free zones (Excellent, Very Good or Good). The method takes into account overall fat distribution (BMI and ∑5SF) and peripheral fat (WC and ∑2SF).
The economic level of participants was deined accord-ing to the system proposed by the Brazilian Association of
Market Research Companies (ABEP - Associação Brasileira de
Empresas de Pesquisa)(16). Their instrument estimates families’
purchasing power and classiies them as class A, B, C, D or E on the basis of the material assets they have accumulated, their living conditions, the number of domestic workers they employ and the educational level of the head of the family. Since the present study investigated a small number of people, categories A and B were collapsed together and deined as “high” and D and E were combined as “low” with class C deined as “intermediate”. Adolescents’ parents’ edu-cational level was deined as the number of complete years the head of the family (father/mother) had spent in education
and was categorized as follows: ≤4 years, 5-8 years, 9-11
The descriptive analysis of variables was in terms of means, standard deviations and frequency distributions. Differences between means and proportions of variables were analyzed
using Student’s t test for independent samples and the
chi-square test, respectively. Where it was found that the dependent variable (unhealthy body composition) exhibited elevated prevalence, Poisson regression with robust vari-ance adjustment was used in order to examine associations between the outcome and sociodemographic indicators (sex, age, economic level and location of residence), estimating prevalence ratios and conidence intervals. All variables were included in the regression model. The signiicance level was set at 5% (95%CI).
Results
All of the students agreed to take part in the research and correctly illed out the economic and demographic question-naire, irrespective of location of residence. Two hundred and ninety-nine of the 627 adolescents studied (47.7%) lived in the urban area, while 328 (52.3%) lived in the rural part of the municipality of Januária, MG. Table 1 contains the general characteristics of the sample. Differences between the sexes were detected in body weight, height, ∑2SF, ∑5SF and WC, with males having greater body weight, height and waist circumference and females having greater BMI, ∑2SF and ∑5SF.
Table 2 shows the proportions of healthy and unhealthy body composition broken down by the sociodemographic variables (sex, age, economic level and location of resi-dence). Associations were detected between unhealthy body composition and sex and economic level. The results showed that there was a higher proportion of unhealthy body composition among males (32.3%) than among females (18.0%) and in the high economic category (31.8%) compared with both intermediate (27.8%) and low (16%).
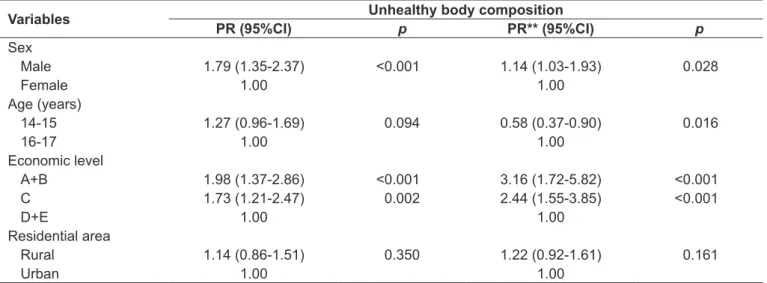
Table 3 lists the prevalence ratios for the associations between unhealthy body composition and sociodemo-graphic factors. The crude analysis detected an association between outcome and both sex and economic level. When the model was adjusted for all variables, there were asso-ciations between the outcome and sex, age and economic level. In this analysis, males had a 14% greater likelihood of unhealthy body composition than females. Further-more, adolescents in the high (PR 3.16; 95%CI 1.72-5.82) and intermediate (PR 2.44; 95%CI 1.55-3.85) economic
categories had a greater likelihood of having unhealthy body composition indicators when compared with the low category. Additionally, the age group of 14-15 years was a protective factor against unhealthy body fat levels.
Discussion
The results reported here show that, out of every 100 schoolchildren investigated, a third of the male adolescents from Januária, MG, which is a municipality with a medium/ low HDI, had unhealthy body composition, whereas this
Table 1 - Means and standard deviations for anthropometric variables and body composition indicators by sex, Januária, MG, Brazil (2009)
Variables Male
(n=266)
Female (n=361)
Chronological age (years) 15.4±1.1 15.6±1.1 Body weight (kg)* 55.9±10.7 51.6±7.5 Height (cm)* 168.1±0.9 160.4±0.1 BMI (kg/m2) 19.7±2.8 20.1±2.6
∑2SF (mm)* 16.5±9.1 25.0±9.6
∑5SF (mm)* 37.0±16.6 59.6±18.6
WC (cm)* 68.3±6.8 65.7±6.0
∑2SF: sum of 2 skinfolds (subscapular and iliac crest ); ∑5SF: sum of 5 skinfolds (triceps, biceps, subscapular, iliac crest and medial calf); WC: waist circumference. *p<0.05 for difference between the sexes (t test for independent samples).
Table 2 - Absolute (n) and relative (%) frequencies of body composition categories, broken down by sociodemographic variables, Januária, MG, Brazil (2009)
Variables
Body composition Healthy Unhealthy
n % n (%)
Sex
Male 180 67.7 86 32.3*
Female 296 82.0 65 18.0
Age (years)
14-15 240 73.2 88 26.8
16-17 236 78.9 63 21.1
Economic level
A+B 105 68.2 49 31.8*
C 161 72.2 62 27.8
D+E 210 84.0 40 16.0
Residential area
Rural 244 74.4 151 25.6
Urban 232 77.6 67 22.4
proportion reduced to almost a ifth for the females. Further-more, schoolchildren from better-off economic classes were more exposed to unhealthy body composition than those from less privileged strata. According to Farias Junior and
Silva(3), better economic conditions allow adolescents to be
more exposed to electronic equipment and fast food chains, which are considered socially acceptable behaviors and status symbols in this population subset.
Male adolescents have a higher proportion of unhealthy body composition indicators. The same has also been ob-served among adolescents in other regions of Brazil which have a similar or higher HDI to Januária, MG. For example,
among 10-to-19-year-olds from the city of Pelotas, RS(10),
and among schoolchildren (14 to 18 years) at both public and private schools in João Pessoa, PB(3), and at public
schools in Pernambuco(12) and among schoolchildren (11 to
17 years) at private schools in Presidente Prudente – SP(17).
Of these, the HDI for Rio Grande do Sul (RS) and São Paulo are higher (medium/high) than the HDI for Januária, MG. With reference to international research, these results are
also in agreement with studies of European(18) and
North-American(19) adolescents.
The greater prevalence of unhealthy body composition among male adolescents may be associated with a lesser de-gree of concern about controlling body weight and greater social acceptability of excess body fat(3). In Brazil, there is no
clear tendency with relation to the association between un-healthy fat levels and sex. Evidence indicates that unun-healthy
levels are more prevalent among males(3,10,12,17), but this varies
depending on location of residence, on whether schooling is public or private and on economic level.
Unhealthy body composition was also associated with age. Adolescents aged 16-17 had a greater probability of unhealthy body composition than younger adolescents. The results of the population study conducted with adolescents (15-18 years) from the city of Pelotas, RS(10), did not detect an association between
unhealthy body composition and age, but there was a tendency for higher percentages among younger adolescents (15 and 16 years) than among older ones (17 and 18 years)(10).
In the study conducted with adolescents (14 to 18 years) from João Pessoa, PB(3), age was not associated with
un-healthy adiposity even after adjustment for other variables (economic class and educational level). It should be pointed out that the criteria for body composition cutoff points used in this study are not comparable with those used in the other studies mentioned(3,10,12,17).
In addition to the different criteria used to classify un-healthy body composition, differences between indings may also be explicable by factors related to inadequate body com-position indicators that were not investigated in this study, such as physical activity level(10,20), exposure to sedentary
behaviors(10,21), eating patterns(5,21), obesity in the family(5),
geographic region(22) and whether or not adolescents took
part in Physical Education lessons(10).
In the present study, it was found that adolescents in the high economic level category (31.8%) and in
Table 3 - Associations between unhealthy body composition and sociodemographic variables, according to prevalence ratios and
95% conidence intervals. Januária, MG, Brazil (2009)
Variables Unhealthy body composition
PR (95%CI) p PR** (95%CI) p
Sex
Male 1.79 (1.35-2.37) <0.001 1.14 (1.03-1.93) 0.028
Female 1.00 1.00
Age (years)
14-15 1.27 (0.96-1.69) 0.094 0.58 (0.37-0.90) 0.016
16-17 1.00 1.00
Economic level
A+B 1.98 (1.37-2.86) <0.001 3.16 (1.72-5.82) <0.001 C 1.73 (1.21-2.47) 0.002 2.44 (1.55-3.85) <0.001
D+E 1.00 1.00
Residential area
Rural 1.14 (0.86-1.51) 0.350 1.22 (0.92-1.61) 0.161
Urban 1.00 1.00
the intermediate category (27.8%) exhibited a greater prevalence of unhealthy body composition than adoles-cents in the low economic level category (16%). This relationship has also been observed in other towns in Brazil(2,10,11) and in the state of Morelos, in Mexico’s
central region(23), using the same economic level
catego-ries (high, intermediate and low) adopted in this study, although they were defined using a different instru-ment. Furthermore, the studies cited above used only one indicator of body composition (BMI) to determine unhealthy body fat levels.
The results of this study diverge from results of studies of adolescents in developed countries. Such studies have reported an inverse relationship between unhealthy body composition and economic level among adolescents of both
sexes(18). In other words, the lower the economic level, the
greater the proportion of adolescents with unsatisfactory body fat levels. These differences between results may be caused by methodological differences (criteria used to classify body composition or indicators of socioeconomic conditions). A country’s economic development level appears to have a great effect on both the direction and magnitude of associations between body composition and
sociodemographic indicators(24).
These results are also evidence that unhealthy body composition indicators can be observed among all eco-nomic classes, demonstrating that developing countries like Brazil are going through a process known as “nu-tritional transition”. This process is characterized by an inversion in the pattern of distribution of nutritional problems in a given population over time, which, in general, means a transition from malnutrition to
over-weight, in its presentations as overweight and obesity(25).
This evidence conirms the simultaneous predominance of unhealthy body composition among societies with greater spending power.
The increase in unhealthy body composition among chil-dren and adolescents, which has been reported by studies conducted in many different parts of the country(26,27), is an
important warning for health authorities. Body fat levels above or below normal values are associated with the emer-gence of many different diseases, such as heart disease(28). This
evidence indicates a need for intervention at schools and in public health as a method of minimizing the consequences of unhealthy body composition.
This study did not ind any association between location of residence and outcome. There is evidence to suggest
that adolescents who live in urban areas are at greater risk of unhealthy body composition than those living in rural areas(29).
Since this was a cross-sectional study, there is no pos-sibility of establishing a causal relationship between sociodemographic variables and unhealthy body composi-tion. Another limitation is the lack of other studies that have used the same criteria to determine unhealthy body composition in adolescents, making it impossible to make uniform comparisons with other research results. Further-more, this study is limited to the population of adolescents enrolled at public schools in an area with a medium/low HDI and cannot be extrapolated to schoolchildren at pri-vate schools.
The importance of using the criteria chosen as indicators of the body adiposity of adolescents in this study is justiied by the fact that this method takes four speciic indicators into account. These indicators assess the distribution of body fat in general (BMI and ∑5SF), central body fat (WC) and peripheral body fat (∑2SF). Furthermore, the method includes indicators of cardiovascular risk(30) and of nutritional
status (BMI) and takes the adolescents’ age group and sex into account.
Changes to behavior and lifestyle must be initiated as soon as possible, since important changes take place to people’s personalities during adolescence and this is therefore an op-portune moment to adopt healthy habits. Schools, as places where children and adolescents spend a good proportion of their day, are considered to be environments particularly suited to preventative guidance about weight gain and en-ergy intake and expenditure aimed to encourage the adoption of healthy habits that should remain beyond their time at school at last their entire lives.
Considering the results of this study, it can be concluded that unhealthy body composition was associated with sex, age and economic level. Male adolescents and adolescents from the higher and intermediate economic strata had a greater likelihood of exhibiting unhealthy body fat indica-tors. In contrast, the age group 14-15 years was at lower risk of unhealthy body fat levels when compared with older age groups.
Acknowledgements
References
1. World Health Organization. The challenge of obesity in the WHO European Region and the strategies for response: summary. Denmark: WHO Regional Ofice for Europe; 2007.
2. Guedes DP, Paula IG, Guedes JE, Stanganelli LC. Prevalência de sobrepeso e obesidade em crianças e adolescentes: estimativas relacionadas ao sexo, à idade e à classe socioeconômica. Rev Bras Educ Fis Esp 2006;20:151-63. 3. Farias Jr JC, Silva KS. Overweight/obesity in adolescent students from the
city of João Pessoa, PB, Brazil: prevalence and association with demographic and socioeconomic factors. Rev Bras Med Esporte 2008;14:104-8. 4. Netto-Oliveira ER, Oliveira AA, Nakashima AT, Rosaneli CF, Oliveira-Filho
A, Rechenchoski L et al. Overweight and obesity in children of different socioeconomic levels. Rev Bras Cineantropom Desempenho Hum 2010;12:83-9.
5. Fagundes AL, Ribeiro DC, Naspitz L, Garbelini LE, Vieira JK, Silva AP et al. Prevalence of overweight and obesity in school children of Parelheiros region in São Paulo city, Brazil. Rev Paul Pediatr 2008;26:212-7.
6. Reilly JJ. Tackling the obesity epidemic: new approaches. Arch Dis Child 2006;91:724-6.
7. da Veiga GV, da Cunha AS, Sichieri R. Trends in overweight among adolescents living in the poorest and richest regions of Brazil. Am J Public Health 2004;94:1544-8.
8. Duquia RP, Dumith Sde C, Reichert FF, Madruga SW, Duro LN, Menezes AM et al. Epidemiology of elevated triciptal and subscapular skinfolds in adolescents. Cad Saude Publica 2008;24:113-21.
9. Martins CE, Ribeiro RR, Barros Filho AA. Nutritional status of schoolchildren according to school geographical localization in the city of Sorocaba, São Paulo, Brazil. Rev Paul Pediatr 2010;28:55-62.
10. Terres NG, Pinheiro RT, Horta BL, Pinheiro KA, Horta LL. Prevalence and factors associated to overweight and obesity in adolescents. Rev Saude Publica 2006;40:627-33.
11. Vanzelli AS, Castro CT, Pinto MS, Passos SD. Prevalence of overweight and obesity among children of public schools in the city of Jundiaí, São Paulo, Brazil. Rev Paul Pediatr 2008;26:48-53.
12. Tassitano RM, Barros MV, Tenório MC, Bezerra J, Hallal PC. Prevalence of overweight and obesity and associated factors among public high school students in Pernambuco State, Brazil. Cad Saude Publica 2009; 25:2639-52.
13. Brasil - Instituto Brasileiro de Geograia e Estatística [homepage on the Internet]. Resultado dos dados preliminares do censo 2000 [cited 2008 Jan 26]. Available from: http://ibge.gov.br
14. Programa das Nações Unidas para o Desenvolvimento [homepage on the Internet]. Tabelas de ranking do IDH-M [cited 2009 Sep 15]. Available from: http://www.pnud.org.br/atlas/tabelas/index.php
15. Canadian Society for Exercise Physiology. The Canadian Physical Activity, Fitness and Lifestyle Appraisal: CSEP’s guide to health active living. 2ª ed. Ottawa: CSEP; 1998.
16. Associação Brasileira de Empresas de Pesquisa (ABEP). Critério de classiicação econômica Brasil, 2008. [cited 2008 Aug 26]. Available from: http://www.abep.org/novo/CMS/Utils/FileGenerate.ashx?id=13
17. Fernandes RA, Conterato I, Messias KP, Christofaro DG, de Oliveira AR, Freitas Júnior IF. Risk factors associated with overweight among adolescents from Western São Paulo state. Rev Esc Enferm USP 2009;43:767-72. 18. Celi F, Bini V, De Giorgi G, Molinari D, Faraoni F, Di Stefano G et al.
Epidemiology of overweight and obesity among school children and adolescents in three provinces of central Italy, 1993-2001: study of potential inluencing variables. Eur J Clin Nutr 2003;57:1045-51.
19. Grunbaum JA, Kann L, Kinchen S, Ross J, Hawkins J, Lowry R et al. Youth risk behavior surveillance --- United States, 2003. MMWR Surveill Summ 2004;53:1-96.
20. Magalhães VC, Azevedo G, Mendonça S. Prevalence of overweight and obesity and associated factors among adolescents in the Northeast and Southeast regions of Brazil, 1996 to 1997. Cad Saude Publica 2003; 19 (Suppl 1):S129-39.
21. Moraes SA, Beltrán Rosas J, Mondini L, Freitas IC. Prevalence of overweight and obesity, and associated factors in school children from urban area in Chilpancingo, Guerrero, Mexico, 2004. Cad Saude Publica 2006; 22:1289-301.
22. Pelegrini A, Petroski EL, Coqueiro Rda S, Gaya AC. Overweight and obesity in Brazilian schoolchildren aged 10 to 15 years: data from a Brazilian sports project. Arch Latinoam Nutr 2008;58:343-9.
23. Salazar-Martinez E, Allen B, Fernandez-Ortega C, Torres-Mejia G, Galal O, Lazcano-Ponce E. Overweight and obesity status among adolescents from Mexico and Egypt. Arch Med Res 2006;37:535-42.
24. Martorell R, Khan LK, Hughes ML, Grummer-Strawn LM. Obesity in Latin American women and children. J Nutr 1998;128:1464-73.
25. Silva DA, Pelegrini A, Petroski EL, Gaya AC. Comparison between the growth of Brazilian children and adolescents and the reference growth charts: data from a Brazilian project. J Pediatr (Rio J) 2010;86:115-20.
26. Albano RD, de Souza SB. Nutritional status of adolescents: “risk of overweight” and “overweight” in a public school in São Paulo. Cad Saude Publica 2001;17:941-7.
27. Balaban G, Silva GA. Overweight and obesity prevalence in children and adolescents from a private school in Recife. J Pediatr (Rio J) 2001; 77:96-100.
28. Sawaya AL. Desnutrição: conseqüências em longo prazo e efeitos da recuperação nutricional. Estud Av 2006;20:147-58.
29. Pelegrini A, Silva DA, Petroski EL, Glaner MF. Estado nutricional e fatores associados em escolares domiciliados na área rural e urbana. Rev Nutr 2010;23:839-46