http://dx.doi.org/10.1590/s2175-97902018000317552
Article
*Correspondence: H. Z. Huri. Department of Pharmacy, Faculty of Medicine, University of Malaya, 50603 Kuala Lumpur. Phone: 603 79676659 / Fax: 603 79541904. E-mail: hasnizazh@um.edu.my
Demographic, clinical and lifestyle predictors for severity of
erectile dysfunction and biomarkers level in Malaysian patients
Raymond Mark
1, Hasniza Zaman Huri
1,2*, Azad Hassan Abdul Razack
31Department of Pharmacy, Faculty of Medicine, University of Malaya, Kuala Lumpur, Malaysia, 2Clinical Investigation Centre, University Malaya Medical Centre, Lembah Pantai Kuala Lumpur, Malaysia, 3Departments of Surgery, Faculty of
Medicine, University of Malaya, Kuala Lumpur, Malaysia
The incidence of erectile dysfunction (ED) is rising worldwide and its prevalence is one of the main health
concerns that affect overall men well-being in Malaysia. The cluster of demographic, clinical and lifestyle factors may have contributed to the severity of ED and changes in biomarkers level; nevertheless these have not been studied extensively.This cross sectional study involved a total of 276 patients with 138 was diagnosed with ED. The demographic, clinical, lifestyle factors and severity of ED were assessed using a set of questionnaire and the International Index of Erectile Function (IIEF-5). Meanwhile, Total Testosterone (TT) and Asymmetric dimethylarginine (ADMA) levels were determined using the
enzyme-linked immunosorbant assay (ELISA). Binary logistic regression test was used to demonstrate the predictors of severity of ED, TT and ADMA levels. Significant predictors for worsening of severity of
ED are self-employed [10.55 (0.43 – 257.06), p=0.004], pensioner [8.07 (0.19 – 352.45), p=0.026], non-government employee [1.16 (0.05 – 26.26), p=0.04] and TT [0.41 (0.25 – 0.69), p=0.001]. Nevertheless, pensioner [0.08 (0.01 – 0.87), p=0.038] and unemployed [0.04 (0.01 – 0.42), p=0.007], were the predictors
that may influence the changes of TT levels. On the other hand, academic qualification (secondary)
[4.51 (0.48 – 42.83), p=0.014] and intensity of physical activities (< 1 hour/day) [2.61 (0.65 – 10.48),
p=0.008] were the predictors which were more likely to influence the changes of ADMA levels in ED patients. TT and ADMA levels were influenced by demographic and lifestyle factors whilst severity of ED was predicted by demographic and clinical factors in Malaysian ED population. These predictors may provide new knowledge on risk factors of severity of ED and help in management of ED. Thus, the predictive models could serve as a primary guidance to physicians to ensure ED being managed and treated more effectively.
Keywords: Erectile dysfunction/biomarker/clinical. Demography. Lifestyle. Men’s Health. Malaysia
INTRODUCTION
According to National Institutes of Health (NIH) consensus panel, erectile dysfunction (ED) is defined
as the inability of a man to obtain and/or maintain a penile erection that is sufficient for satisfactory sexual
performance (NIH Consensus Conference, 1993;
Shamloul, Ghanem, 2013). A recent study by Rahman showed that 69.5 % of Malaysians men with aged 40 to
79 years old reported had ED (Ab Rahman, Al-Sadat,
Yun Low, 2011). Since it is not life threatening, men give
less attention and left it untreated. Currently more than
150 million men worldwide are affected by this sexual disorder and this number could rise to 320 million by
2025 (Meller et al., 2013; Nunes, Labazi, Webb, 2012).
Erectile dysfunction which was previously known as impotence is common among men aged 40 and above
(Pastuszak, 2014). Few epidemiology studies reported that the prevalence of erectile dysfunction varies according to
age range, countries and ethnic groups. In Malaysia, Ab Rahman et al. (2011) and Fadzil et al. (2014) reported
69.5% and 62% of Malaysian aged 40 years and above
have ED respectively and the incidence varies among
the three main ethnic groups living in this country (Ab
Rahman, Al-Sadat, Yun Low, 2011; Fadzil et al., 2014). ED was considered as organic and psychogenic
origin. Increasing knowledge on erectile function
could play important roles in causing severe ED in an
individual. However, these factors have not been well
studied in Malaysian ED patients. The association of
demographic factors with severity of ED can be seen
with ethnicity (Momtaz et al., 2014; Tan et al., 2011) and
current marital status (Oyekanmi et al., 2012). Besides, the
socioeconomic states such as occupation or employment
status of an individual (Al Mogbel, 2014), academic
qualification (Momtaz et al., 2014) and household income
(Martin et al., 2014) have been found to have indirect
association with severity of ED (Ab Rahman, Al-Sadat,
Yun Low, 2011; Safarinejad, Hosseini, 2004). Apart
from these, clinical factors such as biomarkers and type of comorbidities have been hypothesized to be strongly associated with severity of ED. Evidences signified that TT and ADMA were found to be the most prominent biomarkers associated with severity of ED. Studies have
also shown that decreased levels of TT (Brooke et al.,
2014) and increased ADMA levels (Aktoz et al., 2010)
play a part in the expression of nitric oxide (NO) synthesis substantially leading to progression of severe ED. There are many convincing studies evidences that comorbidities such as type 2 diabetes mellitus (T2DM) (Tamler, 2009),
coronary artery disease (CAD) (Grossmann, Gianatti,
Zajac, 2010), hyperlipidaemia (Musicki et al., 2010;
Nikoobakht, Nasseh, Pourkasmaee, 2005), hypertension (Nunes, Labazi, Webb, 2012) and lower urinary tract
symptoms (LUTS)/ benign prostatic hyperplasia (BPH)
(Dutkiewicz et al., 2012) as risk factors of ED and have
been strongly associated with severity of ED. Practising good quality lifestyles are known to reduce the risk of
severe ED. Besides that, lack of physical activity (Kałka
et al., 2013) has been well documented and proven to be
associated with severity of ED (La Vignera et al., 2013). In
addition, studies have also shown that active and healthy
lifestyles without smoking (Cao et al., 2013) and alcohol
(Lee et al., 2010) significantly delay the progression of
severe ED.
A biological marker or biomarker is defined as biochemical alterations that are measurable in human cells or fluids and can be used as an indicator for a biological
process (Micheel, Nass, Omenn, 2012). Biomarkers
are used in clinical settings to determine the status of a disease and also as an indicator of treatment response (Strimbu, Tavel, 2010). Amongst biomarkers that have
been prominently associated with erectile dysfunction are ADMA, NO, advanced glycation end product (AGE), TT, oxytocin, interleukin 6, sphingosine-1-phosphate and more. Out of these, TT and ADMA which have an
essential role in mechanism of erection were selected for this study. TT activates and increases the synthesis of
cyclic guanosine monophosphate (cGMP) by stimulating endothelial nitric oxide synthase (eNOS) synthase and increasing the expression of NO. NO is a crucial enzymes
for erection. In addition, TT helps in the vasodilation of the penile arterioles around the corpora cavernosa and allows
more blood inflow to maintain an erection (Isidori et al.,
2014). Meanwhile, the role of ADMA as an endogenous
inhibitor of NO synthase decreases the bioavailability of NO, which eventually inhibits the relaxation of smooth
muscle in penile tissues and leads to ED (Javaroni, Neves, 2012). Recent study shows that elevated ADMA level in serum is strongly associated with high prevalence of ED (Aktoz et al., 2010), nevertheless ED is less prevalent in
patients with high serum concentration of TT (Brooke et
al., 2014). Studies have been conducted on association of
demographic, clinical and lifestyle factors with biomarker
levels (TT and ADMA), however the potential predictors
associated with these biomarkers levels in ED patients have yet to be identified, particularly in the Malaysian population.
There is scarcity of studies on severity of ED and
biomarkers level in the Malaysian ED population. Most of the available studies on association of demographic,
clinical and lifestyle factors with severity of ED and
biomarkers cannot be generalized to the Malaysian population. Besides, the demographic, clinical and lifestyle factors have been studied as individual factors and linked to severity of ED. Nevertheless, to the best knowledge of the authors, no Malaysian studies have investigated the impact of combination of these factors with severity of ED and biomarkers level. It is essential
to study these factors and their associations in order to
identify the risk factors which influence the severity of ED and biomarker levels. Therefore, the present study was
designed to assess the association of demographic, clinical
and lifestyle factors with severity of ED and biomarker
levels in Malaysian ED patients. This study also aimed
to determine the predominant predictors that influenced the severity of ED and biomarker levels in Malaysian ED
patients.
MATERIAL AND METHODS
Study design and setting
An unmatched case-control study was conducted in patients who attended ED, surgery, eye and medical clinics in a university hospital, University Malaya Medical Centre (UMMC) at Kuala Lumpur, Malaysia
UMMC (MEC reference number 1010.18). Sample size was calculated from the published guidelines for testing
individual predictors (VanVoorhis, Morgan, 2007). Based
on the study, regression sample size for testing individual predictors is determined using formula, N > 104 + m,
(where m is the number of predictors or independent variables). Convenience sampling was applied to select the subjects for this study (Huri et al., 2016). A random selection of patients from the non-ED pool was included in the study (controls). Patients aged 40 years old and
above (Pastuszak, 2014) who met the inclusion criteria
were approached and briefed about the purpose of this study. Those who fulfilled the inclusion-exclusion criteria were selected and patient information sheet (PIS) was
then given to them. Patients who voluntarily agreed to participate in this study were given a consent form to
acknowledge the agreement to participate in this study. A
face-to-face interview was conducted to complete a study questionnaire. An overview of the study methodology is illustrated in Figure 1.
Inclusion and Exclusion Criteria
a. Inclusion Criteria (case)
• Adult male patients ≥ 40 years old (Pastuszak,
2014)
• Patients who have IIEF-5 score ≤ 21 (Pastuszak,
2014)
b. Inclusion Criteria (control)
• Adult male patients ≥ 40 years old
• Patients who have IIEF-5 score > 21
c. Exclusion Criteria (case)
• Patients that are critically ill who required
medical treatment
• Patients who are unwilling to participate in the
survey
• Patients who are diagnosed with psychiatry
illness or mentally challenged.
• Patients who underwent surgical treatment for
ED
• P a t i en t s w h o a r e a d m i t te d a n d r e q u i r e d
intervention in hospital
• Patients who received non-pharmacological local
therapy (herbal medications)
• Patients who received hormone therapy for ED
(hypogonadism)
• Immunocompromised patients (HIV, AIDS and
cancer patients)
d. Exclusion Criteria (control)
• Patients that are critically ill requiring medical
treatment
• Patients who are unwilling to participate in the
survey
• Patients who are diagnosed with psychiatry
illness or mentally challenged.
• P a t i en t s w h o a r e a d m i t te d a n d r e q u i r e d
intervention in hospital
• Immunocompromised patients (HIV, AIDS and
cancer patients)
Questionnaire
Participants who gave their consent were provided with a study questionnaire which was adapted from few
previous studies (Ab Rahman, Al-Sadat, Yun Low, 2011;
Khoo, Tan, Low, 2008; Tan et al., 2007). The questionnaire
was divided into three parts. The first part (Part A) of the questionnaire assessed the socio-demographic characteristics such as age, ethnicity, marital status,
occupation, academic qualification and monthly income.
The second part of the questionnaire measured life style factors of patients which comprised of factors such as
physical activities (intensity and duration of physical
activities), smoking history (intensity and duration of smoking) and alcohol consumption. Part C analysed detailed medical history (history of comorbidities) and
sexual health (IIEF-5) of participants. The outline of the study questionnaire is as follow.
Part A: assessment of demographic factors
Socio-demographic characteristics were assessed in this first part of the questionnaire. Patient’s age was calculated using year of birth as stated in hospital
information system. Ethnic is classified into three
major populations of Malaysia; Malays, Chinese and
Indians. Marital status is categorized into married and others (never married or single, divorced, and widower).
Occupation is classified into 5 categories; government
employee, non-government employee, self-employed,
pensioner and unemployed. Respondents’ academic qualification is measured based on Malaysian education
system which includes no formal schooling, primary
education, secondary educations (PMR, SPM, STPM,
A-Level, certificate) and tertiary/higher educations
(Diploma, Bachelor degree and Postgraduate degree)
(Ab Rahman, Al-Sadat, Yun Low, 2011; Momtaz et al.,
2014). Meanwhile monthly income is defined as low (<
RM1000), medium (RM 1000 – RM 2999) and high (RM ≥ 3000) based on patients’ salary in Malaysian Ringgit (MYR) (Ab Rahman, Al-Sadat, Yun Low, 2011; Momtaz
et al., 2014).
Part B: assessment of life style factors
This part of questionnaire evaluates life style factors of patients including items on physical activity, cigarette
smoking history, and alcohol consumption. Physical
activity was assessed on how often patients involved
in activities which took hard physical efforts that made them breather harder than normal in the past 3 years.(Ab Rahman, Al-Sadat, Yun Low, 2011) Among the other
questions asked to assess physical activities are:
• Over the last 3 years, how often did you do physi -cal activities? For example heavy lifting, aerobic, carrying light loads, bicycling at a regular pace, or playing badminton.
• How many days per week were usually spent on
doing these physical activities?
• How much total time did you usually spend on doing
physical activities on one of those days?
The smoking history of patients was assessed. A patient was considered a smoker if he had smoked more
than one cigarette per day for at least one year; an ex-smoker if he had stopped smoking more than one year from the day of interview and a non-smoker if he had never smoked cigarette in his whole life (Chrysohoou et al.,
2013). Smokers were asked additional questions on how
many cigarettes they smoked per day and the number of years they have been smoking. Based on the questionnaire responses, the respondents’ status is classified as current smoker, non-smoker, and ex-smoker with varying intensity of smoking (number of cigarettes per day) and duration of smoking (years of smoking) (Gades et al., 2005).
Patients were evaluated based on consumption of drinks such as beer, wine, spirit, samsu, tuak, sake or others
which contain alcohol (Ab Rahman, Al-Sadat, Yun Low,
2011). Response categories ranged from no (never drank alcohol in his life) to alcoholic (with an average of daily
or weekly alcohol consumption) and ex-alcohol consumer (had stopped drinking alcohol more than one year from
the day of interview) (Ab Rahman, Al-Sadat, Yun Low,
2011; Bacon et al., 2006).
Part C: assessment of clinical factors and sexual health
Self-reported health conditions of patients on history of comorbidities were questioned in this questionnaire. The information on comorbidities was obtained from patients’ medical records. Meanwhile, the list of PDE-5 inhibitors prescribed for ED patients was obtained from Pharmacy Information System, UMMC using patients’ RN number. The severity of ED was measured using the
International Index of Erectile Function-5 (IIEF-5) which is a self-evaluation questionnaire used for the assessment of male sexual function including screening and diagnosis
of severity of ED (Pastuszak, 2014). Participants were
asked to rate their ability to achieve and maintain an
erection that is good enough for a satisfactory sexual intercourse without any treatment for the past 6 months.
Response options ranged from very low, low, moderate, high and very high. Among the questions asked were as
follow:
• How do you rate your confidence that you could get and keep an erection?
• When you had erections with sexual stimulation,
how often were your erections hard enough for penetration?
• During sexual intercourse, how often were you able
to maintain your erection after you had penetrated (entered) your partner?
• During sexual intercourse, how difficult was it to
• When you attempted sexual intercourse, how often
was it satisfactory for you?
Presence of ED is denoted by IIEF scores of equal or less than 21. Severity of ED is further categorised based
on the IIEF scores: severe (5-7), moderate (8-11), mild to moderate (12-16), mild (17-21), and no ED (22-25). For
analysis purposes, a binary variable was created based
on IIEF-5 where scores from 12-21 is considered “less severe (Mild to Mild/Moderate)” and 5–11 is considered as “moderate to severe” ED. The IIEF-5 assessments
were completed by consultant urologists in UMMC with
a specialisation in ED.
Blood sampling and biomarkers analysis
Ten (10.0) ml of blood samples were collected in two SST tubes (BD vacutainer) and were immediately
centrifuged at 4000 rpm for 15 min (Önder et al., 2014).
The supernatant (serum) was decanted into clean eppendorf
centrifuge tubes and kept frozen in the -20°c freezer (Remi scientific, Malaysia, model: DW-YL270) until analysis. ADMA and TT levels were determined by using a commercially available enzyme-linked immunosorbant assay (ELISA) kit according to manufacturers’ instructions (Uscn Life Science Inc, Wuhan, China). (Ali et al., 2012;
Griffeth, Carretero, Burks, 2013).
Statistical analysis
The data was analysed using Statistical Package for Social Sciences (SPSS) version 19.0 (IBM Corp. Released 2010, IBM SPSS Statistics for Windows, version 19.0. Armonk, NY: IBM Corp, USA). Descriptive statistics were used to summarize patients’ demographic, clinical and lifestyle characteristics. Discrete variables were expressed as frequencies and percentages (N, %). On the
other hand, continuous data was expressed as mean ± standard deviation. Chi-square test was used to analyse
discrete variables, meanwhile one-way ANOVA was used to compare the means of continuous variables. To build the predictor model, all variables that showed significant association with both primary analysis (case & control
group) and secondary analysis (severity of ED, TT and
ADMA) were subjected to a binary logistic regression test (enter method) to determine their odds ratio (OR) and confidence intervals. The dependent variable of predictor
models for severity of ED is categorised as scale 1: participants with IIEF scores of 12-21 and 2: participants with IIEF scores of 5–11. Plot receiver-operating
characteristic (ROC) curve was used to determine the cut-off point for biomarkers levels (TT and ADMA). The ROC
analysis indicated cut-off point of TT is 9.55 nmol/L. The dependent variable for this modelling is TT with scale 1: high serum concentration level of TT, ≥ 9.55 nmol/L and
2: low serum concentration level of TT < 9.55 nmol/L. Meanwhile, an ADMA cut-off point of 0.665µmol/L
yielded from ROC analysis. The dependent variable for
this modelling is ADMA with scale 1: high concentration
of serum ADMA, ≥ 0.665 µmol/L and 2: low concentration
of serum ADMA, < 0.665 µmol/L. Hosmer and Lemeshow test with p > 0.05 indicates that the entered data is
suitable with the tested model. Nagelkerke R square (R2)
value shows the percentage of predictor’s in influencing dependent variable. The ranking of predictors in the model were determined by the odds ratio (OR) values. Results with p < 0.05 were considered statistically significant.
RESULTS
Demographic, clinical and lifestyle characteristics of study population
A total of 337 patients were approached. Out of these, 42 respondents were excluded as they do not fulfil
the inclusion criteria while 19 respondents disagreed to participate in this study. As a result, 276 patients who met the inclusion-exclusion criteria has participated in this study whereas 138 patients were reported having ED (IIEF
scores ≤ 21) and categorised as the case group. The balance
138 patients who have IIEF > 21 were categorised as the control group. The association of demographic, clinical,
biomarkers and lifestyle factors with erectile dysfunction;
case and control (primary analysis) and ED severity
subgroup (secondary analysis) were presented in Table I.
Meanwhile, the association of demographic, clinical and
lifestyle factors with biomarkers level (TT and ADMA) were shown in Table II.
Predictors of severity of ED, TT and ADMA level
Variables which gave significant result in both case & control (primary analysis) and severity group (secondary analysis) were subjected to this binary logistics regression analysis. The significant predictors for severity
of ED in this study population were TT (p = 0.001) and
occupation (p = 0.03). Based on the OR value, self-employed was ranked as first predictor which was 10.55 times most likely to increase severity of ED followed by pensioner (OR = 8.07) and non-government employee (OR = 1.16). Meanwhile, TT levels were 0.41 times more likely
TABLE I - Association of Demographic, Clinical, Biomarkers and Lifestyle factors with Erectile Dysfunction and Severity of ED
Primary Analysis (Case and Control) Secondary Analysis (Cases only)
Case n=138 (%) /
Mean ± SD
Control n=138 (%) /
Mean ± SD
p Value
Mild to Mild/Moderate
n=105 (%) / Mean ± SD
Moderate to Severe n=33 (%) / Mean ± SD
p Value Demographic factors Age Ethnic Malay Chinese Indian
58.64 ± 9.23
68 (49.3) 39 (28.3) 31 (22.5)
54.80 ± 7.62
64 (46.4) 41 (29.7) 33 (23.9)
< 0.001d *
0.890a
54.99 ± 6.11
52 (49.5) 29 (27.6) 24 (22.9)
70.27 ± 7.76
16 (48.5) 10 (30.3) 7 (21.2)
< 0.001d *
0.951a
Marital Status Married
Others 133 (96.4) 5 (3.6)
138 (100) 0 (0.00)
0.06 b 105 (100.0) 0 (0.0)
28 (84.8) 5 (15.2)
0.001b *
Occupation Government Employee Non-government employee Self Employed Pensioner Unemployed 36 (26.1) 29 (21.0) 21 (15.2) 30 (21.7) 22 (15.9) 65 (47.1) 11 (8.0) 7 (5.1) 34 (24.6) 21 (15.2)
< 0.001a * 33 (31.4) 26 (24.8) 17 (16.2) 16 (15.2) 13 (12.4) 3 (9.1) 3 (9.1) 4 (12.1) 14 (42.4) 9 (27.3)
< 0.001b *
AcademicQualification Primary Secondary Tertiary 11 (8.0) 111 (80.4) 16 (11.6) 9 (6.5) 92 (66.7) 37 (26.8)
0.006 a * 4 (3.8) 88 (83.8) 13 (12.4)
7 (21.2) 23 (69.7)
3 (9.1)
0.006 b *
Monthly Household Income Low Medium High 30 (21.7) 65 (47.1) 43 (31.2) 30 (21.7) 24 (17.4) 84 (60.9)
< 0.001a ⃰ 13 (12.4) 51 (48.6) 41 (39.0)
17 (51.5) 14 (42.4) 2 (6.1)
< 0.001b ⃰
Clinical factors
Type 2 Diabetes Mellitus Present
Absent 70 (50.7) 68 (49.3)
73 (52.9) 65 (47.1)
0.810c 51 (48.6) 54 (51.4) 19 (57.6) 14 (42.4) 0.482c Hypertension Present
Absent 85 (61.6) 53 (38.4)
77 (55.8) 61 (44.2)
0.392c 66 (62.9) 39 (37.1) 19 (57.6) 14 (42.4) 0.735c Hyperlipidemia Present
Absent 65 (47.1) 73 (52.9)
56 (40.6) 82 (59.4)
0.332c 46 (43.8) 59 (56.2)
19 (57.6) 14 (42.4)
0.237c
Coronary Artery Disease Present
Absent
Lower Urinary Tract Symptoms/ Benign prostatic hyperplasia Present Absent 80 (58.0) 58 (42.0) 42 (30.4) 96 (69.6) 72 (52.2) 66 (47.8) 35 (25.4) 103 (74.6) 0.397c 0.421c 58 (55.2) 47 (44.8) 26 (24.8) 79 (75.2) 22 (66.7) 11 (33.3) 16 (48.5) 17 (51.5) 0.338c 0.076c Biomarkers
Total Testosterone (TT) (nmol/L) Asymmetric dimethylarginine (ADMA) (µmol/L)
11.58 ± 2.53 0.65 ± 0.16
20.94 ± 2.89 0.50 ± 0.08
< 0.001d * < 0.001d *
12.49 ± 1.96 0.61 ± 0.14
8.70 ± 1.95 0.80 ± 0.12
< 0.001d * < 0.001d *
Life style Factors
Physical activities Yes No 48 (34.8) 90 (65.2) 83 (60.1) 55 (39.9)
< 0.001c * 42 (40.0) 63 (60.0)
6 (18.2) 27 (81.8)
Primary Analysis (Case and Control) Secondary Analysis (Cases only)
Case n=138 (%) /
Mean ± SD
Control n=138 (%) /
Mean ± SD
p Value
Mild to Mild/Moderate
n=105 (%) / Mean ± SD
Moderate to Severe n=33 (%) / Mean ± SD
p Value
Life style Factors
Duration of physical activities No
≤ 2 days/week > 2 days/week
90 (65.2) 31 (22.5) 17 (12.3)
55 (39.9) 25 (18.1) 58 (42.0)
< 0.001a * 63 (60.0) 28 (26.7) 14 (13.3)
27 (81.8) 3 (9.1) 3 (9.1)
0.059 b
Intensity of physical activities No
< 1 Hour/day ≥ 1 Hour/day
90 (65.2) 15 (10.9) 33 (23.9)
55 (39.9) 41 (29.7) 42 (30.4)
< 0.001a * 63 (60.0) 11 (10.5) 31 (29.5)
27 (81.8) 4 (12.1)
2 (6.1)
0.022 b *
Smoking Yes No
81 (58.7) 57 (41.3)
57 (41.3) 81 (58.7)
0.006 c * 62 (59.0) 43 (41.0)
19 (57.6) 14 (42.4)
0.881 c
Duration of smoking No smoking 1 – 20 years 21 – 40 years > 40 years
57 (41.3) 8 (5.8) 42 (30.4) 31 (22.5)
81 (58.7) 29 (21.0) 18 (13.0) 10 (7.2)
< 0.001a * 43 (41.0) 4 (3.8) 37 (35.2) 21 (20.0)
14 (42.4) 4 (12.1) 5 (15.2) 10 (30.3)
0.057 b
Intensity of smoking No Smoking 1 – 2 Cigarette(s)/day 3 – 5 Cigarettes/day ≥ 6 Cigarettes/day
57 (41.3) 3 (2.2) 68 (49.3)
10 (7.2)
81 (58.7) 23 (16.7) 25 (18.1) 9 (6.5)
< 0.001b * 43 (41.0) 2 (1.9) 51 (48.6)
9 (8.6)
14 (42.4) 1 (3.0) 17 (51.5)
1 (3.0)
0.737 b
Alcohol consumption Yes
No
41 (29.7) 97 (70.3)
29 (21.0) 109 (79.0)
0.128 c 32 (30.5) 73 (69.5)
9 (27.3) 24 (72.7)
0.894 c
Nominal data are reported as number (percentage), meanwhile interval data are expressed as mean±SD. a Computed using Pearson Chi Square. b Computed using Fisher’s Exact Test. c Computed using Continuity Correction. d Computed using one way ANOVA test. *statistically significant
(p<0.05).
TABLE I - Association of Demographic, Clinical, Biomarkers and Lifestyle factors with Erectile Dysfunction and Severity of ED (cont.)
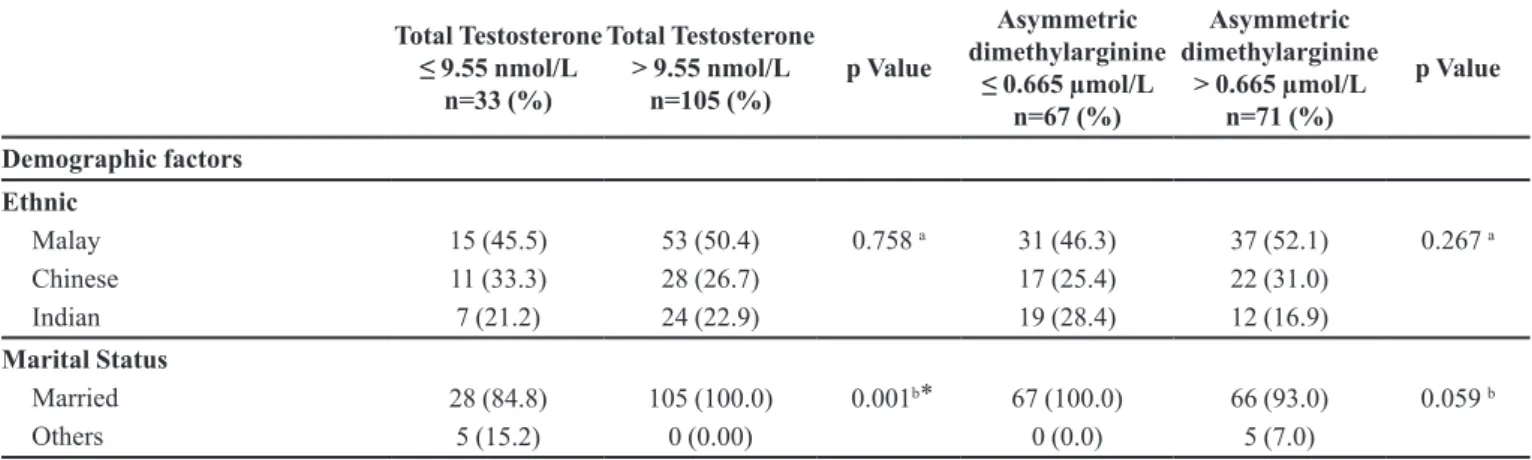
TABLE II - Association of Demographic, Clinical, and Lifestyle factors with Biomarkers level (TT and ADMA), n= 138
Total Testosterone
≤ 9.55 nmol/L
n=33 (%)
Total Testosterone
> 9.55 nmol/L
n=105 (%)
p Value
Asymmetric dimethylarginine
≤ 0.665 µmol/L n=67 (%)
Asymmetric dimethylarginine
> 0.665 µmol/L n=71 (%)
p Value
Demographic factors
Ethnic Malay Chinese Indian
15 (45.5) 11 (33.3) 7 (21.2)
53 (50.4) 28 (26.7) 24 (22.9)
0.758 a 31 (46.3) 17 (25.4) 19 (28.4)
37 (52.1) 22 (31.0) 12 (16.9)
0.267 a
Marital Status Married
Others
28 (84.8) 5 (15.2)
105 (100.0) 0 (0.00)
0.001b ⃰ 67 (100.0) 0 (0.0)
66 (93.0) 5 (7.0)
Total Testosterone
≤ 9.55 nmol/L
n=33 (%)
Total Testosterone
> 9.55 nmol/L
n=105 (%)
p Value
Asymmetric dimethylarginine
≤ 0.665 µmol/L n=67 (%)
Asymmetric dimethylarginine
> 0.665 µmol/L n=71 (%) p Value Demographic factors Occupation Government Employee Non-government employee Self Employed Pensioner Unemployed 3 (9.1) 2 (6.1) 5 (15.2) 15 (45.5) 8 (24.2) 33 (31.4) 27 (25.7) 16 (15.2) 15 (14.3) 14 (13.3)
< 0.001b ⃰ 21 (31.3)
20 (29.9) 11 (16.4) 9 (13.4) 6 (9.0) 15 (21.1) 9 (12.7) 10 (14.1) 21 (29.6) 16 (22.5)
0.006 a *
Academic Qualification Primary Secondary Tertiary 7 (21.2) 25 (75.8) 1 (3.0) 4 (3.8) 86 (81.9) 15 (14.3)
0.002 b ⃰ 2 (3.0) 53 (79.1) 12 (17.9)
9 (12.7) 58 (81.7)
4 (5.6)
0.014 b *
Monthly Household Income Low Medium High 16 (48.5) 14 (42.4) 3 (9.1) 14 (13.3) 51 (48.6) 40 (38.1)
< 0.001 b ⃰ 5 (7.5) 33 (49.3) 29 (43.3)
25 (35.2) 32 (45.1) 14 (19.7)
<0.001a*
Clinical factors
Type 2 Diabetes Mellitus Present Absent 20 (60.6) 13 (39.4) 50 (47.6) 55 (52.4)
0.270 c 31 (46.3) 36 (53.7)
39 (54.9) 32 (45.1)
0.397 c
Hypertension Present Absent 17 (51.5) 16 (48.5) 68 (64.8) 37 (35.2)
0.246 c 45 (67.2) 22 (32.8)
40 (56.3) 31 (43.7)
0.258 c
Hyperlipidemia Present Absent 18 (54.5) 15 (45.5) 47 (44.8) 58 (55.2)
0.434 c 29 (43.3) 38 (56.7)
36 (50.7) 35 (49.3)
0.483 c
Coronary Artery Disease Present
Absent
Lower Urinary Tract Symptoms/ Benign prostatic hyperplasia Present Absent 21 (63.6) 12 (36.4) 14 (42.4) 19 (57.6) 59 (56.2) 46 (43.8) 28 (26.7) 77 (73.8)
0.580 c
0.134 c
35 (52.2) 32 (47.8) 16 (23.9) 51 (76.1) 45 (63.4) 26 (36.6) 26 (36.6) 45 (63.4)
0.249 c
0.150 c
Sildenafil 100mg Yes No Sildenafil 50mg Yes No Tadalafil 20mg Yes No Vardenafil 10mg Yes No Vardenafil 20mg Yes No 3 (9.1) 30 (90.9) 19 (57.6) 14 (42.4) 3 (9.1) 30 (90.9) 5 (15.2) 28 (84.8) 3 (9.1) 30 (90.9) 31 (29.5) 74 (70.5) 43 (41.0) 62 (59.0) 19 (18.1) 86 (81.9) 4 (3.8) 101 (96.2) 8 (7.6) 97 (92.4)
0.080 b
0.140 c
0.282 b
0.058 b
0.724 b
20 (29.9) 47 (70.1) 29 (43.3) 38 (56.7) 9 (13.4) 58 (86.6) 4 (6.0) 63 (94.0) 5 (7.5) 62 (92.5) 14 (19.7) 57 (80.3) 33 (46.5) 38 (53.5) 13 (18.3) 58 (81.7) 5 (7.0) 66 (93.0) 6 (8.5) 65 (91.5)
0.237 c
0.837 c
0.583 c
0.799 b
0.830 c
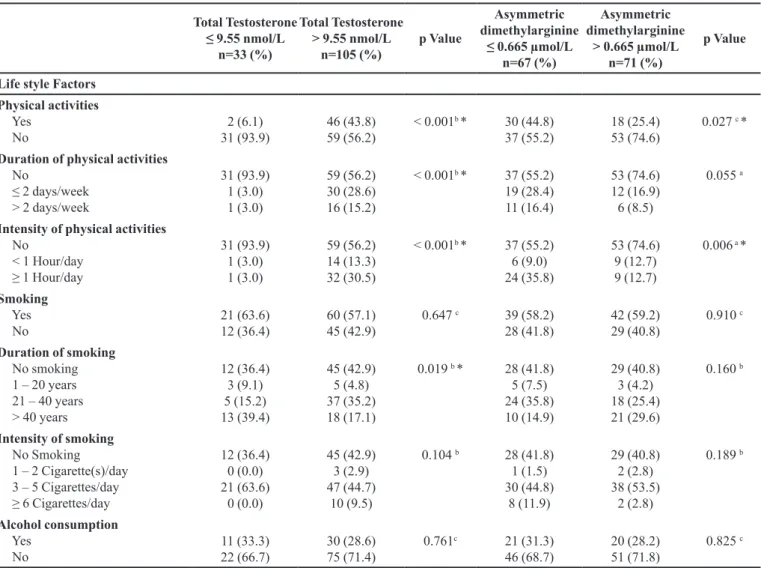
TABLE II - Association of Demographic, Clinical, and Lifestyle factors with Biomarkers level (TT and ADMA), n= 138 (cont.)
Total Testosterone
≤ 9.55 nmol/L
n=33 (%)
Total Testosterone
> 9.55 nmol/L
n=105 (%)
p Value
Asymmetric dimethylarginine
≤ 0.665 µmol/L n=67 (%)
Asymmetric dimethylarginine
> 0.665 µmol/L n=71 (%)
p Value
Life style Factors
Physical activities Yes
No
2 (6.1) 31 (93.9)
46 (43.8) 59 (56.2)
< 0.001b * 30 (44.8) 37 (55.2)
18 (25.4) 53 (74.6)
0.027 c *
Duration of physical activities No
≤ 2 days/week > 2 days/week
31 (93.9) 1 (3.0) 1 (3.0)
59 (56.2) 30 (28.6) 16 (15.2)
< 0.001b * 37 (55.2) 19 (28.4) 11 (16.4)
53 (74.6) 12 (16.9) 6 (8.5)
0.055 a
Intensity of physical activities No
< 1 Hour/day ≥ 1 Hour/day
31 (93.9) 1 (3.0) 1 (3.0)
59 (56.2) 14 (13.3) 32 (30.5)
< 0.001b * 37 (55.2) 6 (9.0) 24 (35.8)
53 (74.6) 9 (12.7) 9 (12.7)
0.006 a *
Smoking Yes No
21 (63.6) 12 (36.4)
60 (57.1) 45 (42.9)
0.647 c 39 (58.2) 28 (41.8)
42 (59.2) 29 (40.8)
0.910 c
Duration of smoking No smoking 1 – 20 years 21 – 40 years > 40 years
12 (36.4) 3 (9.1) 5 (15.2) 13 (39.4)
45 (42.9) 5 (4.8) 37 (35.2) 18 (17.1)
0.019 b * 28 (41.8) 5 (7.5) 24 (35.8) 10 (14.9)
29 (40.8) 3 (4.2) 18 (25.4) 21 (29.6)
0.160 b
Intensity of smoking No Smoking 1 – 2 Cigarette(s)/day 3 – 5 Cigarettes/day ≥ 6 Cigarettes/day
12 (36.4) 0 (0.0) 21 (63.6)
0 (0.0)
45 (42.9) 3 (2.9) 47 (44.7)
10 (9.5)
0.104 b 28 (41.8) 1 (1.5) 30 (44.8)
8 (11.9)
29 (40.8) 2 (2.8) 38 (53.5)
2 (2.8)
0.189 b
Alcohol consumption Yes
No
11 (33.3) 22 (66.7)
30 (28.6) 75 (71.4)
0.761c 21 (31.3) 46 (68.7)
20 (28.2) 51 (71.8)
0.825 c
Nominal data are reported as number (percentage), meanwhile interval data are expressed as mean±SD. a Computed using Pearson Chi Square. b Computed using Fisher’s Exact Test. c Computed using Continuity Correction. *statistically significant (p<0.05)
income, physical activity and intensity of physical activity
were reported as insignificant predictors for severity of ED (Table III).
The only significant predictor which influenced TT
level in Malaysian ED patients was occupation (p = 0.023).
Specifically, pensioner (0.038) and unemployed (0.007) decreased the TT level by 0.08 and 0.04 times respectively (Table IV). On the other hand, intensity of physical activity (p = 0.018) and academic qualification (p = 0.047) were reported as the significant predictors which influenced ADMA level in Malaysian ED population. Spending
less hours (inactive) for physical activities are 2.61 times
most likely increasing ADMA level than active men (OR = 0.87). Meanwhile, men with secondary academic qualification are 4.51 times most likely to increase ADMA level than men with tertiary academic qualification level (OR = 1.88) (Table V).
DISCUSSION
Severity of ED was increased as the age increased.
Mean IIEF-5 scores was higher in control group compared
to case (ED patients). This finding was consistent with
a survey conducted in Malaysia (Khoo et al., 2008).
Beside, half of the patients who participated in this study
were reported having ED (n = 138). This prevalence is in accordance with two studies conducted in Malaysia previously which reported nearly two third of the study
population were suffering from ED (Ab Rahman,
Al-Sadat, Yun Low, 2011; Fadzil et al., 2014). Occupation
(p = 0.03) and TT levels (p = 0.001) are the significant
predictors for worsening of severity level of ED in Malaysian population. Meanwhile, occupation (p = 0.023)
TABLE III - Predictors of Severity of ED (Binary Logistic Regression – Factors Associated with Severity of ED)
Predictors OR 95% CI p-value
Low High
Occupation a Government
Non-government
Self employed
Pensioner Unemployed
1.16 10.55
8.07 4.04
0.05 0.43 0.19 0.31
26.26 257.06 352.45 52.25
0.03* 0.04* 0.004* 0.026* 0.071
TT 0.41 0.25 0.69 0.001*
ADMA 320.75 0.77 133030.84 0.06
Academic
Qualification b
Primary
Secondary
Tertiary
0.02 0.01
0.00019 0.00031
1.18 0.68
0.10 0.06 0.07 Monthly Income c Low
Medium High
36.86 10.73
0.60 0.22
2269.33 521.76
0.21 0.09 0.23 Physical activity d Yes
No 1.57 0.16 15.45
0.408 0.701 Intensity of Physical
activity e
No < 1 Hour/day
≥ 1 Hour/day 1.34 1.07
0.12 0.88
15.30 1.26
0.82 0.82 0.86
Binary logistics regression test was done to obtain the OR and p value; *statistically significant (p<0.05); a Reference category: Government; b Reference category: Primary Education; c Reference category: Low Monthly Income; d Reference category: Yes (Actively involved in physical activity); e Reference category: No (Physical activity – Inactive).
TABLE IV - Predictors of Total Testosterone Level (Binary Logistic Regression – Factors Associated with TT level)
Predictors OR 95% CI p-value
Low High
Occupation a Government
Non-government
Self employed
Pensioner Unemployed
0.50 0.46 0.08 0.04
0.06 0.03 0.01 0.01
4.56 6.62 0.87 0.42
0.023* 0.542 0.571 0.038* 0.007* Academic
Qualification b
Primary
Secondary
Tertiary
0.06 0.33
0.01 0.02
1.71 6.10
0.108 0.099 0.458 Monthly Income c Low
Medium High
0.08 1.26
0.01 0.15
0.84 10.82
0.102 0.335 0.835 Physical activity d No
Yes 7.03 0.25 195.13
0.999 0.250 Duration Physical
activity d
No
≤ 2 days/week
> 2 days/week 2.16 2.65
0.05 0.95
91.51 50.51
0.755 0.686 0.686 Intensity Physical
activity d
No < 1 Hour/day
≥ 1 Hour/day 0.87 0.48
0.04 0.04
20.13 52.39
0.932 0.932 0.827 Duration of
smoking e
No smoking
1 – 20 years 21 – 40 years
> 40 years
1.40 0.24 1.46
0.39 0.01 0.31
4.99 4.13 7.00
0.628 0.608 0.324 0.635
and unemployed (0.007) decreasing the TT level by 0.08 and 0.04 times respectively. On the other hand, intensity of physical activity (p = 0.018) and academic qualification (p = 0.047) were reported as the significant predictors which influencing ADMA level in Malaysian ED population.
Factors associated with severity of ED
Our study showed that occupation is significantly
associated with the severity of ED and this finding is
supported by few studies conducted previously in Malaysia and globally (AlMogbel, 2014; Aytaç et al., 2000). This study envisions that patients' ED management is prone
to be affected by occupation status. Particularly, self-employed men were 10.55 times more likely to have severe ED as compared to government employees. Besides that, pensioners (OR = 8.07) and non-government employees (OR = 1.16) were also more prone to have severe ED than government employees. A study conducted in 26 diabetes clinics in Israel involving 900 ED patients with diabetes mellitus showed severity of ED was significantly increased in unemployed (p < 0.0001) and blue-collar profession
patients (p = 0.0044) (Kalter-Leibovici et al., 2005). The
term "blue-collar" and "white-collar" are occupational classifications that differentiate workers who perform manual labour and professional jobs respectively. Similar report was obtained from a study conducted by Aytaç et
al. (2000) that revealed a significant association between
occupation or employment status with severity of ED. The
result demonstrated that men in blue-collar professions were 1.55 times more likely to acquire severe ED when compared to men in white-collar occupation (O.R.=1.55, 95% C.I.=1.06–2.28) (Aytaç et al., 2000). Furthermore,
another study involving 312 Saudi diabetic patients reported that unemployed men were more likely to develop severe ED as compared to employees, and significant association was obtained between occupation and severity of ED (X2 =
29.069, df = 3, p = 0.001) (AlMogbel, 2014). In our study,
IIEF scores were reported to be higher among patients with better employment status with less workload and work stress. This explains that men with stable employment,
who are also generously compensated have a greater sense
of control over their wellbeing (Momtaz et al., 2014).
Besides that, ED was severe among patients with unstable employment as this could be due to financial constraints
in treating ED. The costs associated with ED treatment
can be a financial burden. Therefore, the ED treatment is unaffordable for some patients who have unsecured job coupled with high living expenses (Hackett, 2005).
This situation explains the huge difference in severity of ED among patients in different categories of occupation. High workload and unemployment for a longer period of time can impact our health as well. Stress due to unemployment or work burden eventually affects erection
TABLE V - Predictors of Asymmetric Dimethylarginine (ADMA) level (Binary Logistic Regression – Factors Associated with ADMA level)
Predictors OR 95% CI p-value
Low High
Occupation a Government
Non-government
Self employed
Pensioner Unemployed
5.40 1.89 6.23 7.15
0.45 0.16 0.51 0.64
64.15 22.73 76.70 80.36
0.109 0.181 0.615 0.153 0.111
Academic
Qualification b
Primary
Secondary
Tertiary
4.51 1.88
0.48 0.48
42.83 7.40
0.047* 0.014* 0.341
Monthly Income c Low Medium
High
20.99 1.85
1.87 0.52
235.25 6.60
0.418 0.190 0.367
Physical activity d Yes
No 0.52 0.19 1.41 0.198
Intensity Physical activity e
No < 1 Hour/day
≥ 1 Hour/day 2.61 0.87
0.65 0.18
10.48 4.21
0.018* 0.008* 0.060
and impedes men’s sexual life. A significant negative impact
on sexual health was reported in a psychological study
inspecting the association between sexual dysfunction and
occupational stress (Štulhofer, Træen, Carvalheira, 2013).
The study revealed that working longer hours and stress in accomplishing a work within a targeted time eventually
affect sexual performance. This study also showed that
men with a higher workload are 1.8 times more likely to have issues in sexual relationship than men with less work
strain (Štulhofer, Traeen, Carvalheira, 2013). In addition,
financial crisis faced by unemployed men causes their ED to be untreated over a long time. This could also lead to the risk of increasing ED severity. Approaching a therapist or a doctor is the best solution to alleviate severe ED. Besides that, discussing the problem with partners by expressing their feeling and expectations could help affected men to feel better.
This finding emphasized that there was a significant association between TT level and the severity of ED. From this study, it can be observed that TT (p < 0.001) was significantly associated with severity of ED. Furthermore, binary regression analysis indicated low TT level as a significant predictor which was more likely to cause severe ED, (OR=0.41). High level of TT might not heavily affect erectile function, however low TT level can have significant
impact on the severity level of ED (Mikhail, 2006). This
was proven in a few studies which explored significant
effect of low TT level on the severity of ED (Brooke et al.,
2014; Liao et al., 2012; Martínez‐Jabaloyas et al., 2006).
TT plays a crucial role in the sexual function of men and
several studies have investigated the relationship between TT levels with male sexual behaviours especially ED (Liao
et al., 2012; Tsujimura, 2013). According to a systematic
study by Mikhail, low level of TT may have a major impact
on erectile function (Mikhail, 2006). Study conducted on
1,776 Chinese men aged 20 to 77 years old showed that
TT is significantly associated with severity of ED with an odds ratio of 1.02 after adjusting the confounding variable; age (OR: 1.02; 95% CI; 1.00–1.04) (Liao et al., 2012). This
finding was consistent with the evidence from a study by Brooke et al. (2014) involving 126 ED patients with type
II diabetes which reported a significant positive correlation between IIEF-5 scores and TT (r = 0.546, p = 0.001), where
the severity of ED decreases as TT level increases (Brooke
et al., 2014). Parallel to this finding, a prospective study by
Kang et al. (2011) involving 134 men who visited urology
clinics with the complaint of ED revealed a significant
positive correlation between serum TT level and IIEF
scores (r=0.124, p=0.034). This study also disclosed that TT
levels below the normal range significantly increased the
severity of ED (Kang et al., 2011). TT acts as a vasodilator
for the penile arterioles. The vasodilation of the arteries
around the corpora cavernosa allows more blood to flow
in to help maintain the erection. Additionally, TT activates
the NO synthase and increases the expression of NO and
phosphodiesterase type 5, which are essential enzymes
for erection (Blute et al., 2008). Besides that, testosterone
restores structural, biochemical and physiological changes
and induces new DNA synthesis in the smooth muscle cells
and blood vessels. In addition, testosterone also contributes
to venous occlusion and helps men to maintain erection (Shabsigh, 2005). Investigation on TT level should be done
in men who were having symptoms of ED. Undeniably, testosterone therapy can be considered as a recommended and effective treatment for men with severe ED.
Factors associated with Total Testosterone (TT) levels in Malaysian ED patients
The effect of demographic, clinical and lifestyle
factors cause significant changes on binary regression model of TT level in ED patients. After all the significant variables of demographic, clinical and lifestyle factors are included into binary regression model, occupation (p = 0.023) remained as significant predictor. Findings revealed that pensioners (OR = 0.08, 95% CI = 0.01-0.87, p = 0.038) and unemployed men (OR = 0.04, 95% CI = 0.01-0.42, p = 0.07) are most likely to have low TT level
as compared to government employees.
To the best of the author’s knowledge, very few studies have been done on predictors of demographic factors
on TT level in ED patients. However, some association
studies have been conducted based on low TT level with occupation and found that lower social status is significantly
associated with low TT level (Zitzmann, Nieschlag, 2001).
Men with better employment status have higher TT level
as compared to unemployed men and pensioners. This result was in accordance with multiple studies that had
been conducted earlier, studying the significant impact of occupation on TT level. Men who have work stress are likely to have lower TT level. On the contrary, higher TT
level helps in lowering stress and in giving more strength
and inspiration to perform better at work (Greene et al., 2014). It is a known fact that stress may have physiological
effects on body and cause infertility by decreasing TT level. Besides that, high stress and low TT level result in common
physical symptoms including erectile dysfunction. There are few studies evidencing that the stress hormone cortisol
and TT level work against each other and a high stress level
is strongly associated with low TT level. Increasing stress
level due to heavy workload could affect gonadal hormones
A meta-analysis study reported that cortisol level may
have a significant effect on TT level (Geniole et al., 2016).
The notable psychological association between TT level and stress is not well known. It is most likely that the
chemicals secreted in response to stress may regulate the TT production and control its level. This indicates that socioeconomic statuses as well as psychological stress
influence men’s endocrine system and in turn influences
the TT level.
Factors associated with Asymmetric
Dimethylarginine (ADMA) level in Malaysian ED patients
Academic qualification is presented as predictor
which influences ADMA level in ED patients. The link between education and ADMA level is complex and is tied closely to income. Although no studies were established on the association of academic qualification with ADMA
level yet, there were few theories and hypotheses which
can illustrate how education can be associated with ADMA level in term of patients’ health. Education can increase an individual’s knowledge levels and sense of control over their life, which in turn would encourage them to embrace
a healthier lifestyle. Educated men value their health highly.
They constantly look for the guidance of a physician or an experienced health care provider about their health and these men are ready to communicate effectively with
them. However, less educated people might be unaware of
their health due to lack of knowledge on diseases and its
symptoms, which compromises on their health. In addition,
poor quality of doctor-patient communication contributes
to the high percentage of health issue among this group
(Verlinde et al., 2012). Low morbidity rate was reported
among educated men and they are less likely to have poor health. In contrast, the opposite result was observed for less
educated men (Sallis, Carlson, 2015; Zimmerman, Woolf,
2014). Besides that, a few studies suggest that educated
people have healthier behaviours. Those with higher education level were less likely to smoke, drink heavily, use illegal drugs or be overweight (Cutler, Lleras-Muney, 2010). In this study, the knowledge on chemical nature of
biomarker (especially ADMA) is essential as it will help
them to predict how it is produced and the mechanism of
action in our body. This knowledge will help an individual to be aware of the biomarker level changes and to seek medical help in order to overcome the problem.
Meanwhile, increasing intensity of physical activities could help to decrease ADMA concentration level in ED patients. This finding is consistent with a study
conducted by Mittermayer et al. (2005), which reported that
constant physical activity significantly decreases ADMA
concentration (p < 0.001) (Mittermayer et al., 2005).
Even though the above mentioned study was conducted on non-ED population, the finding concluded that there is an association between intensity of physical activities and ADMA levels. Recently, Kevin (2011) showed that after
a moderate to intense exercise, ADMA level decreased in
patients from the initial level before they began the exercise
(0.42 ± 0.02 and 0.43 ± 0.03 micromol/l). The ADMA level started to increase again after they discontinued their exercise (Kevin, 2011). A decrease in ADMA level was even recorded in an animal study after the rats were exposed to exercise training, although the result was statistically
insignificant (Esfahani et al., 2013). These studies
concluded that ADMA level can be lowered by consistent
physical activities. The mechanism to decrease ADMA level associated with physical exercise is crucial. ADMA
is produced in substantial amount through methylation of protein-bound L-arginine by protein methyltransferase (PRMT) enzyme and the decomposition of these ADMA by
DDAH activity appears to determine the ADMA level in our
body (Teplan et al., 2014). Intensive physical activities may
affect antioxidant level through increased expression of the superoxide dismutase. The DDAH activity was reduced by
the increased concentration of oxidants level and oxidative stress. Hence, the enhancement of antioxidant status through
regular exercise might be related to the decrease in ADMA
level in physically active individuals (Mittermayer et al.,
2005; Teplan et al., 2014). Besides that, constant physical
activity can initiate the endothelial NO-synthase (eNOS)
expression through increased endothelial shear stress and
arterial blood flow. As we discussed earlier, ADMA inhibits NO synthesis. However, increasing intensity of physical exercise elevate NO bioavailability. This explains that ADMA level is suppressed upon significant improvement in
physical activities which resulted in increased concentration
level of NO (Schlager et al., 2011). Furthermore, ADMA
could trigger the development of atherosclerosis by inhibiting NO production from amino acid l-arginine.
Hence, decreased ADMA levels may enhance endothelial
function in ED patients who were physically active (Böger,
2006). Since high ADMA level was related to ED (Paroni
et al., 2012), our findings demonstrate that physical
activity does not only decrease ADMA level but could also contribute to improvement in erectile function.
In addition, food intake and diets may be associated
with ED. It is noted that cleaning up our diet is the more natural ways to improve the erectile function. Foods as well as the environmental pollutants and chemicals that can
cause ED should be avoided for a better men’s sexual health
similar eating patterns that can cause cardiovascular diseases
due to limited blood flow in the coronary arteries also block blood flow to the arteries around corpora cavernosa (La
Favor et al., 2013). Diets that lack of fruits and vegetables
alongside with plenty of fatty, fried and processed foods can
lead to decreased blood circulation throughout the body.
According to Esposito, ED is disproportion to clean diet,
which includes fruits, vegetables, whole grains, fish,
heart-healthy fats including nuts and olive oil (Esposito et al.,
2010). Animal fat and cholesterol is particularly bad for our
heart. In fact, many men do not realize that ED is one of the
early signs of cardiovascular diseases whereas a good blood
circulation is needed to achieve and maintain an erection.
Besides, consuming foods packed in cans or plastic would increase the possibility having severe ED. Bisphenol-A (BPA) is a chemical found in plastic products as well as on the linings in canned foods which can inhibit sex hormones (Vandenberg et al., 2007; Rudel et al., 2011).
Few studies have found links associating BPA with ED and
decreased sexual desire, as well as infertility (Li et al., 2009;
Li et al., 2010). Other than this, soy and processed foods
which were high in carbohydrates and excessive unhealthy fats have an estrogenic effect and can affect men’s hormones as well. It contains substances that mimic estrogen, a
female hormone that men have in smaller amounts. It is
important to maintain the right balance between estrogen
and testosterone to preserve the sexual health especially
erectile function (Siepmenn et al., 2011).
There are evidences that chronic heavy drinking
can cause liver and nerve damage which can interfering
with the normal balance of male sex hormone levels that
can lead to ED. Alcohol may alter the endocrine system
and has an inhibitory effect on hypothalamic pituitary testicular axis which has direct effect on testis. Alteration in gonadotropin releasing hormone receptor by alcohol
may result in decrease of LH synthesis. Moreover,
increased β-endorphin levels in heavy alcoholics may lead
to testicular damage and diminish testosterone production
(La Vignera et al., 2013).
In conclusion, the purpose of this study was to
examine the combination of demographic, clinical and lifestyle factors that could be associated with the severity of ED and biomarker levels in Malaysian ED patients. The binary regression result concluded occupation and TT as the significant predictors of severity of ED. Demographic and biomarker dominate clinical and lifestyle factors in
determining predictors of severity of ED in Malaysian ED patients. It shows that Malaysian patients generally live a healthy lifestyle practising good ethics in term of physical
activeness, smoking and alcohol consumption. Meanwhile,
demographic and lifestyle factors predominate clinical
factors in influencing TT and ADMA levels. As per the
present results, there is a reasonable need to investigate the TT level and occupational background of patients when
they present with severe ED. Urologists or ED experts
should examine patients’ TT levels and add the necessary improvements in treating ED patients. Besides, urologists
also need to educate ED patients and give priorities for their
health issues regardless of their occupation background and help them to live a quality life. Identification of these
predictors influencing severity of ED, TT and ADMA
level may help to increase our knowledge on risk factors of
ED. Thus, these predictors may serve as new indicators in providing primarily guidance to urologists or physician and
ensuring ED can be managed and treated more effectively.
ACKNOWLEDGEMENT
The authors would like to thank University of Malaya, Malaysia (RP024A-14HTM) for financial and
technical supports.
CONFLICT OF INTEREST
The authors declare that there is no conflict of interest.
REFERENCES
Ab Rahman AA, Al-Sadat N, Yun Low W. Prevalence of erectile
dysfunction in primary care setting, Malaysia. J Mens Health.
2011;8(S1):S50-S3.
Aktoz T, Aktoz M, Tatli E, Kaplan M, Turan FN, Barutcu A, et al. Assessment of the relationship between asymmetric
dimethylarginine and severity of erectile dysfunction and
coronary artery disease. Int Urol Nephrol. 2010;42(4):873-9.
Al Mogbel TA. Erectile dysfunction and other sexual activity dysfunctions among Saudi Type 2 Diabetic patients. Int J Health Sci. 2014;8(4):347-59.
Ali Z, Mishra A, Kumar R, Alam P, Pandey P, Ram R, et al. Interactions among vascular-tone modulators contribute to
high altitude pulmonary edema and augmented vasoreactivity
in highlanders. PLoS One. 2012;7(9):e44049.
Bacon CG, Mittleman MA, Kawachi I, Giovannucci E, Glasser DB, Rimm EB. A prospective study of risk factors for erectile dysfunction. J Urol. 2006;176(1):217-21.
Blute M, Hakimian P, Kashanian J, Shteynshluyger A, Lee M, Shabsigh R. Erectile dysfunction and testosterone deficiency. Front Horm Res. 2008. p. 108-22.
Böger RH. Asymmetric dimethylarginine (ADMA): a novel risk marker in cardiovascular medicine and beyond. Ann Med. 2006;38(2):126-36.
Brooke J, Walter D, Kapoor D, Marsh H, Muraleedharan
V, Jones T. Testosterone deficiency and severity of erectile dysfunction are independently associated with reduced quality
of life in men with type 2 diabetes. J Androl. 2014;2(2):205-11.
Cao S, Yin X, Wang Y, Zhou H, Song F, Lu Z. Smoking and risk of erectile dysfunction: systematic review of observational
studies with meta-analysis. PLoS One. 2013;8(4):e60443.
Chrysohoou C, Panagiotakos D, Pitsavos C, Siasos G, Oikonomou E, Varlas J, et al. Low total testosterone levels are
associated with the metabolic syndrome in elderly men: the role of body weight, lipids, insulin resistance, and inflammation; the Ikaria study. Rev Diabet Stud. 2013;10(1):27.
Cutler DM, Lleras-Muney A. Understanding differences in
health behaviors by education. J Health Econ. 2010;29(1):1-28.
Dutkiewicz S, Skawiński D, Duda W, Duda M. Assessing the influence of Benign Prostatic Hyperplasia (BPH) on Erectile
Dysfunction (ED) among patients in Poland. Cent European J
Urol. 2012;65(3):135-138.
Esfahani PS, Gharakhanlou R, Karimian J, Khazaei M, Feizi A, Safarzade A. Effect of resistance training on plasma nitric
oxide and asymmetric dimethylarginine concentrations in type
i diabetic rats. Int J Prev Med. 2013;4(Suppl 1):S78.
Esposito K, Ciotola M, Giugliano F, Maiorino MI, Autorino R, De Sio M, Giugliano D, et al. Effects of intensive lifestyle changes on erectile dysfunction in men. J Sexual Med. 2009;6(1):243-250.
Esposito K, Giugliano F, Maiorino MI, & Giugliano D. Dietary factors, Mediterranean diet and erectile dysfunction. J Sexual Med. 2010;7(7):2338-2345.
Fadzil MA, Sidi H, Ismail Z, Hassan MRC, Thuzar K, Midin M, et al. Socio-demographic and psychosocial correlates of erectile
dysfunction among hypertensive patients. Compr Psychiatry.
2014;55(Suppl 1):S23-S8.
Gades NM, Nehra A, Jacobson DJ, McGree ME, Girman CJ, Rhodes T, et al. Association between smoking and erectile dysfunction: a population-based study. Am J Epidemiol. 2005;161(4):346-51.
Geniole SN, Bird BM, Ruddick EL, Carré JM. Effects of
competition outcome on testosterone concentrations in humans:
An updated meta-analysis. Horm and Behav. 2016. [ahed of print].
Greene FJ, Han L, Martin S, Zhang S, Wittert G. Testosterone is
associated with self-employment among Australian men. Econ
Hum Biol. 2014;13:76-84.
Griffeth RJ, Carretero J, Burks DJ. Insulin receptor substrate 2 is required for testicular development. PLoS One. 2013;8(5):e62103.
Grossmann M, Gianatti EJ, Zajac JD. Testosterone and type 2 diabetes. Curr Opin Endocrinol Diabetes Obes.
2010;17(3):247-56.
Hackett GI. Patient preferences in treatment of erectile
dysfunction: the continuing importance of patient education.
Clin cornerstone. 2005;7(1):57-65.
Huri HZ, Sanusi NDM, Razack AHA, Mark R. Association of psychological factors, patients’ knowledge, and management
among patients with erectile dysfunction. Patient Prefer
Adherence. 2016;10:807.
Isidori AM, Buvat J, Corona G, Goldstein I, Jannini EA, Lenzi
A, et al. A critical analysis of the role of testosterone in erectile function: from pathophysiology to treatment-a systematic
review. Eur Urol. 2014;65(1):99-112.
Javaroni V, Neves MF. Erectile dysfunction and hypertension:
impact on cardiovascular risk and treatment. Int J Hypertens. 2012;2012:627278.
Kang JI, Ham BK, Oh MM, Kim JJ, Moon DG. Correlation between serum total testosterone and the AMS and IIEF
questionnaires in patients with erectile dysfunction with
testosterone deficiency syndrome. Korean J Urol.
Kałka D, Domagała Z, Dworak J, Womperski K, Rusiecki L, Marciniak W, et al. Association between physical exercise and
quality of erection in men with ischaemic heart disease and
erectile dysfunction subjected to physical training. Kardiol Pol. 2013;71(6):573-80.
Kalter-Leibovici O, Wainstein J, Ziv A, Harman-Bohem I, Murad H, Raz I. Clinical, socioeconomic, and lifestyle parameters associated with erectile dysfunction among diabetic men. Diabetes care. 2005;28(7):1739-44.
Kevin R. Rapid communication-effect of exercise training on
asymmetric dimethylarginine concentration in women aged
65-74 years with Type 2 Diabetes. Endocrinol Metabol Syndrome.
2011.
Khoo EM, Tan HM, Low WY. Erectile dysfunction and comorbidities in aging men: An urban cross‐sectional study in
Malaysia. J Sex Med. 2008;5(12):2925-34.
La Favor JD, Anderson EJ, Hickner RC, Wingard CJ. Erectile
dysfunction precedes coronary artery endothelial dysfunction
in rats fed a high‐fat, high‐sucrose, Western pattern diet. J Sex
Med. 2013;10(3):694-703.
La Vignera S, Condorelli RA, Balercia G, Vicari E, Calogero AE. Does alcohol have any effect on male reproductive function? A review of literature. Asian J Androl. 2013;15(2):221-5.
Lee A, Ho L, Yip A, Fan S, Lam T. The effect of alcohol drinking on erectile dysfunction in Chinese men. Int J Impot Res. 2010;22(4):272-8.
Li D, Zhou Z, Qing D, He Y, Wu T, Miao M, Zhu Q, et al. Occupational exposure to bisphenol-A (BPA) and the risk of self-reported male sexual dysfunction. Human Reproduction. 2009;25(2):519-527.
Li DK, Zhou Z, Miao M, He Y, Qing D, Wu T, Zhu Q, et al. Relationship Between Urine Bisphenol‐A Level and Declining
Male Sexual Function. J Androl. 2010;31(5):500-506.
Liao M, Huang X, Gao Y, Tan A, Lu Z, Wu C, et al. Testosterone
is associated with erectile dysfunction: a cross-sectional study
in Chinese men. PloS One. 2012;7(6):e39234.
Martínez‐Jabaloyas JM, Queipo‐Zaragozá A, Pastor‐Hernández
F, Gil‐Salom M, Chuan‐Nuez P. Testosterone levels in men with
erectile dysfunction. BJU Int. 2006;97(6):1278-83.
Martin SA, Atlantis E, Lange K, Taylor AW, O'Loughlin P, Wittert GA. Predictors of sexual dysfunction incidence and remission in men. J Sex Med. 2014;11(5):1136-47.
Meller SM, Stilp E, Walker CN, Mena-Hurtado C. The link between vasculogenic erectile dysfunction, coronary artery disease, and peripheral artery disease: role of metabolic factors and endovascular therapy. J Invasive Cardiol. 2013;25(6):313-9.
Micheel C, Nass S, Omenn G. Committee on the Review of Omics-Based Tests for Predicting Patient Outcomes in Clinical Trials; Board on Health Care Services; Board on Health Sciences Policy; Institute of Medicine. Evolution of translational omics:
Lessons learned and the path forward. Evolution of Translational
Omics: Lessons Learned and the Path Forward Institute of Medicine. 2012; 300p.
Mikhail N. Does testosterone have a role in erectile function? Am J Med. 2006;119(5):373-82.
Mittermayer F, Pleiner J, Krzyzanowska K, Wiesinger GF, Francesconi M, Wolzt M. Regular physical exercise normalizes
elevated asymmetrical dimethylarginine concentrations in
patients with type 1 diabetes mellitus. Wien Klin Wochenschr. 2005;117(23-24):816-20.
Momtaz YA, Hamid TA, Ibrahim R, Akahbar SAN. Racial
and socioeconomic disparities in sexual activity among older
married Malaysians. Arch Gerontol Geriatr. 2014;58(1):51-5.
Musicki B, Liu T, Lagoda GA, Strong TD, Sezen SF, Johnson
JM, et al. Hypercholesterolemia‐induced erectile dysfunction:
Endothelial nitric oxide synthase (eNOS) uncoupling in the mouse penis by NAD (P) H oxidase. J Sex Med.
2010;7(9):3023-32.
Nargund VH. Effects of psychological stress on male fertility. Nat Rev Urol. 2015;12(7):373-82.
NIH Consensus Conference. Impotence. NIH Consensus
Development Panel on Impotence. JAMA. 1993;270(1):83-90.
Nikoobakht M, Nasseh H, Pourkasmaee M. The relationship between lipid profile and erectile dysfunction. Int J Impot Res. 2005;17(6):523-6.
Demographic, clinical and lifestyle predictors for severity of erectile dysfunction and biomarkers level in Malaysian patients
Önder A, Aycan Z, Koca C, Ergin M, Çetinkaya S, Ağladıoğlu SY, et al. Evaluation of asymmetric dimethylarginine (ADMA) levels in children with growth hormone deficiency. J Clin Res Pediatr Endocrinol. 2014;6(1):22.
Oyekanmi AK, Adelufosi AO, Abayomi O, Adebowale TO.
Demographic and clinical correlates of sexual dysfunction among Nigerian male outpatients on conventional antipsychotic
medications. BMC Res Notes. 2012;5:267.
Paroni R, Barassi A, Ciociola F, Dozio E, Finati E, Fermo
I, et al. Asymmetric dimethylarginine (ADMA), symmetric
dimethylarginine (SDMA) and L‐arginine in patients with
arteriogenic and non‐arteriogenic erectile dysfunction. Int J
Androl. 2012;35(5):660-7.
Pastuszak AW. Current diagnosis and management of erectile dysfunction. Curr Health Sex Rep. 2014;6(3):164-76.
Rudel RA, Gray JM, Engel CL, Rawsthorne TW, Dodson RE, Ackerman JM, Brody JG, et al. Food packaging and bisphenol A and bis (2-ethyhexyl) phthalate exposure: findings from a dietary intervention. Environ Health Persp. 2011;119(7):914.
Safarinejad MR, Hosseini SY. Erectile dysfunction: clinical guidelines (2). J Urol. 2004;1(4):227-39.
Sallis JF, Carlson JA. Population health: behavioral and social science insights physical activity: numerous benefits and effective interventions. Agency for Healthcare Research and Quality, Rockville, MD. Rockville, MD: Agency for Healthcare Research and Quality; 2015.
Schlager O, Giurgea A, Schuhfried O, Seidinger D, Hammer A, Gröger M, et al. Exercise training increases endothelial
progenitor cells and decreases asymmetric dimethylarginine in peripheral arterial disease: a randomized controlled trial.
Atherosclerosis. 2011;217(1):240-8.
Shabsigh R. Testosterone therapy in erectile dysfunction and hypogonadism. J Sex Med. 2005;2(6):785-92.
Shamloul R, Ghanem H. Erectile dysfunction. Lancet. 2013;381(9861):153-65.
Siepmann T, Roofeh J, Kiefer FW, Edelson DG. Hypogonadism
and erectile dysfunction associated with soy product
consumption. Nutrition. 2011; 27(7): 859-862.
Strimbu K, Tavel JA. What are biomarkers? Curr Opin HIV AIDS. 2010;5(6):463.
Štulhofer A, Træen B, Carvalheira A. Job‐related strain and
sexual health difficulties among heterosexual men from three
european countries: the role of culture and emotional support. J
Sex Med. 2013;10(3):747-56.
Tamler R. Diabetes, obesity, and erectile dysfunction. Gend Med. 2009;6(Suppl 1):4-16.
Tan H, Ng C, Low W, Khoo E, Yap P, Tan W. The Subang men’s health research–a multiethnic community based study. Aging Male. 2007;10(2):111.
Tan KC, Shiu SW, Wong Y, Tam X. Serum advanced glycation end products (AGEs) are associated with insulin resistance. Diabetes Metab Res Rev. 2011;27(5):488-92.
Teplan V, Mahrova A, Piťha J, Racek J, Gürlich R, Teplan Jr V, et al. Early Exercise Training After Renal Transplantation and Asymmetric Dimethylarginine: Effect Obesity Kidney Blood Press Res. 2014;39(4):289-98.
Tsujimura A. The relationship between testosterone deficiency and men's health. World J Mens Health. 2013;31(2):126-35.
Vandenberg LN, Hauser R, Marcus M, Olea N, Welshons WV. Human exposure to bisphenol A (BPA). Reproduct Toxicol. 2007;24(2):139-177.
VanVoorhis CRW, Morgan BL. Understanding power and rules of thumb for determining sample sizes. Tutor Quant Methods Psychol. 2007;3(2):43-50.
Verlinde E, De Laender N, De Maesschalck S, Deveugele M, Willems S. The social gradient in doctor-patient communication. Int J Equity Health. 2012;11(1):1-14.
Zimmerman E, Woolf SH. Understanding the relationship between education and health. Institute of Medicine of the National Academies; 2014.
Zitzmann M, Nieschlag E. Testosterone levels in healthy men
and the relation to behavioural and physical characteristics: facts and constructs. Eur J Endocrinol. 2001;144(3):183-97.