and Combine Tests of Selection
Emanuel Maldonado1., Kartik Sunagar1,2., Daniela Almeida1,2., Vitor Vasconcelos1,2 , Agostinho Antunes1,2*
1CIIMAR/CIMAR – Interdisciplinary Centre of Marine and Environmental Research, University of Porto, Porto, Portugal,2Department of Biology, Faculty of Sciences, University of Porto, Porto, Portugal
Abstract
Among the major goals of research in evolutionary biology are the identification of genes targeted by natural selection and understanding how various regimes of evolution affect the fitness of an organism. In particular, adaptive evolution enables organisms to adapt to changing ecological factors such as diet, temperature, habitat, predatory pressures and prey abundance. An integrative approach is crucial for the identification of non-synonymous mutations that introduce radical changes in protein biochemistry and thus in turn influence the structure and function of proteins. Performing such analyses manually is often a time-consuming process, due to the large number of statistical files generated from multiple approaches, especially when assessing numerous taxa and/or large datasets. We present IMPACT_S, an easy-to-use Graphical User Interface (GUI) software, which rapidly and effectively integrates, filters and combines results from three widely used programs for assessing the influence of selection: Codeml (PAML package), Datamonkey and TreeSAAP. It enables the identification and tabulation of sites detected by these programs as evolving under the influence of positive, neutral and/or negative selection in protein-coding genes. IMPACT_S further facilitates the automatic mapping of these sites onto the three-dimensional structures of proteins. Other useful tools incorporated in IMPACT_S include Jmol, Archaeopteryx, Gnuplot, PhyML, a built-in Swiss-Model interface and a PDB downloader. The relevance and functionality of IMPACT_S is shown through a case study on the toxicoferan-reptilian Cysteine-rich Secretory Proteins (CRiSPs). IMPACT_S is a platform-independent software released under GPLv3 license, freely available online from http://impact-s.sourceforge.net.
Citation:Maldonado E, Sunagar K, Almeida D, Vasconcelos V, Antunes A (2014) IMPACT_S: Integrated Multiprogram Platform to Analyze and Combine Tests of Selection. PLoS ONE 9(10): e96243. doi:10.1371/journal.pone.0096243
Editor:Konrad Scheffler, University of California, San Diego, United States of America
ReceivedAugust 13, 2013;AcceptedApril 4, 2014;PublishedOctober 20, 2014
Copyright:ß2014 Maldonado et al. This is an open-access article distributed under the terms of the Creative Commons Attribution License, which permits unrestricted use, distribution, and reproduction in any medium, provided the original author and source are credited.
Funding:This research was supported in part by the European Regional Development Fund (ERDF) through the COMPETE - Operational Competitiveness Program and national funds through FCT under the project PEst-C/MAR/LA0015/2013, by the FCT projects PTDC/AAC-AMB/104983/2008 (FCOMP-01-0124-FEDER-008610), PTDC/AAC-CLI/116122/2009 (FCOMP-01-0124-FEDER-014029) and PTDC/AAC-AMB/121301/2010 (FCOMP-01-0124-FEDER-019490), and by the University of Porto and Santander Totta project PP-IJUP2011-315 to AA. The funders had no role in study design, data collection and analysis, decision to publish, or preparation of the manuscript.
Competing Interests:The authors have declared that no competing interests exist.
* Email: [email protected]
.These authors contributed equally to this work.
Introduction
The nature and strength of evolutionary selection pressures can be estimated at the molecular level, as a non-synonymous to synonymous substitution rate ratio omega (v= dN/dS), wherev
greater than, equal to and less than 1 is indicative of positive, neutral and negative selection, respectively [1]. This approach often fails to detect subtle adaptations that only affect certain regions of the protein and/or take place over a very short period of evolutionary time [2]. Moreover, the evaluation of selective pressures solely at the nucleotide level and the assumption that all mutations affect the fitness of the organism equally could be misleading. Although non-synonymous substitutions introduce variations in coding regions, a novel amino acid could have identical or similar biochemical and/or structural properties to that of the ancestral residue. Such substitutions are unlikely to influence the structure or the function of the protein and hence are least likely to affect the fitness of an organism. Thus, it is important to discern the nature of mutations to precisely understand the evolution of a protein. By employing mapping strategies of
accurately identify regions under various regimes of natural selection, it is essential to adopt a complementary approach [14]. Although several software applications have been proposed to independently evaluate selection pressures at the codon-level [15– 18], an integrative approach, which additionally evaluates the strength and radicalness of non-synonymous substitutions at the amino acid-level, is still missing. In addition, the manual integration of results from various approaches is time-consuming. To address these shortcomings and to facilitate the integration of results from various selection assessments, we propose IMPACT_S, a free platform-independent user-friendly GUI software that integrates results of nucleotide and amino acid-level assessments by employing three widely used softwares: Codeml from Phylogenetic Analysis by Maximum Likelihood (PAML) package [17], Datamonkey, a web-server of the HyPhy [20] package - www.datamonkey.org [18,19], and Selection on Amino Acid Properties using phylogenetic trees (TreeSAAP) [15]. Sites detected as positively and negatively selected can be automatically mapped onto the 3D structure of the protein. If experimentally determined protein structures are unavailable, IMPACT_S facilitates the prediction of models, through homology, using the built-in Swiss-Model [21–23] interface. Homology modeling is based on evolutionary relationships between target and template sequences. The template sequences result from homology searches of experimentally determined protein structures, through succes-sive BLAST-p [34] searches. This method involves the construc-tion of an atomic resoluconstruc-tion model for the protein under study using an experimentally determined 3D-structure of a similar homologous protein [23]. The following criteria are automatically considered by Swiss-Model in order to obtain a single high quality template: (i) identification of related proteins with experimentally solved structures, (ii) mapping of corresponding residues of target and template structures, (iii) building of the 3D model on the basis of the alignment and finally, (iv) evaluation of the quality of the resulting model [23].
In the following sections, we introduce the foundations, the structure and the development of IMPACT_S and demonstrate the relevance and functionality of IMPACT_S using a case study on Cysteine-rich Secretory Proteins (CRiSPs), a class of reptilian and mammalian glycoproteins with extremely diversified func-tions. CRiSPs have been theorized to play important functions in the mammalian reproductive pathways, while in toxicoferan reptiles (venomous snakes and lizards) they have been hypothe-sized to participate in prey envenoming and capture [11].
Design and Implementation
IMPACT_S Foundation
IMPACT_S integrates three broadly used bioinformatic soft-wares for assessing selection pressures shaping the evolution of protein-coding genes: (i) PAML and (ii) Datamonkey for assessing selection at the codon-level, and (iii) TreeSAAP to detect selection at the protein-level.
Codeml from the PAML package [17], implements powerful site-specific [24,25], branch-specific [26,27] and branch-site specific models [25,28] that detect the influence of natural selection, easily and reliably. Site-specific models, which are the current focus of this work, comprise the alternative models – model 2a (M2a) and model 8 (M8) and the null models – model 1a (M1a) and model 7 (M7). The alternative models include the Bayes Empirical Bayes (BEB) [25] approach for identifying positively selected sites. The computedvvalue and the sites detected by the
alternative models as positively selected are only considered by the user if the likelihood ratio test (LRT) is significant [24,25]. The
LRT is conducted by comparing the null models with the alternative models (M1avs.M2a and/or M7vs.M8). Both M2a and M8 have one additional class or category when compared to their null counterparts M1a and M7, respectively [24]. In case the LRT is significant in both tests, with the alternative models as fitting the data better, then it is possible to assume stronger evidence for the presence of sites under positive selection [25]. However, PAML is incapable of identifying negatively selected sites, in contrast to certain models implemented in the Datamon-key web-server [18,19]: Single-Likelihood Ancestor Counting (SLAC) [16], Fixed Effects Likelihood (FEL) [16], Random Effects Likelihood (REL) [16] and Fast Unconstrained Bayesian Ap-pRoximation (FUBAR) [29] methods. The recently proposed Mixed Effects Model of Evolution (MEME) [2] is a state-of-the-art method for detecting sites that evolve under episodic selection pressures, which are often difficult to identify using traditional site-specific methods. This method allows the distribution ofvto vary
not only across sites, but also from branch to branch at a site [2]. SLAC infers the number of non-synonymous and synonymous substitutions that have occurred at each site using Maximum Likelihood (ML) reconstructions of ancestral sequences, while FEL estimates the ratio of non-synonymous to synonymous substitu-tions, not assuming a priori distribution of rates across sites substitution, on a site-by-site basis. REL involves fitting a distribution of substitution rates across sites and then inferring the rate at which individual sites evolve based on ML estimates. FUBAR on the other hand, which supersedes SLAC, FEL and REL, infers the rate at which individual sites evolve based on an approximate hierarchical Bayesian approach using a Markov Chain Monte Carlo sampler.
selection, scored in every category, typically from 1 to 8. The assessment of biochemical and structural properties of the novel amino acids, introduced by non-synonymous substitutions, results in generation of numerous statistical files, especially when a large number of amino acid properties are evaluated. In order to detect sites that recurrently fall under the influence of natural selection or to detect sites with a defined number of selected properties, the user has to assess an array of statistical files. Thus, the interpretation of the result files generated by TreeSAAP for downstream analyses can be an extremely time-consuming process.
Manually noting down log-likelihood (lnL) values, various maximum-likelihood parameter estimates andvvalues from the
result files of Codeml for every model analyzed is also tedious. These values are essential for conducting likelihood-ratio tests and the identification of the appropriate regime of selection (for additional information regarding models and LRT tests, see [24]). This process is required to be repeated for each dataset being analyzed. Similarly, tables generated by the Datamonkey web-server, which contain various site statistics, are required to be manually downloaded and processed to retrieve sites detected as positively and negatively selected at the desired significance level. It has been suggested that the application of all the major selection assessment methods in HyPhy [20] (SLAC, FEL, REL,
FUBAR and MEME), followed by the consensual identification of sites detected as positively selected among the methods, can minimize false positives, especially when analyzing smaller datasets [16]. This feature is indeed available on the Datamonkey web-server. However, the results of these analyses can only be integrated manually with the results of Codeml and TreeSAAP selection assessments and the compilation of the sites detected in common by these approaches becomes a difficult task. Moreover, to our knowledge, there is no software to export these results for the downstream analyses, such as the mapping of the detected mutational sites onto the 3D structures of proteins.
Therefore, IMPACT_S has been designed to be a single platform, with which the user can employ various state-of-the-art selection assessments and identify the regime of natural selection on protein-coding genes. Furthermore, these sites could be automatically mapped onto the alignment and 3D structure (either in a homology model or a known crystallographic structure of the protein), making the entire process extremely rapid and efficient, even when a large number of datasets are analyzed.
IMPACT_S Structure
IMPACT_S implements four main tabs: (i) ‘PAML’, (ii) ‘Datamonkey’, (iii) ‘TreeSAAP’ and (iv) ‘Results & 3D’. The first three tabs enable the user to import the corresponding result files Figure 1. PAML tab and related results.(A) The‘PAML’ tab from IMPACT_S showing the results of the LRT test (M7vs.M8), (B) Automatically
extracted and tabulated ‘BEB results’ table, (C) Mapping of the positively selected sites onto the 3D protein-structure of CRiSPs (2GIZ-A), (D) Tabulated results ofvestimation under the site-specific models (M0, M1, M3, M7 and M8) and (E) The ‘lnL’ table, showing all the log-likelihood values for these models.
and automatically extract the sites detected as positively and negatively selected. IMPACT_S has been designed to organize these results in Comma Separated Values (CSV) format, which can be viewed and exported with the built-in CSV Viewer tool. Sites detected as positively and negatively selected by various selection assessment methods can be mapped individually for each method, or mapped in combination, as common sites, onto the 3D structure of proteins under the ‘Results and 3D’ tab. To map sites from two or more methods (considering the type of selection) in conjunction, as common sites, these must be firstly merged into a final Merged Results (MR) table. IMPACT_S provides several mapping schemes (please refer to Table 4 in the tutorial included in the package, for a list of all the available schemes and descriptions), which are applied to the results and presented using the molecular visualization software, Jmol [33] (http://jmol. sourceforge.net/). The 3D structure can be obtained through homology modeling using the built-in Protein Modeler tool that acts as an interface to the Swiss-Model web-server [21–23] (http://swissmodel.expasy.org). Alternatively, these sites can be mapped onto the experimentally deduced crystal structures by importing PDB files from RCSB Protein Data Bank (RCSB PDB) [35,36] (http://www.pdb.org) or the Swiss-Model Template Library (SMTL or ExPDB) [21–23] into IMPACT_S. Sites can also be marked onto the two-dimensional (2D) codon or protein sequence alignment using the built-in Alignment Filter tool. This
useful feature enables the assessment of the influence of domain-specific accumulation of mutations and helps to generate publication quality figures (Figure 10 in [3]). This tool is available in every tab of IMPACT_S, except in the TreeSAAP Evpthwy, where the user can find the built-in Gnuplot (http://www.gnuplot. info/) Options tool, which is specifically designed to plot graphs for the sliding window analysis using any amino acid property file. IMPACT_S also incorporates phylogenetic resources such as PhyML [37] and Archaeopteryx (http://www.phylosoft.org/ archaeopteryx), the successor of ATV [38], and other built-in tools that deal with Multiple Sequence Alignment (MSA) and CSV files [39]. Throughout the process of dataset analyses the user may have different requirements and hence employ these tools to perform any alignment and/or phylogenetic tree alterations, as well as the generation of new phylogenetic trees, which are required for PAML and TreeSAAP and optional in Datamonkey analyses.
IMPACT_S Development
The IMPACT_S program was implemented in Java and has been tested on Linux, Windows and MacOS workstations. Java SwingWorker threads (from Java version 1.6.0) are used to run the entire integrated software, handle outputs and to allow GUI updates. Even though it is possible to process and filter PAML results using BioPerl libraries, it is a difficult task for users with no Figure 2. Datamonkey tab and related results.(A) ‘Datamonkey’ tab showing all the selected options, (B) ‘Common Sites’ table generated from the positive-selection analyses under various methods (SLAC, FEL, REL, MEME and FUBAR) – The sites 110, 172, 202 and 231 (highlighted in pink), were simultaneously detected by Datamonkey, PAML (Codeml) and TreeSAAP as positively-selected (Table S1) [1], (C) ‘Results & 3D’ tab showing the mapping of sites found in the ‘Common Sites’ table.
doi:10.1371/journal.pone.0096243.g002
programming skills. Several tools found in IMPACT_S were improved from our previously developed software IMPACT [39], which include the MSA Editor/Viewer, the MSA Format Converter and the CSV Viewer. IMPACT_S uses the Internet to connect to the Swiss-Model [21–23] and RCSB PDB [35,36] (http://www.pdb.org/) web-servers. The functionalities related to these web-servers are found in two distinct built-in tools, the Protein Modeler tool which implements Swiss Model functional-ities and the PDB Downloader tool which includes the RSCB PDB and the SMTL.
IMPACT_S Availability and Requirements
IMPACT_S software was developed in Java with the platform-independent context in mind, providing the use of the software by a wider audience of users. The source code can be used by anyone with skills to manipulate and extend the program capabilities, or
even used in other projects. It is an open source software distributed under GNU General Public License version 3.0 (GPLv3) and is freely available with an example dataset, a detailed tutorial and manual, to allow its user-friendly application, at http://impact-s.sourceforge.net. IMPACT_S is an integrated platform, enabling users to access results and knowledge from any stage of the user controlled workflow [40]. Being an integrated platform, users are not required to install independent programs, since they are already provided in the download package, but are allowed to replace (or include) the existing binaries. IMPACT_S requires the following:
Operating System: Linux/UNIX, Windows or MacOS; Programming Language: Java;
Optional Programs Included: Codeml (PAML), TreeSAAP, PhyML, Archaeopteryx, Jmol and Gnuplot;
Other Requirements: Java version (minimum) 1.6.0.
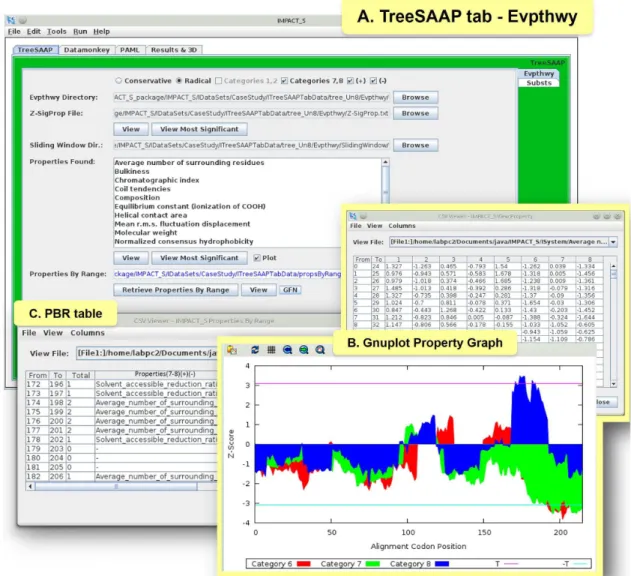
Figure 3. Evolutionary Pathway (Evpthwy) tab under TreeSAAP tab and related results.(A) ‘TreeSAAP’ tab showing the ‘Evpthwy’ tab with results of the CRiSP case study, (B) Gnuplot graph for the property ‘‘Average number of surrounding residues’’ with Z-scores in y-axis and Codon positions in x-axis, (C) ‘PBR’ table showing all ranges (‘From’ - ‘To’) retrieved from the sliding window analysis with the ‘Total’ count of properties for each range and their names [Properties (7–8) (+) (2) – names of properties under significant positive (Z-score$3.09) and negative (Z-score#3.09) selection, found in the categories 7 and 8].
Results
CRiSPs belong to a class of glycoproteins exclusive to vertebrates and have been implicated in a broad range of functions. Previously, we have demonstrated that toxicoferan-reptilian CRiSPs are significantly influenced by positive selection, and in snakes more than Anguimorpha and helodermatid lizards, while their mammalian homologues exhibit extreme coding sequence conservation (Table S1) [11]. By using a toxicoferan-reptilian CRiSPs dataset we demonstrate the applications of IMPACT_S and its useful designs and features. It should be noted that we have used the same dataset only to present all the tabs and associated methods. Nonetheless, in a real evolutionary study the researcher must choose the method that best fits the dataset.
Site-specific analyses were executed under the ‘PAML’ tab (Figure 1A) of IMPACT_S, and the value of v was estimated
using the following pairs of models: i) M0 and M3; ii) M1a and M2a and iii) M7 and M8. IMPACT_S was then used to automatically extract all the relevant information from the generated result files, such as a table of v, the ML parameter
estimates associated with each model (Figure 1D) andlnLtable for every model containing the corresponding number of parameters (np) (Figure 1E). The LRT was conducted in IMPACT_S to compare alternate models that allow v.1 (M3, M2a and M8)
with their null models that do not (M0, M1a and M7). The user can select from three significance thresholds, namely:p= 0.05 (by default selected),p= 0.01 andp= 0.001. The degrees of freedom (df) are calculated and may differ according to the pair of models selected due to the differentnp. For example, if the pairs (M1avs. M2a) or (M7vs.M8) are selected thedfis 2. The (M0vs.M3) pair is an exception, for which thedfis 4. The sites detected as evolving under positive selection according to the BEB [25] approach (Figure 1B) were then extracted using IMPACT_S and automat-ically mapped onto the 3D structure of CRiSPs (PDB: 2GIZ-A; Figure 1C).
All the models implemented in the Datamonkey web-server (SLAC, FEL, REL, MEME and FUBAR) were executed and the corresponding results were processed under the ‘Datamonkey’ tab of IMPACT_S (Figure 2A). Using the default significance cut-off, the results of positive and negative selection analyses were tabulated automatically for each method. The default significance cut-offs used in IMPACT_S are the same as on the Datamonkey web-server: p= 0.1 for SLAC, FEL and MEME; posterior probability = 0.9 for FUBAR and Bayes Factor = 50 for REL. The significance given by default can be changed by selecting from the available options or by typing the desired value. The positively selected sites detected using the default significance under these methods were tabulated, combined (Figure 2B: ‘Common Sites’ Figure 4. Substitutions (Substs) tab under TreeSAAP tab and related results.(A) ‘TreeSAAP’ tab showing the ‘Substs’ tab and the results of the CRiSPs case study, (B) ‘PBS’ table showing all the significant codons (‘Codon’ column) and the total count (‘Total’ column) of properties for each codon and their respective names [‘Properties (7–8) (+)’ – names of properties under significant (Z-score$3.09) positive selection], (C) ‘PBS statistics’, with respect to the PBS table, showing the number of times (‘Total’ column) that the same property (‘Information’ column) is selected across the data set provided and (D) Alignment Filter option with the final view of the alignment containing only the codons from the PBS table with their original positions.
doi:10.1371/journal.pone.0096243.g004
table) and then mapped onto the 3D structure of the protein (Figure 2C) in IMPACT_S.
Furthermore, we conducted a protein-level analyses under the ‘TreeSAAP’ tab to measure the influence of selection on 31 biochemical properties. Here, the data was processed from the ‘Evpthwy’ tab for the sliding window analyses and from the ‘Substs’ tab for mapping the substitutions on the 3D structure of the protein. In the Evpthwy directory under ‘TreeSAAP’ tab (Figure 3A), the ‘Properties By Range (PBR)’ table was generated (Figure 3B), which consists of the most significant properties under categories 7 and 8 (most radical changes). A graph was then plotted using the Gnuplot Options dedicated tool for each significant property (Figure 3C). The ‘Substs’ tab (Figure 4A) was used to generate the ‘Properties By Site (PBS)’ table (Figure 4B) that consists of all the significant codons under categories 7 and 8. This tab provides the statistical files (Figure 4C) for counting properties. Using the ‘Alignment Filter’ tool, the sites reported in the PBS table as positively selected were highlighted in a new alignment view that keeps only these sites and their original positions in the provided alignment (Figure 4D). The information regarding the radical physicochemical amino acid changes varying
across the reptilian-CRiSPs phylogenetic tree can also be obtained under this tab (Table S2).
In order to identify sites that were detected in common as positively selected by the aforementioned analyses (PAML, Datamonkey and TreeSAAP), their resultant files were combined in IMPACT_S under the ‘Results & 3D’ tab (Figure 5A) as the MR table (Figure 5B; Table S3). The evolution of such sites are most likely to be influenced by natural selection, since they are detected in common by a diversity of selection assessment methodologies. Such sites are then automatically mapped onto the 3D structure (2GIZ-A; Figure 5C) using the ‘Merged Results’ Color Scheme option (Figure 5D).
Conclusion
freedom to choose different available methods, which should follow the respective authors’ recommendations from programs integrated in this GUI. If properly used, this software will automatically map the positively and negatively selected sites onto the sequence alignment as well as the 3D protein structure. This enables the user to infer which sites are important, according to their specific location and significance for all types of selection. IMPACT_S is a new integrated multiprogram platform, which allows the user to combine the results from different bioinformatic programs. Merging PAML or Datamonkey with TreeSAAP may provide additional information about amino acid properties, such as hydrophobicity, at the sites identified by the aforementioned codon methods. Overall, amino acid properties can provide crucial information that can be extremely relevant in protein-protein interactions [41] and thus a change in this biochemical property can compromise the folding of the protein interfering in its stability and function.
Supporting Information
Table S1 Amino-acid sites under positive selection in toxicofera-reptilian CRiSPs.
(DOCX)
Table S2 IMPACT_S count of the positively-selected properties
varying across the toxicofera-reptilian CRiSPs phylogenetic tree. (DOCX)
Table S3 Merged results from the IMPACT_S integrative approach for the analyses of toxicofera-reptilian CRiSPs. (DOCX)
Acknowledgments
We would like to thank Rui Borges, Cida´lia Gomes and Imran Khan for their helpful discussions and support. We also thank Joa˜o Paulo Machado, Joana Pereira, Anoop Alex, Siby Philip and Susana Pereira for their useful suggestions. We are indebted to Dr. Sergei L. Kosakovsky Pond from the University of California, San Diego for his assistance with the use of Datamonkey. We are thankful to the Academic Editor Konrad Scheffler and to the two anonymous reviewers for their valuable comments and suggestions, which led to the improvement of the manuscript.
Author Contributions
Conceived and designed the experiments: EM KS DA AA. Performed the experiments: EM. Analyzed the data: EM KS DA AA. Contributed reagents/materials/analysis tools: VV AA. Wrote the paper: EM KS DA AA.
References
1. Yang Z, Nielsen R, Goldman N, Pedersen AM (2000) Codon-substitution models for heterogeneous selection pressure at amino acid sites. Genetics 155(1): 431–449.
2. Murrell B, Wertheim JO, Moola S, Weighill T, Scheffler K, et al. (2012) Detecting individual sites subject to episodic diversifying selection. PLoS Genet 8(7): e1002764. doi:10.1371/journal.pgen.1002764.
3. da Fonseca RR, Johnson WE, O’Brien SJ, Ramos MJ, Antunes A (2008) The adaptive evolution of the mammalian mitochondrial genome. BMC Genomics 9: 119. doi:10.1186/1471-2164-9-119.
4. Sunagar K, Jackson TN, Undheim EA, Ali SA, Antunes A, et al. (2013) Three-Fingered RAVERs: Rapid Accumulation of Variations in Exposed Residues of Snake Venom Toxins. Toxins 5(11): 2172–2208. doi:10.3390/toxins5112172. 5. Brust A, Sunagar K, Undheim E, Vetter I, Yang D, et al (2013) Differential
evolution and neofunctionalization of snake venom metalloprotease domains. Mol Cell Proteomics 12(3): 651–663. doi:10.1074/mcp.A112.023135. 6. Kini RM, Chan YM (1999) Accelerated evolution and molecular surface of
venom phospholipase A2 enzymes. J Mol Evol 48(2): 125–132.
7. Kozminsky-Atias A, Zilberberg N (2012) Molding the business end of neurotoxins by diversifying evolution. FASEB J 26(2): 576–586. doi:10.1096/ fj.11-187179.
8. Low DH, Sunagar K, Undheim EA, Ali SA, Alagon AC, et al. (2013) Dracula’s children: molecular evolution of vampire bat venom. J Proteomics 89: 95–111. doi:10.1016/j.jprot.2013.05.034.
9. Ruder T, Sunagar K, Undheim EA, Ali SA, Wai TC, et al. (2013) Molecular phylogeny and evolution of the proteins encoded by coleoid (cuttlefish, octopus, and squid) posterior venom glands. J Mol Evol 76(4): 192–204. doi:10.1007/ s00239-013-9552-5.
10. Sunagar K, Fry BG, Jackson T, Casewell NR, Undheim EAB, et al. (2013) Molecular evolution of vertebrate neurotrophins: Co-option of the highly conserved nerve growth factor gene into the advanced snake venom arsenal. PloS ONE 8(11): e81827. doi:10.1371/journal.pone.0081827.
11. Sunagar K, Johnson WE, O’Brien SJ, Vasconcelos V, Antunes A (2012) Evolution of CRISPs associated with toxicoferan-reptilian venom and mammalian reproduction. Mol Biol Evol 29(7): 1807–1822. doi:10.1093/ molbev/mss058.
12. Tian C, Yuan Y, Zhu S (2008) Positively selected sites of scorpion depressant toxins: possible roles in toxin functional divergence. Toxicon 51(4): 555–562. doi:10.1016/j.toxicon.2007.11.010.
13. Zhu S, Bosmans F, Tytgat J (2004) Adaptive evolution of scorpion sodium channel toxins. J Mol Evol 58(2): 145–153. doi:10.1007/s00239-003-2534-2. 14. Antunes A, Ramos MJ (2007) Gathering computational genomics and
proteomics to unravel adaptive evolution. Evol Bioinform Online 3: 207–209. 15. Woolley S, Johnson J, Smith MJ, Crandall KA, McClellan DA (2003)
TreeSAAP: selection on amino acid properties using phylogenetic trees. Bioinform 19(5): 671–672. doi:10.1093/bioinformatics/btg043.
16. Pond SL, Frost SD (2005) Not so different after all: a comparison of methods for detecting amino acid sites under selection. Mol Biol Evol 22(5): 1208–1222. doi:10.1093/molbev/msi105.
17. Yang Z (2007) PAML 4: Phylogenetic analysis by maximum likelihood. Mol Biol Evol 24(8): 1586–1591. doi:10.1093/molbev/msm088.
18. Delport W, Poon AF, Frost SD, Pond SL (2010) Datamonkey 2010: a suite of phylogenetic analysis tools for evolutionary biology. Bioinform 26(19): 2455– 2457. doi:10.1093/bioinformatics/btq429.
19. Pond SL, Frost SD (2005) Datamonkey: rapid detection of selective pressure on individual sites of codon alignments. Bioinform 21(10): 2531–2533. doi:10.1093/ bioinformatics/bti320.
20. Pond SL, Frost SD, Muse SV (2005) HyPhy: hypothesis testing using phylogenies. Bioinform 21(5): 676–679. doi:10.1093/bioinformatics/bti079. 21. Schwede T, Kopp J, Guex N, Peitsch MC (2003) SWISS-MODEL: an
automated protein homology-modeling server. Nucl Acids Res 31(13): 3381– 3385. doi:10.1093/nar/gkg520.
22. Arnold K, Bordoli L, Kopp J, Schwede T (2006) The SWISS-MODEL workspace: a web-based environment for protein structure homology modelling. Bioinform 22(2): 195–201. doi:10.1093/bioinformatics/bti770.
23. Bordoli L, Kiefer F, Arnold K, Benkert P, Battey J, et al. (2009) Protein structure homology modeling using SWISS-MODEL workspace. Nat Prot 4, 1–13. doi:10.1038/nprot.2008.197.
24. Wong WS, Yang Z, Goldman N, Nielsen R (2004) Accuracy and power of statistical methods for detecting adaptive evolution in protein coding sequences and for identifying positively selected sites. Genetics 168(2): 1041–1051. doi:10.1534/genetics.104.031153.
25. Yang Z, Wong WS, Nielsen R (2005) Bayes empirical bayes inference of amino acid sites under positive selection. Mol Biol Evol 22(4): 1107–1118. doi:10.1093/ molbev/msi097.
26. Yang Z (1998) Likelihood ratio tests for detecting positive selection and application to primate lysozyme evolution. Mol Biol Evol 15(5): 568–573. 27. Yang Z, Nielsen R (1998) Synonymous and nonsynonymous rate variation in
nuclear genes of mammals. J Mol Evol 46(4): 409–418.
28. Zhang J, Nielsen R, Yang Z (2005) Evaluation of an improved branch-site likelihood method for detecting positive selection at the molecular level. Mol Biol Evol 22(12): 2472–2479. doi:10.1093/molbev/msi237.
29. Murrell B, Moola S, Mabona A, Weighill T, Sheward D, et al. (2013) FUBAR: a fast, unconstrained bayesian approximation for inferring selection. Mol Biol Evol 30(5): 1196–1205. doi:10.1093/molbev/mst030.
30. Yang Z (1997) PAML: a program package for phylogenetic analysis by maximum likelihood. Computer applications in the biosciences: CABIOS 13(5): 555–556.
31. McClellan DA, McCracken KG (2001) Estimating the influence of selection on the variable amino acid sites for the cytochrome b protein functional domains. Mol Biol Evol 18(6): 917–925.
32. McClellan DA, Palfreyman EJ, Smith MJ, Moss JL, Christensen RG, et al. (2005) Physicochemical evolution and molecular adaptation of the cetacean and artiodactyl cytochrome b proteins. Mol Biol Evol 22(3): 437–455. doi:10.1093/ molbev/msi028.
33. Herra´ez A (2006) Biomolecules in the computer: Jmol to the rescue. Biochem. Mol Biol Educ 4(4): 255–261. doi:10.1002/bmb.2006.494034042644. 34. Altschul SF, Madden TL, Schaffer AA, Zhang J, Zhang Z, et al. (1997) Gapped
BLAST and PSI-BLAST: a new generation of protein database search programs. Nucl Acids Res 25(17): 3389–3402.
35. Rose PW, Beran B, Bi C, Bluhm WF, Dimitropoulos D, et al. (2011) The RCSB Protein Data Bank: redesigned web site and web services. Nucl Acids Res 39 (suppl 1): D392-D401. doi:10.1093/nar/gkq1021.
36. Rose PW, Bluhm WF, Beran B, Bi C, Dimitropoulos D, et al. (2011) The RCSB Protein Data Bank: site functionality and bioinformatics use cases. NCI-Nat Path Interac Datab. doi:10.1038/pid.2011.1.
37. Guindon S, Gascuel O (2003) A simple, fast, and accurate algorithm to estimate large phylogenies by maximum likelihood. Syst Biol 52(5): 696–704. doi:10.1080/10635150390235520.
38. Zmaseck CM, Eddy SR (2001) ATV: display and manipulation of annotated phylogenetic trees. Bioinform 17(4): 383–384. doi:10.1093/bioinformatics/ 17.4.383.
39. Maldonado E, Dutheil JY, da Fonseca RR, Vasconcelos V, Antunes A (2011) IMPACT: integrated multiprogram platform for analyses in ConTest. J Hered 102(3): 366–369. doi:10.1093/jhered/esr003.
40. Gosh S, Matsuoka Y, Asai Y, Hsin K, Kitano H (2012) Software for systems biology: from tools to integrated platforms. Nat Rev Genet 12(12): 821–832. doi:10.1038/nrg3096.