www.j-sens-sens-syst.net/5/301/2016/ doi:10.5194/jsss-5-301-2016
© Author(s) 2016. CC Attribution 3.0 License.
Comparing mobile and static assessment of biomass in
heterogeneous grassland with a multi-sensor system
Hanieh Safari, Thomas Fricke, Björn Reddersen, Thomas Möckel, and Michael Wachendorf
Department of Grassland Science and Renewable Plant Resources, University of Kassel, Steinstraße 19, 37213 Witzenhausen, Germany
Correspondence to:Hanieh Safari ([email protected]) and Michael Wachendorf ([email protected])
Received: 18 May 2016 – Revised: 13 July 2016 – Accepted: 16 July 2016 – Published: 2 August 2016
Abstract. The present study aimed to test a mobile device equipped with ultrasonic and spectral sensors for the assessment of biomass from diverse pastures and to compare its prediction accuracy to that from static measure-ments. Prediction of biomass by mobile application of sensors explained >63 % of the variation in manually determined reference plots representing the biomass range of each paddock. Accuracy of biomass prediction improved with increasing grazing intensity. A slight overestimation of the true values was observed at low levels of biomass, whereas an underestimation occurred at high values, irrespective of stocking rate and years. Predic-tion accuracy with a mobile applicaPredic-tion of sensors was always lower than when sensors were applied statically. Differences between mobile and static measurements may be caused by position errors, which accounted for 8.5 cm on average. Beside GPS errors (±1–2 cm horizontal accuracy and twice that vertically), position inac-curacy predominantly originated from undirected vehicle movements due to heaps and hollows on the ground surface. However, the mobile sensor system in connection with biomass prediction models may provide accept-able prediction accuracies for practical application, such as mapping. The findings also show the limits even sophisticated sensor combinations have in the assessment of biomass of extremely heterogeneous grasslands, which is typical for very leniently stocked pastures. Thus, further research is needed to develop improved sensor systems for supporting practical grassland farming.
1 Introduction
Pasture biomass and its quality are a matter of primary con-cern in continuous grazing systems (Silvia Cid et al., 1998; Kristensen et al., 2005; Oudshoorn et al., 2013). On-site and on-time information on biomass and its spatial distribution in pastures is needed for site-specific pasture management and can help livestock managers in making critical decisions in terms of planning grazing time, grazing period, grazing in-terval, stocking rate and inputs such as fertilizers (Suzuki et al., 2012). However, conventional plant sampling tech-niques are costly, destructive and time-consuming, thereby limiting the number of measured samples and being imprac-tical for characterizing spatial variability in sward character-istics within fields (Fava et al., 2009). In contrast, real-time mobile sensors, which allow the collection of geographically referenced data, have proven to be useful for in-field mon-itoring of vegetation characteristics with high spatial
for a rapid and accurate in-field biomass estimation. Dif-ferent types of sensors both in static and mobile applica-tion have been used in recent grassland studies (Numata et al., 2008; Biewer et al., 2009a, b; Himstedt et al., 2009; Kawamura et al., 2009; Fricke et al., 2011; Pullanagari et al., 2012; Duan et al., 2014; Rahman et al., 2014; Reddersen et al., 2014). Particularly hyperspectral sensors, which mea-sure reflectance signals over a wide range of wavelengths in discrete bands of 1–15 nm width, have raised considerable interest for the prediction of biomass and quality parame-ters. However, pastures are highly heterogeneous ecosystems due to variations in canopy architecture, botanical compo-sition and phenological stage of plants. Hence, the appli-cation of sensors in grazed pastures is more difficult than in cut grassland, and there are limitations for each specific sensor technique used for the prediction of sward charac-teristics (Schellberg et al., 2008; Pullanagari et al., 2012). An effective method for in-field estimation of biomass must reach an accuracy comparable to the accepted standard of de-structive procedure (clipping and weighing) (Pittman et al., 2015). Using a data combination of conceptually different sensing methods holds promise for providing more accurate property estimates (Adamchuk et al., 2004). A sensor fusion approach has been proposed that combines measured sward height with an ultrasonic distance sensor and vegetation in-dices (VIs) derived from spectral-radiometric reflections to estimate biomass in grasslands with acceptable prediction accuracies (Fricke and Wachendorf, 2013; Reddersen et al., 2014; Safari et al., 2015). The guiding idea in this approach is that canopy reflectance provides complementary informa-tion to canopy height sensing when estimating biomass. In all studies best prediction accuracies were achieved by a combi-nation of ultrasonic sward height (USH) and sward-specific band selection using the normalized spectral vegetation in-dex (NDSI, which uses two spectral bands best suited for estimating biomass according to normalized difference veg-etation index (NDVI) formula) with R2 values of 0.63 to 0.90. The selection of two narrow or broad bands from hy-perspectral data has an advantage for practical implementa-tion at field scale, as multispectral measurements are less ex-pensive than hyperspectral ones. Likewise, ultrasonic sensors are simple and cost-effective equipment but nevertheless may provide accurate and real-time information needed by farm-ers to make on-farm decisions. However, no knowledge ex-ists on how accurately such sensors work when applied on mobile devices and which position accuracy can be achieved under real field conditions.
The overall aim of the present study was to develop and test a mobile sensor system equipped with ultrasonic and spectral sensors and a high-precision GPS to assess data in experimental pastures with a large variation of spatial and phenological structures. The following specific research questions were addressed in this study: (i) which overall prediction accuracy for grassland biomass can be achieved? (ii) Is there a reduction in prediction accuracy between static
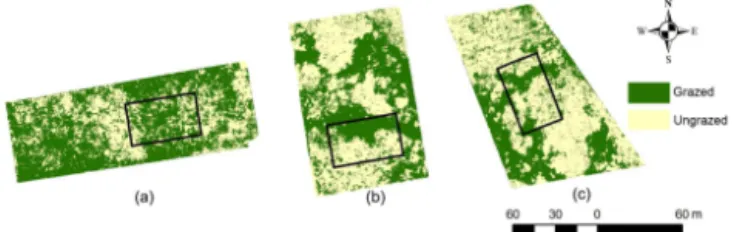
Figure 1.Images with digitally classified grazed and ungrazed ar-eas in grassland paddocks of different stocking rate:(a)moderate, (b)lenient and(c)very lenient. Black boxes indicate the location of 30×50 m study plots. Photos were taken in April 2013.
and mobile application of sensors? (iii) Does the perfor-mance of the sensor system depend on the grazing intensity? (iv) What are possible position errors associated with mobile sensor measurements?
2 Material and methods
2.1 Experimental site and setup
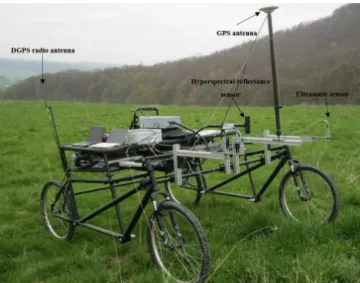
Figure 2.Remotely steered sensor vehicle with hyperspectral re-flectance, ultrasonic sensors and mounted GPS antenna.
2.2 Mobile measurements on the study plots
The multi-sensor system consisted of ultrasonic distance and hyperspectral reflectance sensors. The ultrasonic sen-sor holds a one-headed system (Pepperl and Fuchs, type UC 2000-30GM-IUR2-V15) operating with a transducer fre-quency of 180 Hz (Pepperl and Fuchs, 2010). Distances were measured in a range from 80 to 2000 mm within a sound cone formed by an opening angle of about 25◦. Ultrasonic sward height (mm) was calculated by subtracting the ultra-sonic distance measurement value in millimeters from the sensor mount height using Eq. (1):
USH (cm)=mount height (cm) (1)
−ultrasonic distance (cm).
A HandySpec Field portable spectrometer (tec5 AG, Oberursel, Germany) was used to measure canopy spectral reflectance. The measuring head of the device had two chan-nels measuring incoming and reflected radiation simulta-neously between 305 and 1700 nm in 1 nm steps. Spectral calibrations were performed using a grey standard (Zenith Polymer®Diffuse Reflectance Standard 25 %) at fixed inter-vals. Both sensor systems provided the same opening angle with a field of view (FOV) of 25◦. While the spectral sensor measures an integrated value of reflection intensity within the measurement cone, the ultrasonic sensor measure the highest object, creating a reliable reflection within the sound cone.
Mobile measurements were conducted using an electri-cally driven cycle-based four-wheel-vehicle with a track gauge of 180 cm (Fig. 2). Both sensors were mounted at the front-end center of the vehicle on a frame, allowing measure-ments along the central track during the vehicle movemeasure-ments. Two more ultrasonic sensors were mounted with 60 cm dis-tance on either side of the central sensor to allow a higher measurement density for future mapping activities. GPS
po-sitions of all sensor readings were acquired in 0.1 s intervals using a Leica SR530 dual-frequency geodetic RTK receiver. A GPS AT 502 dual-frequency antenna was mounted on top of a pole close to the sensors. Its geometric position in rela-tion to both the ground and the sensors was recorded and con-sidered in subsequent sensor position calculations including a correction of topographically induced antenna pole skew-ness. The DGPS correction signals were received from an on-field reference station at a maximum distance of 500 m by a radio modem. Both the reference station and rover were equipped with components of identical technical specifica-tions, providing a horizontal positional accuracy of 1–2 and 2–3 cm vertical accuracy. For mobile measurements the vehi-cle was remotely steered along 50 m longitudinal lanes in the study plots at a speed of approximately 0.1–0.3 m s−1.
Ultra-sonic measurements were triggered at a 0.3 s interval, result-ing in a measured point distance of 10±6 cm (mean of all plots). Spectral reflections were continuously assessed; how-ever with a variable data integration time of the spectrometer between 1 and 5 s, measurements were logged discontinu-ously, corresponding to a measured distance of 43±20 cm between spectral measurement points in each plot (mean of all plots).
2.3 Static measurements on reference plots
Subsequent to the mobile measurement, 18 reference plots (each 50×50 cm) were established within each of the three study plots by positioning them along the central axis be-tween the vehicle tracks to represent the occurring range of available biomass levels and sward structures. Static sensor measurements were conducted on these reference plots using the same sensors as in the mobile measurement and follow-ing the methodology as described by Fricke et al. (2011). The total aboveground biomass from each reference plot was clipped at ground surface level after sensor measurements were taken. In the present study grassland biomass is ex-pressed as the amount of fresh matter (FM) in grams per square meter (g m−2). To avoid repeated sampling at the same position across time, the location of reference plots was determined using DGPS.
2.4 Data integration and analysis
Spectral calibration models were developed for each year separately in order to reach the maximum prediction accu-racy using biomass data from reference plots. In an attempt to create prediction models with maximum accuracy by us-ing the depth of information of hyperspectral data, narrow-band NDSIs according to Inoue et al. (2008) were applied over the range of 1nm spectral bandwidths using all possible combinations of two-band reflectance ratios based on NDVI formula according to Eq. (2):
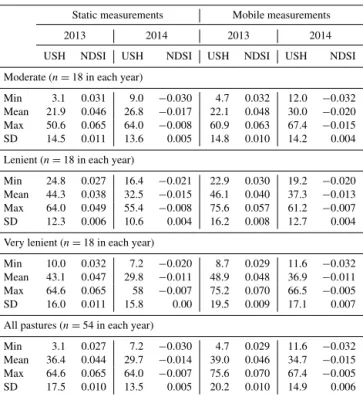
Table 1. Summary statistics of static and mobile measurements of ultrasonic sward height (USH) (cm) and normalized difference spectral index (NDSI) on reference plots of pastures with different stocking rates in 2013 and 2014.
Static measurements Mobile measurements
2013 2014 2013 2014
USH NDSI USH NDSI USH NDSI USH NDSI
Moderate (n=18 in each year)
Min 3.1 0.031 9.0 −0.030 4.7 0.032 12.0 −0.032 Mean 21.9 0.046 26.8 −0.017 22.1 0.048 30.0 −0.020 Max 50.6 0.065 64.0 −0.008 60.9 0.063 67.4 −0.015 SD 14.5 0.011 13.6 0.005 14.8 0.010 14.2 0.004
Lenient (n=18 in each year)
Min 24.8 0.027 16.4 −0.021 22.9 0.030 19.2 −0.020 Mean 44.3 0.038 32.5 −0.015 46.1 0.040 37.3 −0.013 Max 64.0 0.049 55.4 −0.008 75.6 0.057 61.2 −0.007 SD 12.3 0.006 10.6 0.004 16.2 0.008 12.7 0.004
Very lenient (n=18 in each year)
Min 10.0 0.032 7.2 −0.020 8.7 0.029 11.6 −0.032 Mean 43.1 0.047 29.8 −0.011 48.9 0.048 36.9 −0.011 Max 64.6 0.065 58 −0.007 75.2 0.070 66.5 −0.005 SD 16.0 0.011 15.8 0.00 19.5 0.009 17.1 0.007
All pastures (n=54 in each year)
Min 3.1 0.027 7.2 −0.030 4.7 0.029 11.6 −0.032 Mean 36.4 0.044 29.7 −0.014 39.0 0.046 34.7 −0.015 Max 64.6 0.065 64.0 −0.007 75.6 0.070 67.4 −0.005 SD 17.5 0.010 13.5 0.005 20.2 0.010 14.9 0.006
where b1 andb2 are specific narrowband (1 nm) reflection signals with wavelengthb1>wavelengthb2.
All possible two-pair 1 nm band combinations in the hyperspectral range from 360 to 1340 nm and 1500 to 1650 nm were tested. Ordinary least-squares regression anal-ysis (Ryan, 1997) was performed using a linear model proce-dure in R (version 3.0.2) (R Development Core Team, 2013) with biomass as the dependent variable and NDSI together with USH as independent variables including interactions and quadratic terms according to Eq. (3):
B=USH+NDSI+USH·NDSI+USH2+USH2 (3)
·NDSI+NDSI2+USH·NDSI2+USH2·NDSI2,
whereBis biomass (g FM m−2) and USH is in centimeters.
NDSI wavebands were considered adequate when R2of the model was maximum. According to the rules of hierarchy and marginality (Nelder, 1994) non-significant effects were excluded from the models but were retained if the same vari-able appeared as part of a significant interaction atαlevel of 5 %. Calibration models were validated by a fourfold cross-validation method (Diaconis and Efron, 1983).
2.5 Assessment of position accuracy
With the aim of establishing a plausibility control for position accuracy of mobile measurements, an additional experiment
was set up. Wooden planks of known position and dimension at each end of the vehicle tracks were measured in spring, before the vegetation started to grow. Thus, higher targets could be clearly distinguished from lower swards. Vehicle measurement were conducted in the same mode as described above. Here, only USH data were used due to their high point density. Measured values were compared to expected values and classified as error if a discrepancy was observed. The distance of an erroneous measurement to the closest apparent target edge (considering target dimensions and sensor prop-erties) was assigned to the respective measurement and used for subsequent spatial analysis. Further information on the methodology is provided in the Appendix.
3 Results and discussion
3.1 Relationship between static and mobile sward measurements for use of exclusive sensors
Statically measured USH ranged from 3.1 to 64.6 cm and from 7.2 to 64.0 cm in 2013 and 2014, respectively (Table 1). Compared to static measurements higher values of USH were found by mobile application ranging from 4.7 to 75.6 cm and from 11.6 to 67.4 cm in 2013 and 2014, respectively. This may be the effect of a crossbar which was attached to the rear of the vehicle at a height of about 50 cm for stabilizing purposes and may have compressed higher vegetation during vehicle passage, and subsequent static measurements were possibly influenced by that. Pastures with a moderate stock-ing rate exhibited lower USH values (mean value=21.9 and 26.8 cm in 2013 and 2014, respectively) compared to pas-tures with a lenient stocking rate (mean value=44.3 and 32.5 cm in 2013 and 2014, respectively) and very lenient stocking rate (mean value=43.1 and 29.8 cm in 2013 and 2014, respectively). Swards of the latter two stocking rates showed similar USH levels in both years, although pastures were managed and monitored by the use of a compressed sward height meter (CSH; according Castle, 1976), main-taining levels at 6 cm (moderate), 12 cm (lenient) and 18 cm (very lenient) (Wrage et al., 2012). This disparity may in-dicate the influence of sward structure on the conducted measurement methods: while CSH reflects the resistance of biomass according to stem density and sward height (Hakl et al., 2012), USH predominantly detects protruding objects regardless of other sward conditions in subordinate layers (Fricke et al., 2011). This fact indicates the limitations of biomass predictions based on pure USH, as it may not di-rectly reflect the biomass, particularly if swards are com-posed by plants of varying phenology, which is common in leniently grazed swards (Rook and Tallowin, 2003; Wrage et al., 2011).
Figure 3.Relationship between mobile- and statically measured ultrasonic sward height (USH) (cm). Both measurements were conducted on reference plots in pastures differently stocked with animals in 2013 and 2014.
while negative values in 2014 corresponded to the descend-ing slope of the second water absorption band (at 1121 and 1133 nm). NDSI values by static measurement ranged from 0.027 to 0.065 with a mean value of 0.044 across all pastures in 2013, which were slightly lower than the values by mobile application (mean value=0.046). In 2014 a smaller range of NDSI values occurred by both static and mobile application (−0.030 to−0.007), resulting in a mean value of −0.014 (Table 1).
USH values from mobile measurements were in good agreement with static values, withR2≥0.85 for all pastures in both years (Fig. 3). This indicates that reliable and accu-rate USH information could be acquired by the mobile appli-cation of low-cost ultrasonic sensors. Moreover, it seems that the performance of the mobile application is not affected by the stocking rate, asR2values differed only randomly during the 2-year measurements on different pastures.
The relationship between NDSI values determined on the reference plots by mobile and static application was closer for moderate (R2=0.66–91) than for leniently and very le-niently grazed pastures (R2=0.59–0.72) (Fig. 4). This may be partly due to a higher proportion of senesced material in pastures at lower grazing intensities. This is supported by re-sults of Safari et al. (2015), which showed a lower accuracy of spectral calibrations for grassland biomass in the second half of the growing season, when senesced material likewise presented greater shares of the grassland canopy. Botanical diversity, which is well known to increase with reduced de-foliation intensity through grazing or cutting (Blüthgen et
al., 2012; Isselstein et al., 2005), may have further allevi-ated the relationship between grassland biomass and spectral characteristics. For the biomass of species-poor grasslands, spectral calibrations based on static measurements frequently achieved higher accuracies than for less intensively grazed swards (Biewer et al., 2009a; Reddersen et al., 2014). Com-pared to ultrasonic measurements, accuracy of spectral cali-brations was remarkably lower in both years and at all levels of grazing intensity. One reason may be the lower measure-ment point density of spectral (1.3 per plot on average) than ultrasonic recordings (5.0 per plot on average), which can be explained by the lower data integration time for the former technique. In pastures with high canopy variability (lenient and very lenient), where extremely short (intensively grazed) and tall (lightly grazed) patches are frequently located in the immediate vicinity of each other, a high measurement point density is of particular benefit. This may explain why in mod-erately grazed pastures the accuracy of NDSI is only 7 % lower than USH (averaged over both years), whereas under very leniently grazing the accuracy of NDSI is 24 % lower.
3.2 Relationship between static and mobile sward measurements for sensor combination
Figure 4.Relationship between mobile- and statically measured normalized difference spectral index (NDSI). Both measurements were conducted on reference plots in pastures differently stocked with animals in 2013 and 2014.
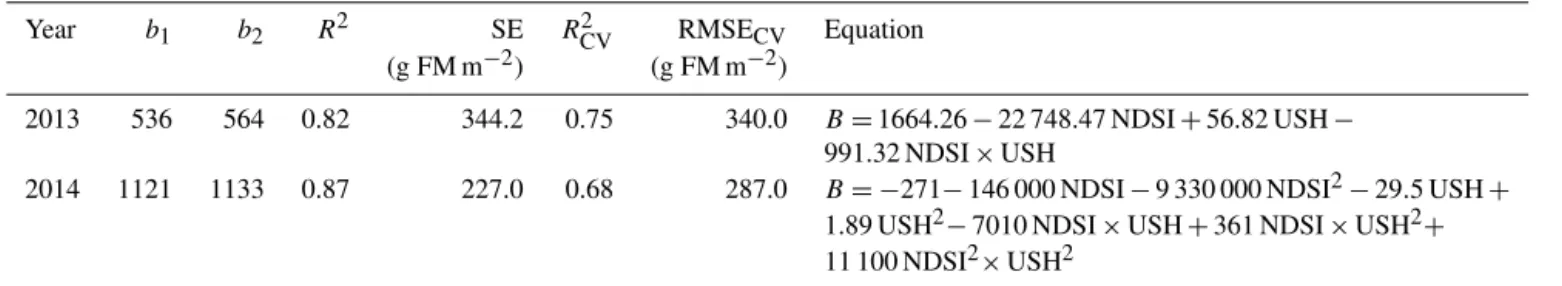
Table 2.Regression and cross-validation statistics of prediction models for biomass (B) (g FM m−2) from USH (cm) and narrowband NDSI during mobile application. Models were derived from static measurements on reference plots according Eqs. (1) and (2) (see above) (n=54).
Year b1 b2 R2 SE R2CV RMSECV Equation
(g FM m−2) (g FM m−2)
2013 536 564 0.82 344.2 0.75 340.0 B=1664.26−22 748.47 NDSI+56.82 USH− 991.32 NDSI×USH
2014 1121 1133 0.87 227.0 0.68 287.0 B= −271−146 000 NDSI−9 330 000 NDSI2−29.5 USH+ 1.89 USH2−7010 NDSI×USH+361 NDSI×USH2+ 11 100 NDSI2×USH2
b1,b2=spectral bands. SE=standard error. RMSECV=random mean square error of cross validation.
visible (2013) and near-infrared (NIR) (2014) regions of the spectrum. Several studies have indicated the importance of the visible–near-infrared range to create models for estimat-ing biomass usestimat-ing narrowband ratios (Numata et al., 2008; Psomas et al., 2011; Fricke and Wachendorf, 2013). The 536 and 564 nm bands from the visible region (2013) can be cor-related with chlorophyll content of vegetation (Psomas et al., 2011), while the 1121 and 1133 nm bands from NIR (2014) are related to plant leaf water content (Raymond, 1991).
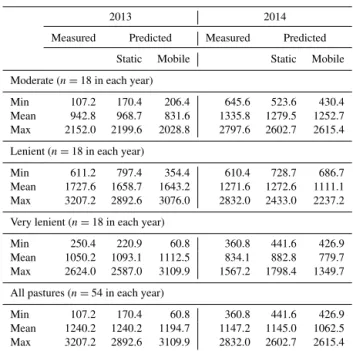
Biomass in the reference plots as measured by manual clipping and weighing ranged from 107.2 to 3207.2 and from 360.8 to 2832.0 g FM m−2in 2013 and 2014, respec-tively (Table 3). In 2013 the leniently stocked pasture showed the highest biomass (mean value=1727.6 g FM m−2)
com-pared to the other pastures, while in 2014 reference plots in moderate pasture had the highest biomass (mean value=1335.8 g FM m−2), followed by leniently grazed
pas-ture (mean value=1271.6 g FM m−2). While biomass
pre-dicted by static application differed only slightly (<1 %) from manual clipping (mean of all pastures), values predicted by mobile application were somewhat lower with 3.7 and 7.1 % in 2013 and 2014, respectively.
Biomass prediction by mobile sensors was significantly associated with static sensor predictions and reference data (Fig. 5). WithR2values of 0.77 and 0.84 for biomass of all pastures in 2013 and 2014, respectively, the relationship be-tween mobile and static predictions was quite close. Mobile prediction of biomass explained 63 and 76 % of the varia-tion in manually determined reference data of all pastures in 2013 and 2014, respectively. When looking more closely into the data, it becomes apparent that the accuracy of biomass prediction improved with increasing grazing intensity, with
re-Figure 5.Relationship between mobile- and statically measured biomass (g FM m−2; based on combined sensor data USH and NDSI) and values measured by clipping. All measurements were conducted on reference plots in pastures differently stocked with animals in 2013 and 2014.
spectively. Though sensor combinations proved a higher pre-diction accuracy for grassland yield and quality compared to exclusive ultrasonic or spectral sensors (Safari et al., 2015, 2016), the findings of the present study likewise show the limits even sensor combinations have in the mobile assess-ment of biomass of extremely heterogeneous grasslands.
Regression lines in Fig. 5, describing the relationship be-tween actual and mobile-predicted biomass, generally ex-hibit a slope <1, which indicates an overestimation of the true values at low levels of biomass and an underestimation at high values, irrespective of stocking rate and years. The reason for an overestimation at low levels of biomass may be that the sensor system was not capable of grasping extremely
high bulk densities accurately, which obviously occur when low swards exhibit high yields.
Table 3.Summary statistics of measured and predicted biomass (g FM m−2) based on predictions by static and mobile application for pastures with different stocking rates in 2013 and 2014.
2013 2014
Measured Predicted Measured Predicted
Static Mobile Static Mobile
Moderate (n=18 in each year)
Min 107.2 170.4 206.4 645.6 523.6 430.4 Mean 942.8 968.7 831.6 1335.8 1279.5 1252.7 Max 2152.0 2199.6 2028.8 2797.6 2602.7 2615.4
Lenient (n=18 in each year)
Min 611.2 797.4 354.4 610.4 728.7 686.7 Mean 1727.6 1658.7 1643.2 1271.6 1272.6 1111.1 Max 3207.2 2892.6 3076.0 2832.0 2433.0 2237.2
Very lenient (n=18 in each year)
Min 250.4 220.9 60.8 360.8 441.6 426.9 Mean 1050.2 1093.1 1112.5 834.1 882.8 779.7 Max 2624.0 2587.0 3109.9 1567.2 1798.4 1349.7
All pastures (n=54 in each year)
Min 107.2 170.4 60.8 360.8 441.6 426.9 Mean 1240.2 1240.2 1194.7 1147.2 1145.0 1062.5 Max 3207.2 2892.6 3109.9 2832.0 2602.7 2615.4
3.3 Assessment of position accuracy
Though equal sensor calibrations were used, variation oc-curred between static and mobile measurements (Figs. 3 and. 4). Differences may be brought about by vehicle config-uration and movement, resulting in sensor displacement and confused geographical location. To evaluate these effects on the position of measuring points, which in this study is im-portant to ensure correct placement of sensor measurements inside the reference plots during vehicle passage, a separate experimental setup was used (see also Appendix). Briefly, position accuracy was analyzed by comparing measured and expected USH values of vehicle measurements in the close surrounding of wooden marks with known dimension and position. Erroneous measurements, classified with respect to target and sensor properties, were assigned to their spatial distance from the target edges. The position error is here ex-pressed as the relative frequency of erroneous measurements within a distance class related to apparent target edges, where a USH change between low and high was expected (Fig. 6).
Error frequency declined with increasing distance from apparent target edges, and the trend indicates a negligible risk of erroneous measurements when the distance between two objects was more than 25 cm. Altogether the average posi-tion error was 8.5±5.8 cm. Beside GPS errors of 1–2 cm, positioning inaccuracy observed in this study predominantly originated from undirected vehicle movements due to heaps and hollows of the ground surface. These errors could be compensated for by a gyroscope, which can level out unbal-anced sensor movements caused by the vehicle (Nagasaka et al., 2004). Further, measurement signal processing delays
Figure 6.Frequency of erroneous USH measurements (% of all measurements within a distance class) at different distance from ap-parent target edges (considering target dimensions and sensor prop-erties).
caused position offsets, which have in part been addressed in other studies but are very specific to the respective ve-hicle construction. These position offsets could be compen-sated for by appropriate mathematical models or coefficients in sensor position calculations (Zhao et al., 2010; Gottfried et al., 2012). Hence, although position errors were rather low, there are prospects for a further reduction. Regarding the precision of mobile measurements in the reference sam-pling plots, about 17 % of the measurements (mean position error of 8.5 cm divided by sampling plot width of 50 cm) can be expected to lie outside the sampling plot area, which may have contributed to the resulting discrepancy between static and mobile measurements (Figs. 3 and 4). However, the spa-tial accuracy achieved with the current configuration of the mobile sensor system can be considered adequate and may provide a solid basis for the creation of high-resolution maps.
4 Conclusions
The results from the present study suggest that mobile multi-sensor systems, including ultrasonic and optical multi-sensors, to-gether with a precise GPS can produce acceptable accuracies for biomass assessment in extremely heterogeneous grass-land. Such systems may, for example, facilitate mapping of larger grassland areas at high spatial position accuracy, al-lowing the identification of nested structures within the veg-etation. However, our findings also show the limits even ad-vanced sensor systems have in the assessment of biomass of extremely heterogeneous grasslands, which is e.g. typical for very leniently stocked pastures. Thus, it is necessary that fur-ther research be carried out to develop improved sensor sys-tems for supporting practical grassland farming.
5 Data availability
Appendix A: Abbreviations
FM fresh matter
FOV field of view
GIS geographic information system GPS global positioning system USH ultrasonic sward height
NDSI normalized spectral vegetation index NIR near infrared
SLU standard livestock unit
NDVI normalized difference vegetation index
VI vegetation index
Appendix B: Assessment of position accuracy – detailed information
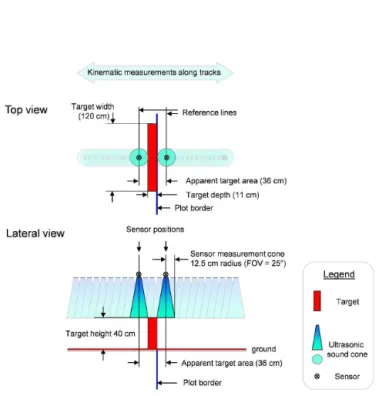
To evaluate the position accuracy during mobile mea-surements within study plots (50×30 m), wooden planks were placed at the end of each vehicle lane at the outer edge of the plot border (Fig. A1). With 120×40×11 cm (depth×width×height) targets had defined dimensions and allowed an unimpaired passage of the vehicle.
Position accuracy was assessed by identifying erroneous measurements with respect to apparent target edges. For this purpose the mounted ultrasonic sensors were used as they provide both high measurement densities along the lanes and sensitive reactions of the measurement signal at target detec-tion. Depending on the field of view and the mount height of the sensor, targets were expected to be hit by the sound cone already at a distance of 12.5 cm on both sides of the target edges during passage, resulting in a total target detec-tion range (apparent target area) of 36 cm width including the target depth of 11 cm (Fig. A2).
A data set was generated using USH measurements within a 25 cm distance around the apparent target edges (Fig. A3). Recordings were performed in the moderately grazed study plot in April 2014 before vegetation started to grow. The low canopy height at this time of the year ensured a suffi-cient discrimination between grassland canopy and targets. USH measurements at locations within the investigated dis-tance (n=920) were attributed with their specific distance to the apparent edge of the targets. Though targets had a de-fined height of 40 cm, measured height values varied due to surface roughness and vehicle movements. This required the determination of the actual target height from the total data set of USH values and distinguishing this from the sward heights. For this purpose the data set was separated by us-ing the inflection point of a height-sorted USH histogram to group and classify readings into low grassland (mean=8.7, SD= ±5.6) and target (mean=42.0, SD= ±4.3) members. Figure A3 presents an example of the classified readings and their respective locations, illustrating point density and com-pliance with target values.
Figure B1.Display of reference targets (wooden planks) at the front ends of the study plot. Targets of defined dimensions and po-sitions allowed the passage of the sensor vehicle moving lane-by-lane.
Author contributions. Michael Wachendorf and Thomas Fricke conceived and designed the experiments. Sensor measurements were performed under supervision of Hanieh Safari, Thomas Fricke and Björn Reddersen while reference value analysis were under su-pervision of Hanieh Safari. Data analysis and paper writing were done by Hanieh Safari with the support of Michael Wachendorf and Thomas Fricke. Björn Reddersen contributed valuable back ground information on data processing and analysis and actively supported the paper writing process. Thomas Möckel took part in the interpre-tation of results and contributed to the revision of the manuscript.
Acknowledgements. The authors would like to thank the division of Grassland Science, Georg-August-Universität Göt-tingen, for the provision of experimental pastures and their kind cooperation. Thanks to Andrea Gerke and Mansour Royan for their help in the field and data analysis. This project was supported by a grant of the Research Training Group 1397 “Regulation of soil organic matter and nutrient turnover in organic agriculture” of the German Research Foundation (DFG).
Edited by: M. J. da Silva
Reviewed by: two anonymous referees
References
Adamchuk, V. I., Hummel, J. V., Morgan, M. T., and Upadhyaya, S. K.: On-the-go soil sensors for precision agriculture, Comp. Elect. Agric., 44, 71–91, 2004.
Biewer, S., Fricke, T., and Wachendorf, M.: Determination of Dry Matter Yield from Legume–Grass Swards by Field Spectroscopy, Crop Sci., 49, 1927–1936, doi:10.2135/cropsci2008.10.0608, 2009a.
Biewer, S., Fricke, T., and Wachendorf, M.: Development of Canopy Reflectance Models to Predict Forage Qual-ity of Legume–Grass Mixtures, Crop Sci., 49, 1917–1926, doi:10.2135/cropsci2008.11.0653, 2009b.
Blüthgen, N., Dormann, C. F., Prati, D., Klaus, V. H., Kleinebecker, T., Hölzel, N., Alt, F., Boch, S., Gockel, S., Hemp, A., Müller, J., Nieschulze, J., Renner, S. C., Schöning, I., Schumacher, U., Socher, S. A., Wells, K., Birkhofer, K., Buscot, F., Oelmann, Y., Rothenwöhrer, C., Scherber, C., Tscharntke, T., Weiner, C. N., Fischer, M., Kalko, E. K. V., Linsenmair, K. E., Schulze, E.-D., and Weisser, W. W.: A quantitative index of land-use intensity in grasslands: Integrating mowing, grazing and fertilization, Basic Appl. Ecol., 13, 207–220, 2012.
Castle, M. E.: A simple disc instrument for estimating herbage yield, J. Br. Grassl. Soc., 31, 37–40, doi:10.1111/j.1365-2494.1976.tb01113.x, 1976.
Cozzolino, D., Porker, K., and Laws, M.: An Overview on the Use of Infrared Sensors for in Field, Proximal and at Har-vest Monitoring of Cereal Crops, Agriculture 2015, 5, 713–722, doi:10.3390/agriculture5030713, 2015.
Diaconis, P. and Efron, B.: Computer-intensive methods in statis-tics, Sci. Am., 248, 96–108, 1983.
Duan, M., Gao, Q., Wan, Y., Li, Y., Guo, Y., and Ganzhu, Z.: Biomass estimation of alpine grasslands under different graz-ing intensities usgraz-ing spectral vegetation indices, Can. J. Remote Sens., 37, 413–421, doi:10.5589/m11-050, 2014.
Farooque, A. A., Chang, Y. K., Zaman, Q. U., Groulx, D., Schu-mann, A. W., and Esau, T. J.: Performance evaluation of multi-ple ground based sensors mounted on a commercial wild blue-berry harvester to sense plant height, fruit yield and topographic features in real-time, Comput. Electron. Agr., 91, 135–144, doi:10.1016/j.compag.2012.12.006, 2013.
Fava, F., Colombo, R., Bocchi, S., Meroni, M., Sitzia, M., Fois, N., and Zucca, C.: Identification of hyperspectral vegetation indices for Mediterranean pasture characterization, Int. J. Appl. Earth Obs., 11, 233–243, doi:10.1016/j.jag.2009.02.003, 2009. Fricke, T. and Wachendorf, M.: Combining ultrasonic sward
height and spectral signatures to assess the biomass of legume–grass swards, Comput. Electron. Agr., 99, 236–247, doi:10.1016/j.compag.2013.10.004, 2013.
Fricke, T., Richter, F., and Wachendorf, M.: Assessment of for-age mass from grassland swards by height measurement us-ing an ultrasonic sensor, Comput. Electron. Agr., 79, 142–152, doi:10.1016/j.compag.2011.09.005, 2011.
Goel, N. S.: Models of vegetation canopy reflectance and their use in estimation of biophysical parameters from reflectance data, Remote Sens., 4, 1–212, doi:10.1080/02757258809532105, 1988.
Gottfried, T., Auerswald, K., and Ostler, U.: Mobile correction for a spatial offset between sensor and position data in on-the-go sensor applications, Comput. Electron. Agr., 84, 76–84, 2012. Hakl, J., Hrevušová, Z., Hejcman, M., and Fuksa, P.: The use of
a rising plate meter to evaluate Lucerne (Medicago sativaL.) height as an important agronomic trait enabling yield estimation, Grass Forage Sci., 67, 589–596, 2012.
Himstedt, M., Fricke, T., and Wachendorf, M.: Determin-ing the contribution of legumes in legume-grass mixtures using digital image analysis, Crop Sci., 49, 1910–1916, doi:10.2135/cropsci2008.11.0636, 2009.
Inoue, Y., Penuelas, J., Miyata, A., and Mano, M.: Normalized dif-ference spectral indices for estimating photosynthetic efficiency and capacity at a canopy scale derived from hyperspectral and CO2 flux measurements in rice, Remote Sens. Environ., 112, 156–172, doi:10.1016/j.rse.2007.04.011, 2008.
Isselstein, J., Jeangros, B., and Pavlu, V.: Agronomic aspects of bio-diversity targeted management of temperate grasslands in Europe – A review, Agr. Res., 3, 139–151, 2005.
Kawamura, K., Betteridge, K., Sanches, I. D., Tuohy, Mike P., Costall, D., and Inoue, Y.: Field radiometer with canopy pasture probe as a potential tool to estimate and map pasture biomass and mineral components: A case study in the Lake Taupo catch-ment, New Zealand, New Zeal. J. Agr. Res., 52, 417–434, doi:10.1080/00288230909510524, 2009.
Kristensen, T., Søegaard, K., and Kristensen, I. S.: Management of grasslands in intensive dairy livestock farming, Livest Prod Sci., 96, 61–73, doi:10.1016/j.livprodsci.2005.05.024, 2005. Lan, Y., Zhang, H., Lacey, R., Hoffmann, W. C., and Wu, W.:
De-velopment of an Integrated Sensor and Instrumentation System for Measuring Crop Conditions, Agricultural Engineering Inter-national: the CIGR E Journal, Manuscript IT 08 1115, Vol. XI, April, 2009.
Advances, Sensors, 13, 10823–10843, doi:10.3390/s130810823, 2013.
Nagasaka, Y., Umeda, N., Kanetai, Y., Taniwaki, K., and Sasaki Y.: Autonomous guidance for rice transplanting using global posi-tioning and gyroscopes, Comput. Electron. Agr., 43, 223–234, 2004.
Nelder, J. A.: The statistics of linear models: back to basics, Stat Comput., 4, 221–234, doi:10.1007/BF00156745, 1994. Numata, I., Roberts, D., Chadwick, O., Schimel, J., Galvao,
L., and Soares, J.: Evaluation of hyperspectral data for pas-ture estimate in the Brazilian Amazon using field and imag-ing spectrometers, Remote Sens. Environ., 112, 1569–1583, doi:10.1016/j.rse.2007.08.014, 2008.
Oudshoorn, F. W., Cornou, C., Hellwing, A. L. F., Hansen, H. H., Munksgaard, L., Lund, P., and Kristensen, T.: Estima-tion of grass intake on pasture for dairy cows using tightly and loosely mounted di- and tri-axial accelerometers com-bined with bite count, Comput. Electron. Agr., 99, 227–235, doi:10.1016/j.compag.2013.09.013, 2013.
Pepperl, F.: Sensors for the factory automation – Overview Stan-dard Sensors, Pepperl+Fuchs ENU Part No. 200237, avail-able from: http://www.pepperl-fuchs.us/usa/downloads_USA/ Sensing-your-needs-2010-01-EN.pdf, 2010.
Pittman, J. J., Arnall, D. B., Interrante, S. M., Moffet, C. A., and Butler, T. J.: Estimation of biomass and canopy height in bermudagrass, alfalfa, and wheat using ultra-sonic, laser, and spectral sensors, Sensors, 15, 2920–2943, doi:10.3390/s150202920, 2015.
Pullanagari, R. R., Yule, I. J., Hedley, M. J., Tuohy, M. P., Dynes, R. A., and King, W. M.: Multi-spectral radiometry to esti-mate pasture quality components, Precis. Agric., 13, 442–456, doi:10.1007/s11119-012-9260-y, 2012.
Psomas, A., Kneubühler, M., Huber, S., Itten, K., and Zimmer-mann, N. E.: Hyperspectral remote sensing for estimating above-ground biomass and for exploring species richness patterns of grassland habitats, Int. J. Remote Sens., 32, 9007–9031, doi:10.1080/01431161.2010.532172, 2011.
R Development Core Team, R.: A Language and Environment for Statistical Computing, The R Foundation for Statistical Com-puting, Vienna, Austria, ISBN 3-900051-07-0, available at: http: //www.R-project.org/, 2013.
Rahman, M. M., Lamb, D. W., Stanley, J. N., and Trotter, M. G.: Use of proximal sensors to evaluate at the sub-paddock scale a pasture growth-rate model based on light-use efficiency, Crop Pasture Sci., 65, 400–409, doi:10.1071/CP14071, 2014.
Raymond, H. E.: Airborne remote sensing of canopy water thick-ness scaled from leaf spectrometer data, Int. J. Remote Sens., 12, 643–649, doi:10.1080/01431169108929679, 1991.
Reddersen, B., Fricke, T., and Wachendorf, M.: A multi-sensor approach for predicting biomass of extensively man-aged grassland, Comput. Electron. Agr., 109, 247–260, doi:10.1016/j.compag.2014.10.011, 2014.
Rook, A. and Tallowin, J.: Grazing and pasture manage-ment for biodiversity benefit, Anim. Res., 52, 181–189, doi:10.1051/animres:2003014, 2003.
Ryan, T. P.: Modern regression methods, John Wiley & Sons, Vol. 655, 2008.
Safari, H., Fricke, T., and Wachendorf, M.: The potential of ultra-sonic and hyperspectral sensor combination for the estimation and mapping of pasture biomass, Mitt. Gesell. Pflanzenbauwis-senschaften, 27, 139–142, 2015.
Safari, H., Fricke, T., and Wachendorf, M.: Determination of fibre and protein content in heterogeneous pastures using field spectroscopy and ultrasonic sward height measurements, Comput. Electron. Agr., 123, 256–263, doi:10.1016/j.compag.2016.03.002, 2016.
Schellberg, J., Hill, M. J., Gerhards, R., Rothmund, M., and Braun, M.: Precision agriculture on grassland: Applications, perspectives and constraints, Eur. J. Agron., 29, 59–71, doi:10.1016/j.eja.2008.05.005, 2008.
Silvia Cid, M., Miguel, A., and Bizuela Cid, B.: Heterogeneity in tall fescue pastures created and sustained by cattle grazing, Range Manage., 6, 644–649, 1998.
Suzuki, Y., Okamoto, H., Takahashi, M., Kataoka, T., and Shibata, Y.: Mapping the spatial distribution of botanical composition and herbage mass in pastures using hyperspectral imaging, Grassl. Sci., 58, 1–7, doi:10.1111/j.1744-697X.2011.00239.x, 2012. Wrage, N., Strodthoff, J., Cuchillo, H., Isselstein, J., and Kayser,
M.: Phytodiversity of temperate permanent grasslands: ecosys-tem services for agriculture and livestock management for diver-sity conservation, Biodivers. Conserv., 20, 3317–3339, 2011. Wrage, N., ¸Sahin Demirba˘g, N., Hofmann, M., and Isselstein, J.:
Vegetation height of patch more important for phytodiversity than that of paddock, Agr. Ecosyst. Environ., 155, 111–116, doi:10.1016/j.agee.2012.04.008, 2012.