Opinion Formation Models on a Gradient
Michael T. Gastner1,2,3*, Nikolitsa Markou4, Gunnar Pruessner3, Moez Draief4
1.Institute of Technical Physics and Materials Science, Research Centre for Natural Sciences, Hungarian Academy of Sciences, Budapest, Hungary,2.Department of Engineering Mathematics, University of Bristol, Bristol, United Kingdom,3.Department of Mathematics, Imperial College London, London, United Kingdom, 4.Department of Electrical and Electronic Engineering, Imperial College London, London, United Kingdom *[email protected]
Abstract
Statistical physicists have become interested in models of collective social behavior such as opinion formation, where individuals change their inherently preferred opinion if their friends disagree. Real preferences often depend on regional cultural differences, which we model here as a spatial gradient gin the initial opinion. The
gradient does not only add reality to the model. It can also reveal that opinion clusters in two dimensions are typically in the standard (i.e., independent) percolation universality class, thus settling a recent controversy about a non-consensus model. However, using analytical and numerical tools, we also present a model where the width of the transition between opinions scales!g{1=4, not
!g{4=7 as in independent percolation, and the cluster size distribution is
consistent with first-order percolation.
Introduction
Disagreement between neighbors costs energy, in human societies as well as in ferromagnetic spin interactions. Because of this similarity, statistical physicists have recently shown great interest in models of opinion formation (e.g. [1–6], see [7,8] for literature reviews). Individual actors in a population are regarded as nodes in a network and their opinions represent political affiliations, religions or consumer choices (Microsoft Windows vs. UN*X, Blu-ray vs. HD-DVD, etc.). The nodes influence each other’s opinions along the edges in the network according to rules specific to the model in question. Rules that allow a critical mass of like-minded peers to persuade a disagreeing individual have recently found support in behavioral experiments [9]. The resulting opinion dynamics has been linked to election outcomes [10,11] and innovation diffusion [12,13], suggesting lessons for political campaigns [14] and advertisement [15]. OPEN ACCESS
Citation:Gastner MT, Markou N, Pruessner G, Draief M (2014) Opinion Formation Models on a Gradient. PLoS ONE 9(12): e114088. doi:10.1371/ journal.pone.0114088
Editor:Renaud Lambiotte, University of Namur, Belgium
Received:June 9, 2014
Accepted:November 3, 2014
Published:December 4, 2014
Copyright:ß2014 Gastner et al. This is an open-access article distributed under the terms of the
Creative Commons Attribution License, which permits unrestricted use, distribution, and repro-duction in any medium, provided the original author and source are credited.
Data Availability:The authors confirm that all data underlying the findings are fully available without restriction. All relevant data are within the paper and its Supporting Information files.
Funding:MTG was supported by an Imperial College London Junior Research Fellowship:http:// www3.imperial.ac.uk/juniorresearchfellowships. MTG was supported by the European Commission, project number FP7-PEOPLE-2012-IEF 6-456412013:http://ec.europa.eu/research/ mariecurieactions/. The funders had no role in study design, data collection and analysis, decision to publish, or preparation of the manuscript.
Many opinion formation models embedded in two-dimensional space have only one stable solution, namely complete consensus [3,5,16], in particular when they implement deterministic rules. In reality, however, deterministic social behavior and perfect agreement are rare [17] – at least one small village of indomitable Gauls always holds out against the Romans. Some models thus allow clusters of a minority opinion to persist even if entirely surrounded by the opposite opinion [18,19]. In this case, percolation theory provides the tools to analyze the geometry of the minority clusters [19,20]. However, the results [19,21] have been subject to some controversy because long-range correlations, thought to be responsible for deviations from independent percolation, are expected to require a long time to develop from an uncorrelated initial state [22]. Clearly, interactions generate complex correlations that can obscure the familiar scaling behavior of independent percolation. However, as illustrated in the present work, one must exercise great care before concluding that a given interaction spoils the (asymptotic) scaling of independent percolation.
In this article we tackle the open question: can opinion dynamics, with or without a stochastic element, fundamentally alter percolation properties such as the clusters’ fractal dimensions or the cluster size distribution? We show that in many cases we retrieve the scaling laws of independent percolation. Moreover, we also give one example where a slight change of the dynamic rules leads to a radically different scaling behavior.
Methods
We focus on models where the nodes are placed on a square lattice with edges linking them to their four nearest neighbors. Each node holds one of two possible opinions: ‘‘black’’ or ‘‘white’’. Initially, the probability to be black is independent at all sites and given by
p(x)~gxzpc, x[½{pc=g,(1{pc)=g, ð1Þ
where xis the node’s horizontal position andg[Rz a constant gradient. (We set the intercept pc equal to the percolation threshold for later convenience.) We
interpretp(x) as the innate propensity to hold the black opinion at the beginning as well as during the evolution of the opinions. Thus, nodes on the far left and far right of the lattice are likely to have opposite opinions. Some previous spatial models have included heterogeneous agents [23–25], but no gradient. In contrast, election results in various countries exhibit clear, smooth gradients, especially between progressive urban and conservative rural areas [26–28]. Our model resembles such a ‘‘culture war’’ fought on a gradient.
Including a non-zero gradient in the numerical simulations also has advantages for studying percolation properties [29]. As opposed to running many individual simulations for a range of different values of p, a gradient model allows us to analyze, in a single simulation, clusters for a whole interval of p rather than a single fixed value.
In the present work we consider opinion formation according to the following local rules.
N
Majority vote (MV): the node follows the majority opinion of its four nearest neighbors. If both opinions are equally represented, no opinion change occurs.N
Unanimity rule (UR): the node changes its current opinion if and only if all of its nearest neighbors hold the opposite opinion [30].N
Independent percolation (IP): the node keeps its current opinion irrespective of the surrounding opinions.When a node is updated, it follows the local rule with probabilityq. Otherwise it independently chooses a random opinion according to Eq. 1, so that 12qis the level of noise entering the dynamics. Notably, Eq. 1 is the only way for the local prevalence of a certain opinion and thus the gradient to enter into the dynamics of the system. Atq51 the evolution is affected by the presence of the gradient only through the initial condition. At q,1 the random updates during the evolution exhibit the innate propensity gradient towards one or the other opinion by allowing agents to revert to their original opinion even if it contradicts the local majority.
All nodes simultaneously update their opinion at each time step, but other choices such as random sequential updates do not change our findings noticeably. The latter may have the more immediate social interpretation as an ongoing opinion formation with agents re-considering choices with a fixed rate, but simultaneous updates are, surprisingly, slightly more accessible analytically. For a fixed value ofq, we abbreviate the models by MVqor URq, respectively. We do not
need a subscriptqfor IP because, regardless of the value ofq, any snapshot of the lattice looks statistically alike, depending only on the parameterspcandgin Eq. 1.
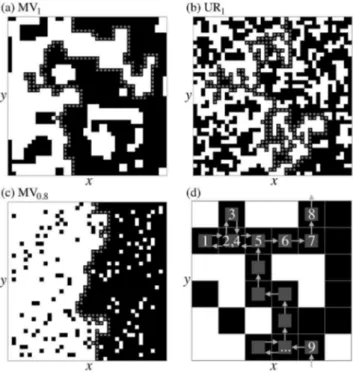
Once the model reaches the steady state, we study the geometric properties of the clusters formed. On the left of Fig. 1(a)–(c), the black clusters form small isolated islands, whereas on the right a single large black cluster spans from top to bottom [31]. This percolation transition can be characterized by the hull of the spanning cluster [32], defined as the following left-turning walk [33,34]. We start the walk at a site with minimalx-coordinate in the black spanning cluster and face towards the right (Fig. 1d). First we attempt to turn to the neighbor on our left, but step in this direction only if we reach a black site. Otherwise, we try to move forward, then to the right, and finally backward until we have discovered the first black neighbor. If we iterate this procedure and apply periodic boundary
conditions in the y-direction, the hull has visited the entire front of the spanning cluster when it returns to the starting position.
Results and Discussion
Steady-state hull width and length
If q51, the dynamics is deterministic and the only source of randomness lies in the initial assignment of opinions. In this special case, MV1is identical to the
non-consensus opinion model of Ref. [19], where it was already noted that a small fraction of the nodes – in our simulations 1.2% on average at pc50.50643(1) – keeps switching opinions with period 2. When all other nodes have stopped changing opinions, we will consider MV1 to have reached its steady state. The
convergence is quick: a non-periodic node freezes after a mean of only 0.8 time steps. In UR1, oscillatory opinions can occur only if the initial opinions form a
Figure 1. Opinion distributions and percolation hull.We show typical steady-state opinion distributions for
g5561023and (a) MV1, (b) UR1, (c) MV0.8. The two opposing opinions are shown as black and white squares. The sites marked by gray squares form the spanning cluster’s hull. (d) Illustration how the hull can be parameterized by a left-turning walk [33].
doi:10.1371/journal.pone.0114088.g001
Table 1.Summary.
Model q Exponents Universality Class
Independent Percolation (IP) a~4=7,b~3=7,df~91=48,n~4=3 IP (by definition) Deterministic Majority Vote Model (MV1) 1 a~4=7,b~3=7,df~91=48,n~4=3 IP
Deterministic Unanimity Rule (UR1) 1 a~4=7,b~3=7,df~91=48,n~4=3 IP
Stochastic Majority Vote Model (MV0.8) 0.8 a~1=4,b~0,df~2 Edwards-Wilkinson
Stochastic Unanimity Rule (UR0.8) 0.8 a~4=7,b~3=7,df~91=48,n~4=3 IP
Summary of the results. For definitions of models and exponents see text. doi:10.1371/journal.pone.0114088.t001
perfect checkerboard pattern. Because the gradient pins the left (right) edge to be entirely white (black), a checkerboard pattern is impossible. Hence, every node reaches a stationary opinion, on average after just 0.06 updates atpc50.549199(5). For IP, percolation occurs, as in zero-gradient percolation, atpc50.59274(1) [35]. Ifq,1, the opinions in MVq and URq never freeze, but, after a transient, the
stochastic time series of black occupancy in any columnxbecomes stationary. All measurements for q,1 presented here were made atq50.8 in this steady state. A visual comparison betweenFig. 1(a)–(c)suggests a qualitative difference between MV1 and UR1 on the one hand and MV0.8 on the other hand. In the latter case,
the spanning cluster appears significantly more compact and the hull, which is centered at pc50.5000(4), much straighter. So, counterintuitively, the stochastic dynamics of MV0.8 anneals rather than roughens the surface compared to MV1
and UR1.
We can quantify this observation by computing the hull’s widthwand lengthl. If the hull consists of the walk (x1,y1),. . .,(xl,yl), we define
w~
ffiffiffiffiffiffiffiffiffiffiffiffiffiffiffiffiffiffiffiffiffiffiffiffiffiffiffiffiffiffiffiffiffiffiffiffi P
ix2i
l {
P
ixi
l
2
s
: ð2Þ
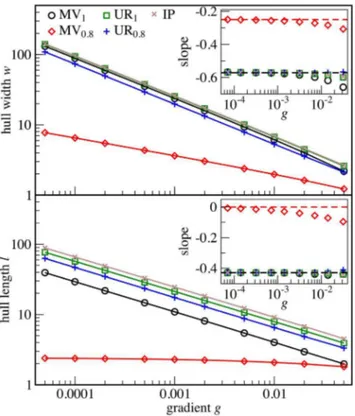
As the numerical results inFig. 2show, the width and length for all models scale as power laws w!g{a and l!g{b in the limit g?0z
. With only one exception among all investigated cases, the results are consistent with a~4=7 and b~3=7,
the exact exponents of independent gradient percolation [36]. We also retrieve the correlation length critical exponent nof standard percolation via the formula
n~a=(1{a)~(1{b)=b~4=3 [31]. The notable exception is MV0.8 with a~0:250(4)and b~0:0074(1), based on numerics for g~10{4 and g~5:10{5.
Studying the dependence ofb ongsystematically suggests b?0for g?0, whilea stays close to 1/4. In fact, the analytical results presented below indicate that
a~1=4 and b~0. In independent percolation, a=4=7 can arise only if the probability to be black increases nonlinearly at the percolation threshold [37]. However, in that case the ratiob=amust still equal 3/4 which is not true for MV0.8
so that we must look elsewhere for an explanation.
We will briefly summarize whya equals 1/4 for MVq ifq is close to, but not
equal to 1. For details we refer to the online Information S1. We make two approximations. (1) The hull can be treated as a single-valued function of y so that we can parameterize the hull at time t as a function h(t,y). (2) In MV0.8, as
opposed to URq and IP, we observe only few isolated minority nodes, which
motivates a ‘‘solid-on-solid’’ approximation: we neglect that there is a small number of black (white) sites to the left (right) of h(t,y). With the notation
r~1{q, the only transition probabilities forh(t,y)up to terms of orderO(r2)are
(see Information S1)
Prh?h{1zKy~r 1
2zg h{
1 2zKy
Prh?hzKy~1zr(g{1), ð4Þ
Prh?hz1zKy~r 1
2{g hz
1 2zKy
, ð5Þ
where Ky~z1ifh(t,y)is a strict local minimum iny, Ky~{1 for a maximum,
and Ky~0 otherwise. In the continuum limit [38], the leading terms in the
evolution of the hull are (see Information S1)
Lh Lt~D
L2h
Ly2{EghzFg(t,y), ð6Þ
where D,E,F are independent of g and gis white noise with mean zero and covariance hg(t,y)g(t’,y’)i~d(t{t’)d(y{y’). Equation 6 is the
Edwards-Wilkinson equation [39] with an Ornstein-Uhlenbeck restoring force [40,41] and can be integrated (see Information S1) to obtain the continuum limit of Eq. 2,
w2~lim
t?? h
(t)2{h(t)2
D E
~ F
2
4pffiffiffiffiffiffiffiffiffiDEg, ð7Þ
Figure 2. Mean hull width and length determined numerically as a function of the gradient.Insets: slope in doubly-logarithmic scales (i.e.dlog(w)=dlog(g)in upper,dlog(l)=dlog(g)in lower panel). Dashed lines indicate the limiting slopes forg?0zwhich follow from scaling analysis (see text):24/7 and21/4 in the upper,
23/7 and 0 in the lower panel. Error bars are smaller than the symbol sizes.
doi:10.1371/journal.pone.0114088.g002
where the angle brackets denote the ensemble average and the overlines symbolize spatial averages. Thus, we obtain w!g{1=4 consistent with the numerical results for MV0.8. Although we have here derived the scaling law only for the MV model,
numerical evidence suggests that a~1=4 is valid for a broader class of gradient
models. In Ref. [42], a numerical fit for a spatial birth-death process on a gradient also yields a~0:26(1).
Cluster sizes
The scaling laws forwandlsignal that MV0.8is not in the same universality class
as IP. In Ref. [19] it is claimed that MV1 is in yet another class, namely invasion
percolation with trapping (IPT). Althoughwscales identically in IP and IPT [43], we now demonstrate how the gradient method can still show unequivocally that MV1 belongs to the IP class after all, thus supporting the arguments of Ref. [22].
We calculate the sizesmaxof the largest cluster in a lattice whose linear size isLin
bothx- andy-direction. We center thex-axis atpcso that the initial probability to
be black in Eq. 1 is limited by+1
2gLzpcon the right (left) edge. As a function of
L and g, smax is expected to satisfy the ansatz
smax~Ldffsmax(L=j(g)): ð8Þ
Heredf is the fractal dimension of the cluster at pc, j(g)is the characteristic
length scale for changes in the cluster density, and the scaling function fsmax(z)
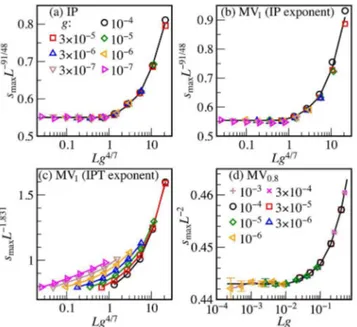
approaches a constant for z?0z. The fractal dimensions differ between the two universality classes in question:df~91=48<1:896for IP anddf~1:831(3)for IPT
[44]. Furthermore,j(g)in IP scales linearly withw!g{4=7 [31]. Thus, according to Eq. 8, a plot ofsmaxL{91=48versusLg4=7collapses the IP data for differentLand g on a single curve that asymptotically approaches a constant for small Lg4=7 (
Fig. 3a). For MV1, we obtain a data collapse with the same IP exponents (Fig. 3b).
By contrast, if we assume df~1:831, there is neither a collapse nor do the
individual curves approach a constant for Lg4=7?0z (Fig. 3c), hence ruling out that MV1is in the same universality class as IPT. Changing the exponent 4/7 ong
leads to a lateral shift of the data in Fig. 3(c), but we found no value yielding a convincing data collapse. Moreover, it cannot overcome the problem that the hypothetical scaling function fsmax(z)would not become constant for z?0
z
. However, the collapse of MV0.8 with df~2 (which lends further support to the
solid-on-solid approximation) and j(g)!g{1
in Fig. 3(d) corroborates that opinion dynamics can lead to percolation outside the IP universality class.
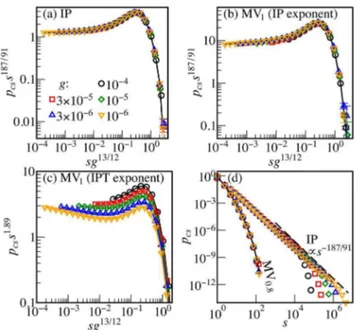
The cluster size distribution provides further support for this classification. We count all non-spanning clusters with at least one site in the stripe jxjvw and compute the fraction pcs(s)of clusters of size s. In IP [42]
pcs(s)~s{tfcs sg1=½s(nz1)
where the critical exponents are t~187=91<2:055, s~36=91, n~4=3 [45], and fcs(z)?const: for z?0z (Fig. 4a). Reference [19] hypothesizes that in MV1 the exponent tis replaced by 1.89(1), the corresponding value for the pore size distribution in IPT. However,Fig. 4(b)and (c) show that, while the data collapse is excellent for t~187=91, it is poor for the alternative value 1.89. In summary,
MV1 and IP share the following critical exponents: the hull width and length
exponents a, b and consequently n~4=3; the fractal dimension df and thus b~n(2{df); furthermoretands. This list is clear evidence that MV1is in the IP
universality class. As shown in the Information S1, we reach the same conclusion for UR1 and UR0.8.
The situation is different in MV0.8where the cluster size distribution appears to
drop more sharply with a cutoff that varies much less with the gradient. We want to assess the lack of scaling quantitatively and distinguish it from a power law with large exponent tand little dependence of the upper cutoff ong. Moment ratios
s(n)
c ~hsn
z1
i=hsniare asymptotically proportional to the upper cutoff, provided
nwt{1. If the transition is continuous, thens(n)
c scales asymptotically as a power
of g. This power law can be detected more easily than the asymptotic scaling regime pcs!s{t [46].
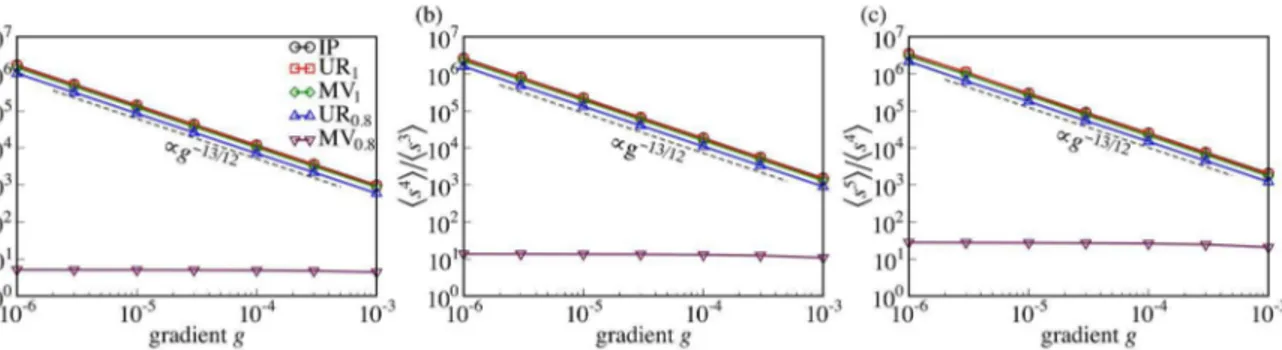
We plot the moment ratios of IP, UR1, MV1, UR0.8and MV0.8 for n~2,3,4in
Fig. 5. Except MV0.8, all of these cases are in excellent agreement with the
prediction of Eq. 9,s(n)
c !g
{1=½s(nz1), wheres~36=91 andn~4=3are the critical Figure 3. Fractal dimensions.For the correct exponentsdf andc,smaxL{df as a function ofLgcshould
collapse on a single curve with slope zero forLgc?0. For (a) IP and (b) MV1,d
f~91=48is the same as the fractal dimension of standard percolation. (c) Replacingdf with the value 1.831 of invasion percolation with
trapping (IPT) does not produce a data collapse. (d) For the largest MV0.8cluster, we obtain a data collapse if
df~2.
doi:10.1371/journal.pone.0114088.g003
exponents of IP [45]. The cutoffs(cn) in MV0.8, by contrast, does not diverge as a
power law for g?0z. Insteads(n)
c appears to reach an asymptotic value for alln.
Such a behavior is typical of a first-order transition. Based on these data, we can firmly rule out thattin MV0.8has the IP value187=91<2:055. We add the caveat
that, for sufficiently large n,s(cn) may scale as a power of gafter all. However, the data imply tw5, an unusually large value compared to IP, directed percolation (t~2:112) [47] and Achlioptas percolation (t~2:04762) [48].
Conclusions
We have studied in total five opinion dynamics models on a gradient, as
summarized inTable 1. One of the models we studied, independent percolation, provides the very definition of the corresponding universality class, IP. We find that of the four other models studied, three display features that are fully compatible with IP, which is commonly observed in gradient models with and without interaction [29,49,50].
One model, MV0.8, differs from all of the above. Atp~1=2 it has states with
either a black or white majority. Without a gradient, (i.e. g~0in Eq. 1, so that p(x)~1=2 is constant in x), there are two stable stationary solutions, where one
state is above and the other below the threshold of percolation of, say, black sites. There is hysteresis if one tries to move from one majority to the other by tuningp, Figure 4. Cluster size distributions.(a) The rescaled distributionpcsstfor IP collapses if plotted versus sg1=½s(nz1), where the critical exponentsn,s,tare those of standard percolation. For MV1the data collapse is
much better (b) for the IP exponentt~187=91than (c) for the IPT exponentt~1:89. (d) The MV0.8distribution does not follow the same asymptotic power law as IP.
as expected for first order transitions. By introducing a gradient, the two phases are forced to collide because the left boundary must be completely white and the right boundary black. We observe that the gradient stabilizes and sharpens the front compared to independent percolation.
MV0.8 differs from the other models in two important points. First, its
stochastic nature helps anneal boundaries between opposite opinions. The second difference is that the majority rule makes small clusters more prone to invasion by the opposing opinion. The combination of these two features results in what appears to be a first order transition. Nevertheless, the opinion interface displays scaling, found to be in the Edwards-Wilkinson universality class, which differs significantly from independent percolation.
The birth-death model of Ref. [42] suggested already the possibility of first-order transitions in gradient models. We leave it to future research to analytically confirm the first-order nature of the MV0.8 transition. It would also be insightful
to investigate more complex network topologies that are based on real social interactions rather than a regular square lattice. We emphasize that, in the light of previous work on explosive percolation [48,51–53], only analytic results can fully clarify the order of any percolation transition. However, we can conclude with certainty that, although none of the opinion models we have investigated is consistent with IPT, MV0.8 is an example of a dynamic rule that leads to
percolation outside the IP universality class.
From a sociological perspective, our study shows that small variations in the innate propensity towards one or another opinion may turn into a spatial discontinuity in the opinions. Interestingly, the sharpest division occurs when agents do not follow the local majority all the time. Hence, processes that may be perceived as having the effect of making the interface between different opinions more blurred, such as the majority rule with stochasticity involved, have the opposite effect. They anneal that interface and contribute to the collapse of minority clusters, which are sustained in the presence of stricter rules, such as the deterministic unanimity rule.
Figure 5. Cluster size moment ratios.The moment ratioshsnz1i=hsniof the cluster size distributions for (a)n~2, (b)n~3, (c)n~4. The ratios for UR1, MV1,
and UR0.8scale in the same manner as in IP, namelyhsnz1i=hsni!g13=12. By contrast, the moment ratios for MV0.8appear to reach an asymptotic limit for g?0z.
doi:10.1371/journal.pone.0114088.g005
Supporting Information
Information S1. Derivation of Eq. 3–7 and data showing that UR1and UR0.8are in the IP universality class.
doi:10.1371/journal.pone.0114088.s001 (PDF)
Author Contributions
Conceived and designed the experiments: MTG NM GP MD. Performed the experiments: MTG NM. Analyzed the data: MTG NM GP. Wrote the paper: MTG NM GP MD.
References
1. de Oliveira MJ(1992) Isotropic majority-vote model on a square lattice. J Stat Phys 66: 273–281. 2. Sznajd-Weron K, Sznajd J(2000) Opinion evolution in closed community. Int J Mod Phys C 11: 1157. 3. Krapivsky PL, Redner S(2003) Dynamics of majority rule in two-state interacting spins systems. Phys
Rev Lett 90: 238701.
4. Galam S(2005) Local dynamics vs. social mechanisms: A unifying frame. Europhys Lett 70: 705–711. 5. Lambiotte R, Redner S(2007) Dynamics of vacillating voters. J Stat Mech 2007: L10001.
6. Roca C, Draief M, Helbing D (2012) Coordination and competitive innovation spreading in social networks. In: Helbing D, editor, Social Self-Organization, Berlin: Springer. pp. 169–184.
7. Castellano C, Fortunato S, Loreto V(2009) Statistical physics of social dynamics. Rev Mod Phys 81: 591–646.
8. Stauffer D(2013) A biased review of sociophysics. J Stat Phys 151: 9–20.
9. Moussaı¨d M, Ka¨mmer JE, Analytis PP, Neth H(2013) Social influence and the collective dynamics of opinion formation. PLoS One 8: e78433.
10. Bernardes AT, Stauffer D, Kerte´sz J (2002) Election results and the Sznajd model on Barabasi network. Eur Phys J B 25: 123–127.
11. Gonza´lez MC, Sousa AO, Herrmann HJ(2004) Opinion formation on a deterministic pseudo-fractal network. Int J Mod Phys C 15: 45–58.
12. Amini H, Draief M, Lelarge M(2009) Marketing in a random network. In: Altman E , Chaintreau A, editors, Network Control and Optimization, Berlin: Springer. pp. 17–25.
13. Martins ACR, de B Pereira C, Vicente R (2009) An opinion dynamics model for the diffusion of innovations. Physica A 388: 3225–3232.
14. Gradowski TM, Kosin´ski RA(2006) The effect of an electoral campaign for election results in an open community. Int J Mod Phys C 17: 1327–1338.
15. Watts DJ, Dodds PS(2007) Influentials, networks, and public opinion formation. J Consum Res 34: 441–458.
16. Liggett TM (1999) Stochastic Interacting Systems: Contact, Voter and Exclusion Processes. Berlin: Springer. 335 p.
17. Klinkner PA(2004) Red and blue scare: The continuing diversity of the American electoral landscape. The Forum 2: 2.
18. Stauffer D(2004) Difficulty for consensus in simultaneous opinion formation of Sznajd model. J Math Sociol 28: 25–33.
20. Camia F, Newman CM, Sidoravicius V(2004) A particular bit of universality: Scaling limits of some dependent percolation models. Commun Math Phys 246: 311–332.
21. Shao J, Havlin S, Stanley HE(2012) Shao, Havlin, and Stanley reply. Phys Rev Lett 109: 079802. 22. Sattari A, Paczuski M, Grassberger P (2012) Comment on dynamic opinion model and invasion
percolation. Phys Rev Lett 109: 079801.
23. Stauffer D, Sa´ Martins JS(2004) Simulation of Galam’s contrarian opinions on percolative lattices. Physica A 334: 558–565.
24. Centola D, Willer R, Macy M(2005) The emperor’s dilemma: A computational model of self-enforcing norms. Am J Sociol 110: 1009–1040.
25. Mobilia M, Petersen A, Redner S(2007) On the role of zealotry in the voter model. J Stat Mech 2007: P08029.
26. Cutler F, Jenkins RW(2002) Where one lives and what one thinks: Implications of rural-urban opinion cleavages for Canadian federalism. In: Lazar H, Telford H, editors, Canada: The State of the Federation 2001, Montreal: McGill-Queen’s University Press. pp. 367–392.
27. Clem RS, Chodakiewicz MJ(2004) Poland divided: Spatial differences in the June 2003 EU accession referendum. Eurasian Geogr Econ 45: 475–490.
28. Lang R, Sanchez T, Berube A (2008) The new suburban politics: A county-based analysis of metropolitan voting trends since 2000. In: Teixeira R, editor, Red, Blue, and Purple America: The Future of Election Demographics, Washington: Brookings Institution Press. pp. 25–49.
29. Gouyet JF, Rosso M(2005) Diffusion fronts and gradient percolation: A survey. Physica A 357: 86–96. 30. Lambiotte R, Thurner S, Hanel R(2007) Unanimity rule on networks. Phys Rev E 76: 046101. 31. Sapoval B, Rosso M, Gouyet JF(1985) The fractal nature of a diffusion front and the relation to
percolation. J Physique Lett 46: L149–L156.
32. Voss RF(1984) The fractal dimension of percolation cluster hulls. J Phys A: Math Gen 17: L373–L377. 33. Grossman T, Aharony A(1986) Structure and perimeters of percolation clusters. J Phys A: Math Gen
19: L745–L751.
34. Gastner MT, Oborny B, Zimmermann DK, Pruessner G (2009) Transition from connected to fragmented vegetation across an environmental gradient: Scaling laws in ecotone geometry. Am Nat 174: E23–E39.
35. Newman MEJ, Ziff RM(2000) Efficient Monte Carlo algorithm and high-precision results for percolation. Phys Rev Lett 85: 4104–4107.
36. Nolin P(2008) Critical exponents of planar gradient percolation. Ann Probab 36: 1748–1776. 37. Gastner MT, Oborny B (2012) The geometry of percolation fronts in two-dimensional lattices with
spatially varying densities. New J Phys 14: 103019.
38. Vvedensky DD (2003) Edwards-Wilkinson equation from lattice transition rules. Phys Rev E 67: 025102(R).
39. Edwards SF, Wilkinson DR(1982) The surface statistics of a granular aggregate. Proc R Soc Lond A 381: 17–31.
40. Uhlenbeck GE, Ornstein LS(1930) On the theory of the Brownian motion. Phys Rev 36: 823. 41. Van Kampen NG(1992) Stochastic Processes in Physics and Chemistry. Amsterdam: Elsevier. 480 p. 42. Gastner MT, Oborny B, Ryabov AB, Blasius B(2011) Changes in the gradient percolation transition
caused by an Allee effect. Phys Rev Lett 106: 128103.
43. Birovljev A, Furuberg L, Feder J, Jøssang T, Ma˚løy KJ, et al.(1991) Gravity invasion percolation in two dimensions: Experiment and simulation. Phys Rev Lett 67: 584–587.
44. Schwarzer S, Havlin S, Bunde A(1999) Structural properties of invasion percolation with and without trapping: Shortest path and distributions. Phys Rev E 59: 3262–3269.
45. Stauffer D, Aharony A(1991) Introduction to percolation theory. London: Taylor & Francis, 2nd edition. 192 p.
46. Christensen K, Farid N, Pruessner G, Stapleton M (2008) On the scaling of probability density functions with apparent power-law exponents less than unity. Eur Phys J B 62: 331–336.
47. Dhar D, Barma M(1981) Monte Carlo simulation of directed percolation on a square lattice. J Phys C: Solid State Phys 14: L1–L6.
48. da Costa RA, Dorogovtsev SN, Goltsev AV, Mendes JFF(2010) Explosive percolation transition is actually continuous. Phys Rev Lett 105: 255701.
49. Gouyet JF(1988) Structure of diffusion fronts in systems of interacting particles. Solid State Ionics 28– 30: 72–81.
50. Hader A, Memsouk A, Boughaleb Y (2002) Universality in diffusion front growth dynamics. Eur Phys J B 28: 315–319.
51. Achlioptas D, D’Souza RM, Spencer J(2009) Explosive percolation in random networks. Science 323: 1453–1355.
52. Riordan O, Warnke L(2011) Explosive percolation is continuous. Science 333: 322–324.