Reprodutibilidade do teste de sobrecarga hídrica realizado em diferentes
horários do dia
This paper was conducted at the Glaucoma Service, State University of Campinas - UNICAMP - Campinas (SP) - Brazil.
1MD, Department of Ophthalmology - Universidade Estadual de Campinas UNICAMP Campinas (SP) -Brazil.
2MD, Department of Ophthalmology - UNICAMP - Cam-pinas (SP) - Brazil.
3MD, Department of Ophthalmology - Santa Casa de Sobral - Sobral (CE) - Brazil.
4Associate Professor - Universidade Estadual de Lon-drina - UEL - LonLon-drina (PR) - Brazil.
5MD, Department of Ophthalmology - UNICAMP - Cam-pinas (SP) - Brazil.
6MD, Department of Ophthalmology - UNICAMP - Cam-pinas (SP) - Brazil.
Correspondence address: Flavio Mac Cord Medina. Clínica São Vicente. Rua João Borges, 204 - Rio de Janeiro (RJ) CEP 22451-100
E-mail: [email protected]
The authors have no commercial interests in this article. Recebido para publicação em 27.04.2007
Última versão recebida em 03.03.2009 Aprovação em 16.03.2009
Nota Editorial: Depois de concluída a análise do artigo sob sigilo editorial e com a anuência do Dr. Francisco Eduardo Lopes de Lima sobre a divulgação de seu nome como revisor, agradecemos sua participação neste pro-cesso.
Flavio Mac Cord Medina1
Fabrício Kafury Pereira Rodrigues2 Paulo de Tarso Ponte Pierre Filho3 Tiemi Matsuo4
José Paulo Cabral de Vasconcellos5 Vital Paulino Costa6
at different times of the day
Keywords: Glaucoma; Tonometry, ocular; Reproducibility of results; Intraocular pressure; Diagnostic techniques and procedures
Purpose: To evaluate the reproducibility of water drinking test (WDT) performed at different times of the day, in primary open angle glaucoma
(POAG) patients and normal individuals. Methods: Fifteen patients
with POAG and 30 normal individuals underwent three WDTs at dif-ferent times of the day (7 AM, 12 PM, and 5 PM) on 3 difdif-ferent days. Test results in POAG patients and normal individuals were compared. Agreement and correlation of intraocular pressure (IOP) baseline levels, peak levels, and IOP change (peak IOP - baseline IOP) on tests perfor-med at different times were evaluated. Only right eye measurements
were analyzed. Results: Mean baseline IOP, peak IOP and IOP change
were significantly higher in POAG patients than in normal individuals, at all time intervals (p<0.05). The Bland-Altman analysis demonstrated limits of agreement for IOP peak levels and IOP changes larger than the clinically acceptable (>3 mmHg), even though Pearson’s test revealed
good correlation among the results. Conclusion: The mean IOP peak
and mean IOP change observed during WDT are significantly higher in POAG patients than in control individuals. Low levels of agreement among WDTs performed at different times of the day suggest a poor reproducibility of WDT, which may limit its applicability for the diag-nosis and follow-up of glaucoma.
ABSTRACT
INTRODUCTION
Intraocular pressure (IOP) is the main risk factor for the development
and progression of glaucoma and it varies during the day(1). Glaucoma
treatment, whether medicinal or surgical, aims at reducing IOP levels in order to prevent disease progression. IOP fluctuation has been shown to be
important for the diagnosis, treatment and prognosis of glaucoma(2-3).
The fact that undetected IOP peaks during routine examinations were related to progression of visual field loss emphasized the value of the
diurnal tension curve (DTC) in the management of glaucoma patients(4).
However, the DTC is considered troublesome by the physician and uncom-fortable for the patient. Therefore, there have been efforts to find alterna-tive methods of detecting IOP spikes.
In the past, water drinking test (WDT) was frequently used to diagnose
glaucoma patients(5). The mechanism by which the WDT increases the IOP
osmolarity were responsible for the increase in IOP(5-6). An in-crease in blood osmolarity reduces aqueous humor (AH) pro-duction and drainage, whereas a repro-duction in blood osmola-rity (as seen during WDT) increases the production and
drai-nage of AH(7). In 1960, Drance observed that, similarly to
normal individuals, glaucomatous patients responded to re-duced blood osmolarity with an increase in AH production, but AH drainage did not increase enough to maintain
adequa-te IOP levels in 64% of eyes with glaucoma(8).
Subsequent studies(9-10) revealed low sensitivities and
spe-cificities of WDT for the diagnosis of glaucoma. In one publi-cation, 38.4% of 13 normal individuals undergoing WDT wed an increase in IOP greater than 8 mmHg and 30.7%
sho-wed peak IOPs higher than 24 mmHg(9). In another study,
WDT results were found to be similar among normal, ocular
hypertensive, and glaucomatous individuals(10).
For these reasons, WDT has been virtually abandoned until recently, when a series of studies suggested that the WDT could be employed not as a diagnostic test, but rather as a tool
to assess IOP peaks and changes(11-13). After performing the
WDT, the mean IOP peak and IOP change were found to be significantly higher in a group of patients that exhibited pro-gression of visual field defects than in a group that did not
progress(11). Moreover, patients surgically treated for
glauco-ma demonstrated sglauco-maller IOP changes after the WDT, when
compared with clinically treated patients(13).
However, there are no studies in the literature evaluating the variability of WDT in relation to time of performance. Hence, the purpose of this study was to investigate the repro-ducibility of WDT at different times of the day in normal individuals and patients with primary open angle glaucoma (POAG).
METHODS
The study sample consisted of 15 individuals with POAG consecutively selected from the Glaucoma Sector of the State University of Campinas, and 30 normal individuals recruited from volunteers of the community, institution staff, and spou-ses or friends of patients. The study was approved by the Ethics Committee of the State University of Campinas and conducted according to the tenets of Declaration of Helsinki
and Health National Council resolution nº 196/96.
All individuals underwent an ophthalmologic exam that included best-corrected visual acuity, slit-lamp examination, Goldmann applanation tonometry, gonioscopy using Zeiss lens, optic disc assessment with a 78-diopter lens under dilated pupils, and automated achromatic perimetry (24-2 program, Sita Standard Strategy, Humphrey Field Analyzer 750, Hum-phrey-Zeiss, Dublin, CA, EUA).
All recruited participants were 18 years or older, had cor-rected visual acuity better than 20/40 in one eye, and spherical
equivalent ≤ ±5 diopters. Individuals with POAG were defined
as having: history of IOP more than or equal to 21 mmHg in at
least one eye before onset of treatment, gonioscopy revealing an open angle, presence of typical visual field glaucoma
de-fects (determined by one of Anderson’s criteria)(14), and optic
disc showing a localized defect of the neuroretinal rim,
cup-to-disc ratio ≥ 0.6, optic disc hemorrhage, or cup-to-disc ratio
asymmetry > 0.2(15). Normal individuals have normal optic discs
(cup-to-disc ratio ≤ 0.3 with no localized defects in
neurore-tinal rim), open angles at gonioscopy, IOP less than 21 mmHg on two different days, and no visual field defects. Exclusion criteria included: pregnancy, previous ocular surgery or laser, retinal diseases, corneal scars, neurological pathologies that could influence visual field, and incapacitating systemic di-sease (cerebral vascular didi-sease, senile dementia, severe heart failure). Patients presenting advanced glaucoma also were excluded from this study because of the risk of worsening of visual field defects in the period of hypotensive therapy dis-continuation.
Required washout periods before the first WDT were 4
weeks for β-adrenergic antagonists and prostaglandins
ana-logues, 2 weeks for adrenergic agonists, and 5 days for choli-nergic agonists and carbonic anhydrase inhibitors. A safety check with IOP measurement was required after 2 weeks for all patients undergoing a 4-week washout. At that time, patients whose IOPs had risen to levels deemed to be detrimental were excluded from the study.
The water drinking test consisted of: 1. A six-hour period of fasting. 2. Initial IOP reading.
3. Intake of one liter of water during a period of not more than five minutes.
4. After drinking water, IOP was measured every 15 minu-tes for one hour.
Each patient performed the WDT at three occasions at different times of the day (7:00 h, 12:00 h and 17:00 h). The interval between each WDT was 1 week. The same calibrated Goldmann’s tonometer was used for all IOP measurements. The same observer, masked to patient’s diagnosis and masked to previous IOP measurements obtained at different WDTs, performed all IOP measurements.
The Student’s t test was used to compare continuous
va-riables between groups, the Fisher’s exact test was used to compare categorical data, and analysis of variance for repea-ted measures was used to compare IOP measurements within the same group. A p-value of less than 0.05 was considered statistically significant.
Bland-Altman analysis was applied to assess the agree-ment between IOP peaks and IOP changes (peak IOP - baseline
IOP) obtained at different timings(16). The linear regression
Data were analyzed using the GLM procedure of SAS (SAS Inst., Inc., Cary, NC).
RESULTS
Demographic characteristics of glaucoma patients and normal individuals are shown in Table 1. Both groups had similar demographic characteristics, except for race. White individuals were more frequent in normal individuals (83.3%) than in glaucoma patients (53.3%).
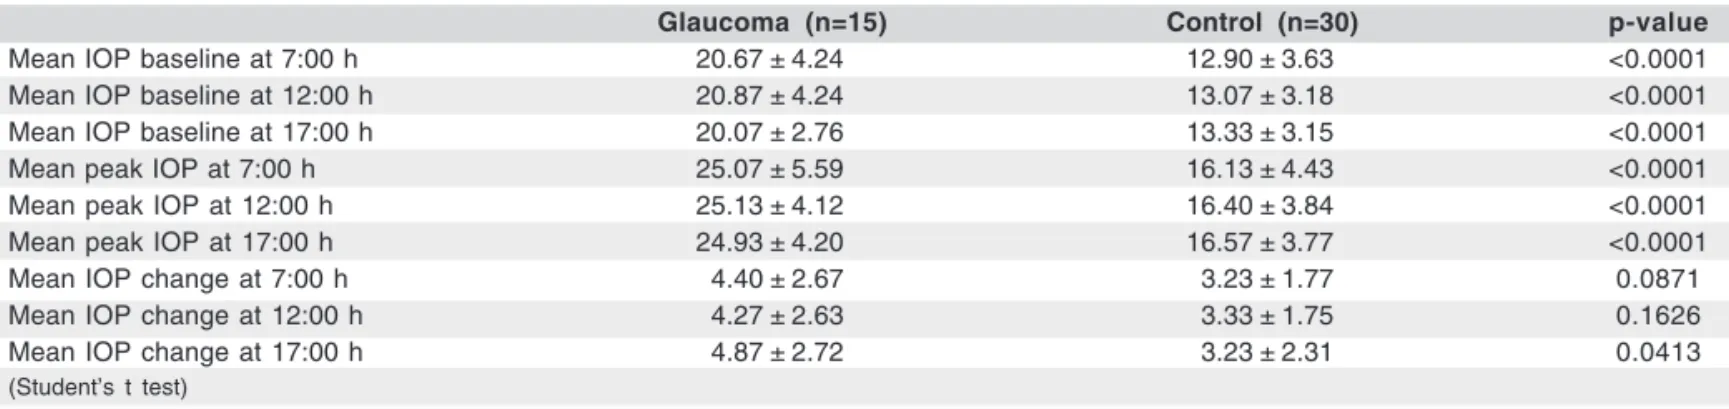
The mean IOPs at baseline (before the WDT) and mean peak IOPs obtained during the WDT were significantly higher in POAG patients than in normal individuals at all time in-tervals (p<0.0001). The mean IOP changes during the WDT showed a tendency towards a higher level in POAG patients when the test was perfomed at 7:00 h and 12:00 h and pre-sented a statistically significant higher level in glaucoma pa-tients than in normal individuals when the WDT was per-formed at 17:00h. There were no statistically significant dif-ference among mean IOP peaks (p=0.962) and mean IOP chan-ges (p=0.690) at the different timings in glaucoma patients. Also, there were no statistically significant difference among mean IOP peaks (p=0.670) and mean IOP changes (p=0.964) at the different timings in normal individuals (Table 2).
We evaluated the frequency of individuals showing dif-ferences in IOP peaks and IOP changes greater than or equal
to 3 mmHg between the timings. Differences ≥ 3 mmHg
among IOP peak levels at different tests were found in 20% of glaucoma patients and 23% of normal individuals.
Diffe-rences ≥ 3 mmHg among IOP changes at different tests were
found in 40% of glaucoma patients and 13% of normal in-dividuals.
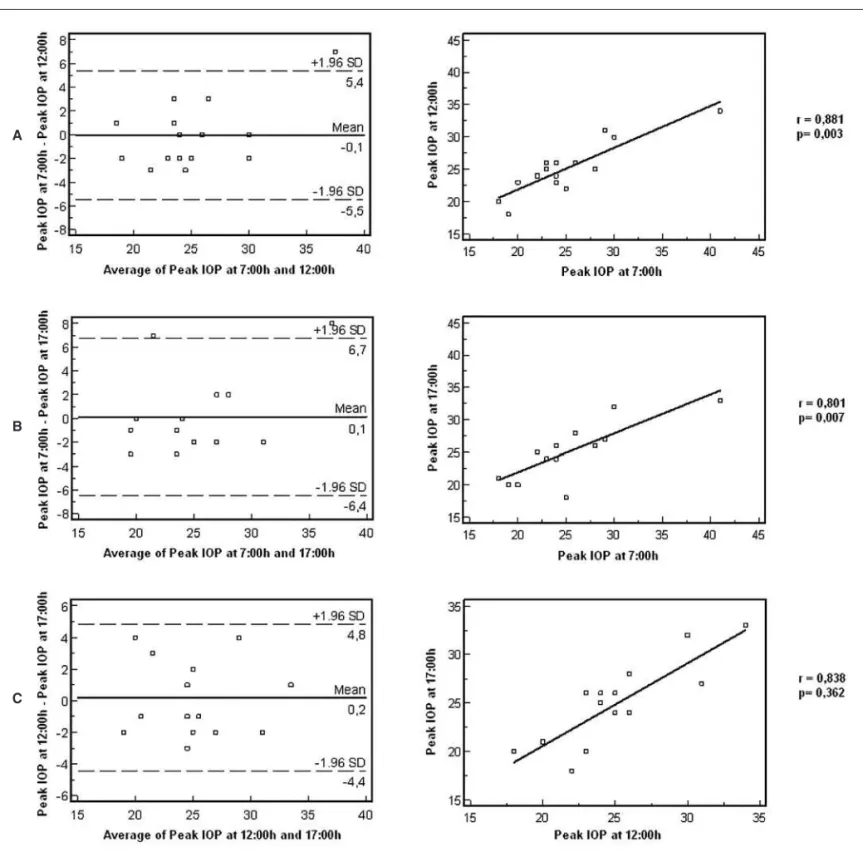
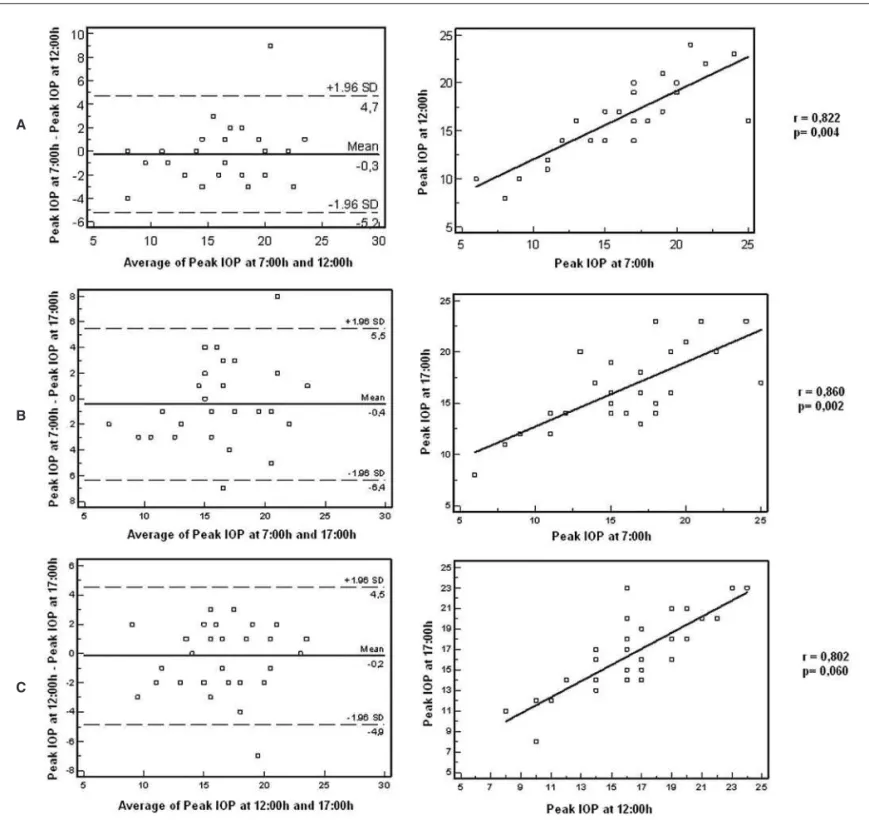
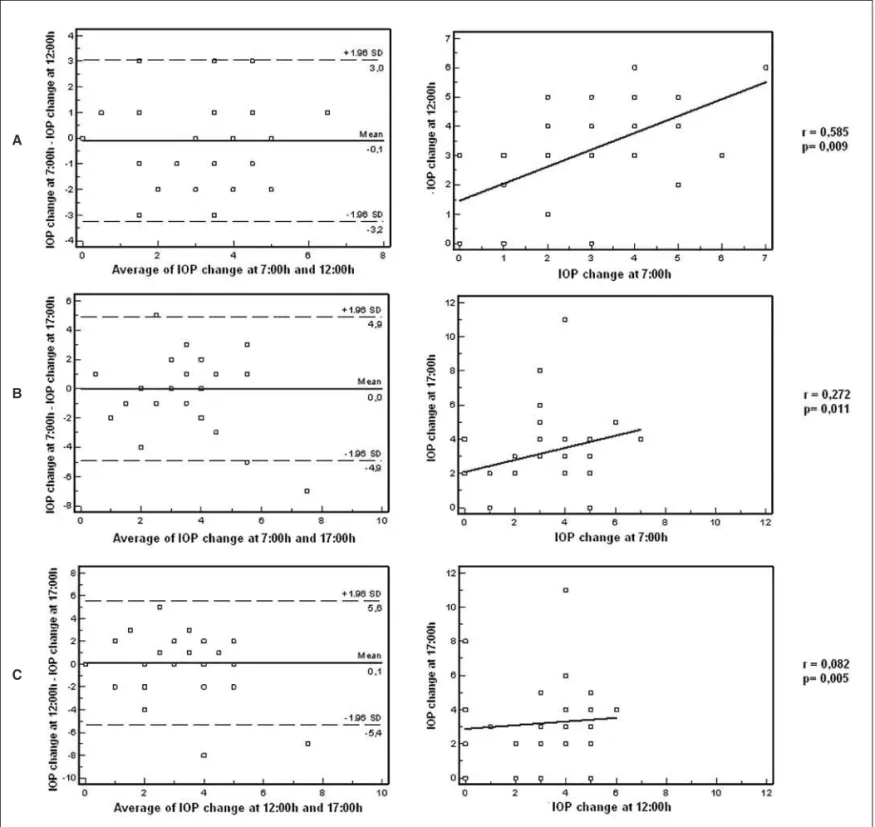
The linear regression analysis applied to IOP peaks at different times in each individual revealed strong correlations for POAG and normal individuals, with r values varying between 0.80 and 0.88 (Figures 1 and 2). The linear regression analysis applied to compare IOP changes at different times in each individual revealed weak to moderate correlations for POAG and normal individuals, with r values ranging between 0.08 and 0.58 (Figures 3 and 4).
Bland-Altman plot demonstrated high vertical dispersion of points and limits of agreement calculated for both IOP peak levels and IOP changes were larger than the clinically accep-table (>3 mmHg), for POAG patients and normal individuals (Figures 1 to 4).
DISCUSSION
IOP is the main risk factor for the development and pro-gression of glaucoma. The DTC is currently the most valid diagnostic method to assess the IOP behavior throughout the day. Attempts have been made to develop an alternative, more user-friendly test, capable of providing valuable infor-mation regarding IOP peak and fluctuation. A test designed to substitute the DTC in clinical practice should not only duplicate the IOP peak and IOP changes observed at a DTC, but also be reproducible, regardless of the time when it is performed.
The WDT was intended to represent an option for the detection of pressure spikes in glaucomatous patients who apparently have controlled IOPs. It is a test that can be easily performed and repeated several times without major
incon-veniences(17). Initially, some studies suggested that there was
a good correspondence between IOP peaks obtained in the
WDT and the maximum DTC values. Helal Jr(18) verified a
similarity between mean maximum IOP levels measured in the DTC and mean IOP peaks obtained with the WDT in 11 glau-coma suspects, indicating that this test could substitute the DTC. However, this study compared mean IOP values,
mas-Table 1. Demographic characteristics of glaucoma patients and normal individuals
Glaucoma (n=15) Control (n=30) p-value
Age (years) 55.7 ± 12.3 53.7 ± 13.4 0.641*
Gender % male 40.0% 50.0% 0.526†
Race % white 53.3% 83.3%
% black 46.7% 10.0% 0.021‡
% asian 0 6.7%
*= Student’s t test; †= Chi-square test; ‡= Fisher’s exact test
Table 2. Mean baseline IOP, IOP peak and IOP change (mmHg) for glaucoma patients and normal individuals at 7:00 h, 12:00 h, and 17:00 h
Glaucoma (n=15) Control (n=30) p-value
Mean IOP baseline at 7:00 h 20.67 ± 4.24 12.90 ± 3.63 <0.0001
Mean IOP baseline at 12:00 h 20.87 ± 4.24 13.07 ± 3.18 <0.0001
Mean IOP baseline at 17:00 h 20.07 ± 2.76 13.33 ± 3.15 <0.0001
Mean peak IOP at 7:00 h 25.07 ± 5.59 16.13 ± 4.43 <0.0001
Mean peak IOP at 12:00 h 25.13 ± 4.12 16.40 ± 3.84 <0.0001
Mean peak IOP at 17:00 h 24.93 ± 4.20 16.57 ± 3.77 <0.0001
Mean IOP change at 7:00 h 4.40 ± 2.67 3.23 ± 1.77 0.0871
Mean IOP change at 12:00 h 4.27 ± 2.63 3.33 ± 1.75 0.1626
Mean IOP change at 17:00 h 4.87 ± 2.72 3.23 ± 2.31 0.0413
king the differences in each individual’s measurements. In fact, in the present study, we also demonstrated that mean IOP peaks and mean IOP changes were not significantly different when we compared results of WDTs performed at different times of the day.
Miller(19) compared the peak IOPs obtained after the WDT
and the maximum IOPs measured in a DTC and concluded that there was significant relationship between them. However, the
analysis of the individual results allows us to disclose discre-pancies of up to 16 mmHg between the tests.
Bland and Altman suggested that the ideal approach to compare two methods of measurements is to evaluate the agreement between them, rather than comparing means or
verifying the existence of correlation between them(16). They
proposed the construction of a graphic that plots the diffe-rences between the two measurements versus the
arithme-A
B
C
A
B
C
Figure 2 - Bland-Altman and linear regression analysis of IOP peaks during the WDT in normal individuals comparing different time intervals (A: 7:00 h vs. 12:00 h; B: 7:00 h vs. 17:00 h; C: 12:00 h vs. 17:00 h)
tical mean of the two measurements for each tested indivi-dual. The purpose of this technique was to assess the dis-crepancies between the two measurements and calculate li-mits of agreement, which corresponds to the 95% confidence interval of the differences between the methods. Methods showing good agreement should display values close to zero and within the limits of the confidence interval. Moreover, limits of agreement should reflect differences that are not clinically important.
In our study, when measurements variability of each indi-vidual was assessed, a significant number of indiindi-viduals were found to present differences greater than or equal to 3 mmHg in both IOP peaks and IOP changes.
A
B
C
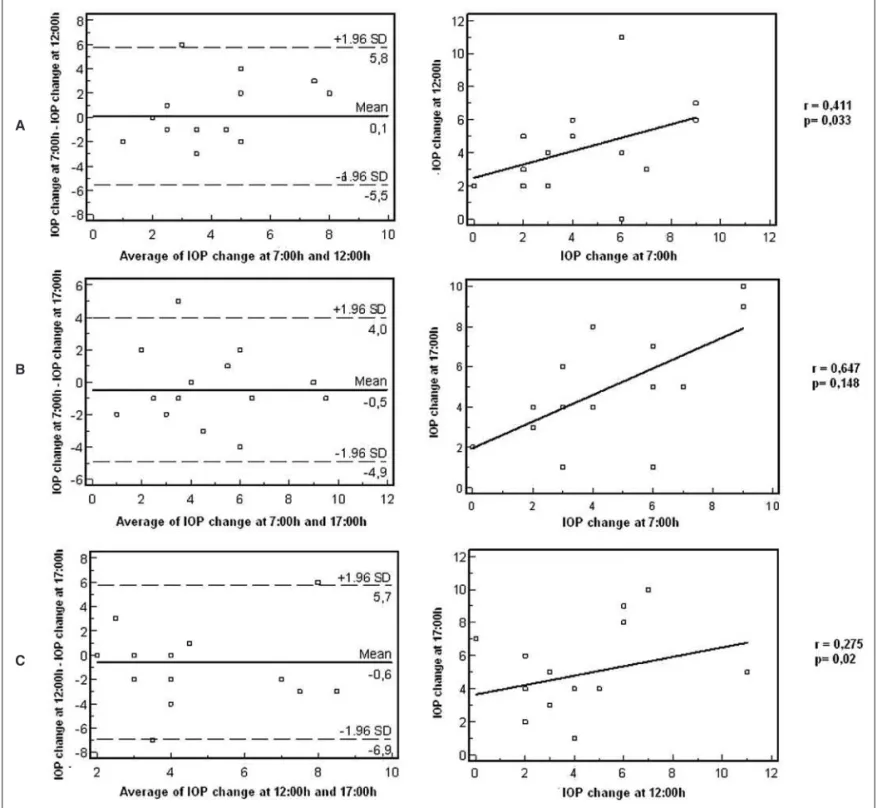
Figure 3 - Bland-Altman and linear regression analysis of IOP changes during the WDT in glaucoma patients comparing different time intervals (A: 7:00 h vs. 12:00 h; B: 7:00 h vs. 17:00 h; C: 12:00 h vs. 17:00 h)
IOP changes in different tests presented low to moderate correlation and limits of agreement also larger than the cli-nically acceptable (>3 mmHg), both in glaucoma patients and normal individuals.
Many factors can explain the large variability observed in the WDT. Variables such as previous hydration state, diurnal fluctuation in AH production and drainage, chan-ges in intestinal water absorption and renal clearance of water overload can justify the discrepancy of the results we obtained.
Figure 4 - Bland-Altman and linear regression analysis of IOP changes during the WDT in normal individuals comparing different time intervals (A: 7:00 h vs. 12:00 h; B: 7:00 h vs. 17:00 h; C: 12:00 h vs. 17:00 h)
A
B
C
However, the agreement between WDT results performed at different times of the day was poor.
The poor reproducibility of the WDT performed at diffe-rent times of the day represents a limitation to its applicability for the diagnosis and follow up of patients with glaucoma. Further studies are necessary to evaluate the agreement between IOP peaks obtained with the DTC and WDT applying the Bland-Altman analysis. It would also be interesting to apply the Bland-Altman analysis to DTCs performed in
dif-ferent days to evaluate the agreement between its results, as this test remains the gold standard to assess the IOP diurnal fluctuation and IOP peak.
ACKNOWLEDGEMENTS
RESUMO
Objetivo: Avaliar a reprodutibilidade do teste de sobrecarga hídrica (TSH) em diferentes horários em que é realizado, em pacientes com glaucoma primário de ângulo aberto (GPAA) e
em indivíduos normais. Métodos: Quinze pacientes com GPAA
e 30 indivíduos normais foram submetidos a três TSHs, realiza-dos em diferentes horários do dia (às 7:00 h, 12:00 h e 17:00 h), em três dias diferentes. Foram comparados os resultados dos testes em pacientes com GPAA e indivíduos normais. Foram analisadas a concordância e a correlação entre os valores de medida basal, pico e variação de pressão intraocular (PIO) (pico de PIO - PIO basal) nos testes realizados nos diferentes horá-rios. Apenas as medidas do olho direito foram analisadas.
Resultados: Os valores médios de medida basal, pico e varia-ção de PIO foram significativamente maiores nos pacientes glaucomatosos que nos indivíduos normais, em todos os ho-rários (p<0,05). A análise de Bland-Altman apresentou limites de concordância de pico e variação de PIO maiores do que o clinicamente aceitável (>3 mmHg), apesar de o teste de
Pear-son demonstrar boa correlação entre os resultados. Conclusão:
O TSH apresenta valores de pico e variações da PIO signifi-cativamente maiores em pacientes glaucomatosos que em indi-víduos normais. Os baixos níveis de concordância entre os TSHs realizados em diferentes horários do dia sugerem uma baixa reprodutibilidade do TSH, que pode limitar sua aplica-bilidade para diagnóstico e acompanhamento do glaucoma.
Descritores: Glaucoma; Tonometria ocular; Reprodutibili-dade dos testes; Pressão intraocular; Técnicas e procedimen-tos diagnósticos
REFERENCES
1. Ziemer RC. Circadian variations in intraocular pressure. In: Ritch R, Shields
MB, Krupin T, editors. The glaucomas. 2nd ed. St. Louis: Mosby; 1996. v.1.
cap. 21.
2. Susanna Júnior R, Betinjane AJ, Onclinx TM, Biral EL, Barbosa WL. Avalia-ção da pressão intraocular em olhos glaucomatosos com pressão intraocular normalizada pelo tratamento. Rev Bras Oftalmol. 1995;54(11):837-41. 3. Saccà SC, Rolando M, Marletta A, Macrí A, Cerqueti P, Ciurlo G.
Fluc-tuations of intraocular pressure during the day in open-angle glaucoma, normal-tension glaucoma and normal subjects. Ophthalmologica. 1998;212(2): 115-9.
4. Ziemer RC, Wilensky JT, Gieser DK, Viana MA. Association between intrao-cular pressure peaks and progression of visual field loss. Ophthalmology. 1991; 98(1):64-9. Comment in: Ophthalmology. 1991;98(9):1323.
5. Leydhecker W. The water-drinking test. Br J Ophthalmol. 1950;34(8):457-79. 6. Winder AF, Siddiqui AA, Donovan HC. Ocular hypertension and systemic
responses to water-drinking test. Br J Ophthalmol. 1978;62(6):414-9. 7. De Roetth A Jr. Effect of changes in osmotic pressure of blood on aqueous
humor dynamics. AMA Arch Ophthalmol. 1954;52(4):571-82.
8. Drance SM. The significance of the diurnal tension variations in normal and glaucomatous eyes. Arch Ophthalmol. 1960;64:494-501.
9. Susanna Júnior R, Campagna CM. Sobrecarga hídrica: sua importância no diagnóstico do glaucoma. Rev Bras Oftalmol. 1988;47(3):157-8.
10. Roth JA. Inadequate diagnostic value of the water-drinking test. Brit J Ophthal-mol. 1974;58(1):55-61.
11. Susanna R Jr, Vessani RM, Sakata L, Zacarias LC, Hatanaka M. The relation between intraocular pressure peak in the water drinking test and visual field progression in glaucoma. Br J Ophthalmol. 2005;89(10):1298-301. 12. Susanna R Jr, Medeiros FA, Vessani RM, Giampani J Jr, Borges AS, Jordão
ML. Intraocular pressure fluctuations in response to the water-drinking pro-vocative test in patients using latanoprost versus unoprostone. J Ocul Pharmacol Ther. 2004;20(5):401-10.
13. Medeiros FA, Pinheiro A, Moura FC, Leal BC, Susanna R Jr. Intraocular pressure fluctuations in medical versus surgically treated glaucomatous patients. J Ocul Pharmacol Ther. 2002;18(6):489-98.
14. Anderson DR, Patella VM. Automated static perimetry. 2nd ed. St Louis: Mosby
Year Book; 1999.
15. Varma R, Spaeth GL, editors. The optic nerve in glaucoma. Phidelphia: J. B. Lippincott; 1993.
16. Bland JM, Altman DG. Measuring agreement in method comparison studies. Stat Methods Med Res. 1999;8(2):135-60. Review.
17. Carvalho CA, Helal Júnior J. Valor da prova de sobrecarga hídrica no segui-mento de pacientes com glaucoma crônico simples em tratasegui-mento. Rev Bras Oftalmol. 1988;47(2):81-4.
18. Helal Júnior J. Contribuição ao estudo da pressão intraocular: picos de pressão intraocular na curva diária de pressão e na prova de sobrecarga hídrica. Rev Bras Oftalmol. 1988;47(2):75-80.