Variations
in Estimates of Guatemalan Infant
Mortality,
Vaccination
Coverage, and ORS
Use Reported by Different
Sources1
BARTON
R.BURKHALTER,*
ROY I.MILLER,~ LEISER SILVA,~
& ELIZABETH BURLEIGH~
All available estimates
of
rates of infant mortality, vaccination coverage (for BCG, DPT 3, polio 3, measles, and tetanus toxoid), and ORS use in Guatemala in the 1980s were identified and investigated. A large number of sources and estimates were found. Large discrepancies were also found between the estimates for a given indicator, even when the estimates were reported for the same year by the same source. For instance, reports for 2985 yielded 70 different infant mortality estimates ranging from 56.0 to 79.8 deaths per 1 000 live births; vaccination coverage estimates ranging from 30% to 60.5% for BCG, 3.5% to 34.2% forDPT 3, 3.5% to 33.5% for polio 3, 11% to 58.2% for measles, and 1% to 8.2% for tetanus toxoid; and estimated use rates of oral rehydration solution ranging from 3.5% to 7.2%. In this same vein, three Guatemalan Ministry of Health estimates of infant deaths per 1 000 live births in 1984 ranged from 52.4 to 79.8; four UNICEF estimates for 1985 ranged from 65 to 79.8; and three USAID estimates for 1987 ranged from 59 to 72. The many reasons found for this diversity point to significant problems influencing the reliability of
current data.
N
ational governments and interna- tional agencies have assigned in- dicators such as infant mortality, vacci-nation
coverage, and
oral rehydration use an important role in their efforts to pro- mote child survival. Global and national targets have been set in terms of such* selected
indicators. Programs have
beenmonitored and evaluated on the basis of
changes in the values of these indicators.
Most important, programs have been
modified and donor agency financial
support has been given or withheld in
response to observed trends in a few im- portant indicators. Accordingly, it is im- portant to identify, understand, and dis- cuss variations in the reported values of
such indicators
and to advise policy mak-‘The work reported here was carried out under the auspices of the Center for International Health In- formation, a project of the Office of Health, U.S. Agency for International Development (USAID), and was supported financially by the Health, Pop- ulation, and Nutrition Division of the Office of Development Resources, Bureau for Latin America and the Caribbean, USAID, as part of the Central America Initiative (Project No. 936-5959.13, PIOfI 9653201, Contract No. DPE-5951-Z-00-8004-00) and by the USAID Office of Health BASICS Project (Project No. 24-2650-00, Contract No. HRN-6006- C-00-3031-00). This article will also be published in Spanish in the Bolefin de la Oficina Sanitaria Pan- americana, Vol. 118,1995. Reprint requests and other
correspondence should be addressed to Barton R. Burkhalter, BASICS Project, 1600 Wilson Blvd., Arlington (Rosslyn), VA 22209, USA.
%enior Program Officer, BASICS Project, Academy for Educational Development, Washington, D.C., U.S.A.
3Technical Director, Center for International Health Information (ISTI), Rosslyn, Virginia, U.S.A. 4Director of Information Systems, Institute of Nu-
trition of Central America and Panama (INCAP), Guatemala City, Guatemala.
5Director, Maternal and Child Survival Project (PROSAMI), Medical Services Corporation Inter- national, San Salvador, El Salvador.
ers of the risks as well as the benefits of
making decisions based on apparent
trends in these values.
Scientists, governments, and interna-
tional agencies have used a variety of methods to estimate the values of key indicators. Each method has its strengths
and weaknesses. For example, infant
mortality estimates can be derived using either direct methods (calculating directly from the data) or indirect methods (cal-
culating from a demographic model that
processes the data according to accepted
mathematical conventions); and they can
be derived using data from various
sources-vital events registration sys-
tems, surveys, or censuses. Vital events registration systems have been criticized for containing biased data, because they do not capture all births and deaths; sur- vey data have been criticized for involv- ing only small samples; and some esti- mates have been criticized for using direct rather than indirect methods (2). Simi- larly, methods employed to estimate rates of oral rehydration use have been criti- cized for various reasons-including
adoption of nonstandard definitions of
“diarrhea” and “diarrhea episode” (2,3), variations in the definition of “proper” use of oral rehydration solution and the length of the recall period (3), and vari- ations in the manner of questioning in- formants (3). However, little attention has been given to problems arising from the use of secondary data and perpetuation of errors found therein.
In most cases, the values retrieved from
published and unpublished sources pro-
duce multiple choices regarding the “cor- rect” value of a given indicator. Con- fronted with the problem of reporting a single trend for each of various selected indicators to policymakers, the authors set out to explore the reasons for the ap- pearance of multiple and, at times, con- flicting values for the indicators. This ar- ticle reports all of the values discovered for rates of infant mortality, vaccination
coverage, and oral rehydration use in one country, Guatemala, in the 1980s and dis- cusses some of the theoretical and prac- tical reasons for the observed variations in these values over time and across sources. Part of that discussion illustrates
how organizations contribute to such
variation by incorrectly citing, using, and reporting estimates from other sources.
METHODS
The initial data search was carried out during 1987- 1988 in both Guatemala and
Washington, D.C., and a second round
of searching was done at both locations during 1990-1992. Besides exploring the
standard reference sources, interviews
were held with representatives of various
private, government, and international
organizations in both places (4).
Most of the unpublished estimates
identified during the first round of data collection were verified against the orig- inal source documents during the second round, although this was not possible in a few cases. These latter estimates have been retained, but the fact that they are
unverified has been noted in the data
tables. In all cases efforts were made to
determine the sources, definitions, and
procedures used to make the estimate, as well as to find reasons for apparent in- consistencies or disagreements with other estimates. These efforts were successful in many but not all of the cases.
INFANT
MORTALITY:
TRENDS
AND VARIATIONS
Measuring
Infant Mortality
The infant mortality rate (IMR) is de- fined as the number of infant deaths per 1 000 live births in a specified geographic area. This rate can reflect either the ratio of infant deaths to live births occurring over a specified time period or the prob- ability of a newborn infant dying prior to
its first birthday. Theoretically, these two sorts of calculations yield the same value when the numbers of births and infant deaths are stable over time, but not when the population is growing. The time pe- riod over which data are collected may be as short as a year, but is more com-
monly a longer period-usually three or
five years.
In practice, two general methods are used in the developing world to estimate IMIC a direct method in which births and
deaths over a given time period are
counted and a ratio is derived that ex- presses the number of infant deaths per thousand live births; and an indirect method in which information about births,
deaths, migration, and other demo-
graphic factors is entered into a mathe- matical model to generate an estimate. Most such models generate estimates in the form of a time trend. The data needed to apply either method can come from two general types of sources: surveys
(which include censuses, sample sur-
veys, and special studies) or vital events registries.
IMRs in Guatemala
The IMR estimates found for Guate- mala were derived using both methods (direct and indirect) and both types of data sources (vital events registries and surveys). In some cases the documents
containing these estimates provided no
information about the source of the data or the method used to derive the esti- mates. As might be expected, the various estimates were spread over a range of
values that was rather large-so large,
in fact, that an individual seeking a de- finitive IMR estimate for any particular point in time would find only bewilder- ment.
Part of this variation appears due to the technical issues cited above, includ- ing the following:
different methods of estimation (di- rect and indirect);
different sources of data (registries, censuses, and surveys);
when employing indirect methods,
use of different models and analyses of the available empirical informa- tion; and
use of different time periods.
As in many other countries, the Gua- temalan situation is further complicated
because different organizations tend to
engage in what amounts to poor report- ing of what are essentially the same data. In particular, once a data-generating event such as a survey or census takes place, the results of that event filter into differ- ent organizations at different times, and the time of the information may be er- roneously reported as the time when the organization received the data rather than the time when the data were collected. Moreover, various other timing errors of this sort can happen, the most egregious
occurring when an estimate is ascribed
to the year of the estimate’s publication rather than to the year when the data
were collected. More understandable is
the attribution of a multi-year estimate to the final year or (even less objectionable) to the midpoint of the multi-year range.
Finally, because the IMR is used in a political as well as a technical context, some estimates are distorted to empha- size political objectives. Overestimates may be generated for the benefit of the
donor community, as a means of stim-
ulating additional technical and/or finan- cial assistance; or underestimates may be generated for public consumption at home to convey the impression that conditions are improving.
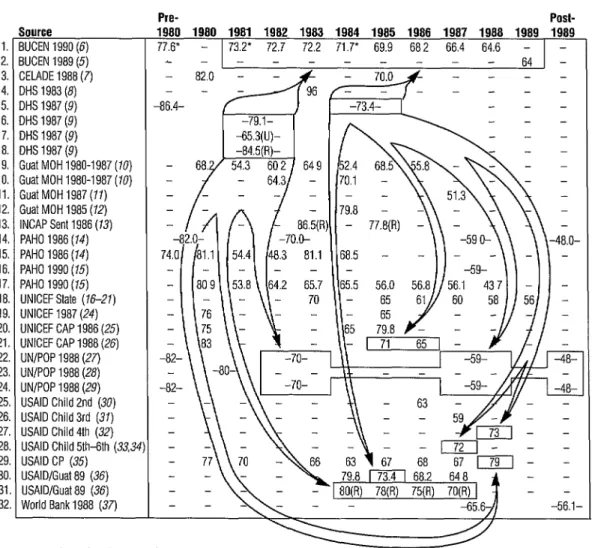
Figure 1 shows all the sources and es- timates of IMR in Guatemala in the 1980s that were found by this study (5-36). It turns out that various types of organi- zations provide estimates of IMR trends
1.
2. 3. 4. 5. 6. 7. 8. 9. 10. 11. 12. 13. 14. 15. 16. 17. 18. 19. 20. 21. 22 23 24 25 26 27 28 29 30 31 32
Figure 1. Infant mortality rates (per 1 000 live births) in Guatemala, as reported by various sources. Arrows indicate first-level dissemination of 1987 DHS estimates, showing how these estimates influenced numbers disseminated by others.
Source 3UCEN 1990 (6) 3UCEN 1989
i5j
:ELADE 1988 (7) IHS 1983 (8) IHS 1987 (9) IHS 1987 (9) DHS 1987 (9) QHS 1987 (9)3uat MOH 1980-1987 (10) :uat MOH 1980-1987 (70) Gust MOH 1987 (11) Gust MOH 1985 (12) INCAP Sent 1986 (13) PAHO 1986 (14) PAHO 1986 (14) PAHO 1990 (15) PAHO 1990 (75) UNICEF State (76-21) UNICEF 1987 (24) UNICEF CAP 1986 (25) UNICEF CAP 1988 (26) UN/POP 1988 (27) UN/POP 1988 (28) UN/POP 1988 (29) USAID Child 2nd (30) USAID Child 3rd (37) USAID Child 4th (32) USAID Child 51h-6th (33,34 USAID CP (35)
USAID/Guat 89 (36) USAID/Gual89 (36) World Bank 1988 (37)
Notes (keyed to line
Pre- POSb
1980 1980 1981 1982 1983 1984 1985 1988 1987 1988 1989 1989
77.V - 73.2. 72.7 72.2 71.7* 69.9 682 66.4 64.6 - - L - - - _ _ 64 -
// - 64.3/ - 1 170.1 - \\~ \ \v
numbers):
1. The figure 77.6 is for the 2-year period 1979-1980; “benchmark” years with asterisks based on vital registration data.
2. Table 8, p. 60.
3. Unverified field reporting of data. 4. Unverified field reporting of data.
5. Table 2.1, p. 7; figures for S-year periods beginning 1 January 1977 and 1 July 1982. 6. Table 2.2, p. 9; figures for lo-year period, 1 July 1977-30 June 1987.
7. Table 2.2, p. 9; figures for lo-year period, 1 July 1977-30 June 1987. U = urban data.
8. Table 2.2, p. 9; figures for lo-year period, 1 July 1977-30 June 1987. R = rural data.
9. Unverified 1980-l 986 data copied in field.
10. The two figures, copied in field for 1982 and 1984, are unexplained.
11. Infant deaths in the calendar year multiplied by 1 000, divided by live births in the calendar year, as
reported in the civil register for that calendar year.
12. Unverified field reporting of data.
13. Table 18b (TrusselI variant, West model); 1983 figure (86.5) based on Feeney method, 1985 figure
(77.8) based on Bass method. R = rural data.
14.
15. 16.
17.
18.
19. 20. 21. 22.
23. 24.
25. 26. 27. 28.
29.
30. 31. 32.
Vol. I, p. 392, from UN/POP 1988 (29), medium variant; figures for 5-year periods beginning mid-
1975, mid-1980, mid-l 985, and mid-l 990 (source denotes these 5-year periods as 1975-I 980, 1980-
1985, etc.).
Vol. I, p. 394, from official government statistics (p. 177); first figure (74.0) is for 1979.
Vol. I, p. 53; figure for 5-year period beginning mid-l 985 (source denotes this 5-year period as 1985-
1990).
Vol. I, pp. 303, 334; 1987 and 1988 figures “provisional”; from official data in PAHO technical
information system.
Figure for 1983 from p. 141, reference 16; for 1985, p. 90 (17); for 1986, p. 64 (78); for 1987, p. 94
(79); and for 1988, p. 102 (20).
Guatemala table, no page no.; source is United Nations Population Division.
Unverified field reporting of data.
Unverified field reporting of data.
Table A.2; figures are for the 5-year periods beginning mid-l 975, mid-1980, mid-1985, and mid-1990
(source denotes these 5-year periods as 1975-l 980, 1980-I 985, etc.).
Table 50, p. 122; figure, for 1980-1981, based on complete vital registration data and census.
Table 16, pp. 121-I 22, medium variant; figures are for the 5-year periods beginning mid-l 975, mid-
1980, mid-l 985, and mid-l 990 (source denotes these 5-year periods as 1975-l 980, 1980-l 985,
etc.).
Pages 68, 86; from United Nations, World Population Prospects: 1984 (28).
Pages 58, 70; from United Nations, World Population Prospects: 7984 (28).
Pages 74, 88; from DHS 1987 (9).
References 33 (on pp. 98, 114, and 116) and 34 (on pp. 66, 86, and 89) both report the same figure;
from DHS 1987 (9).
Figures are from the following annual reports: for 1984, FY86 report, p. 86; for 1985, FY87, p. 6; for
1986, FY88, p. 8; for 1987, FY89, p. 8; for 1988, FY90, p. 10. Figures for 1980, 1981, and 1983
(from the FY82, FY83, and FY85 reports) were copied here without verification. The FY 91 CP (p. 277)
notes that all IMR estimates in the CP were obtained from the U.S. Census Bureau.
Based on national estimates.
Based on rural data (R) from the Sentinel Areas Survey (INCAP Sent 1986-33).
Page 118; the figures are for 5-year periods beginning mid-1985 and mid-l 990 (source denotes these 5-
year periods as 1985-1990 and 1990-1995).
in Guatemala. The Ministry of Health
(MOH) furnishes annual estimates on be- half of the Government (10, II). Two in-
ternational organizations doing health
work in Guatemala, PAHO (14, 2.5) and UNICEF (26-26), publish IMR estimates.
The U.S. Agency for International De-
velopment (USAID) makes several of its
own estimates or selects estimates from other sources (30-36). Other institutions
publishing estimates include the World
Bank (37), the United Nations Population
Office (27-29), and the U.S. Census
Bureau (5-6).
Various organizations published es& mates derived from other sources. For
example, the Latin American Demo-
graphic Center (CELADE) developed its
own estimates based on all available
sources (7).
In addition, several organizations pub- lished multiple estimates for the same year that disagreed with one another. For ex- ample, three 1984 MOH estimates of IMR (10, 22) ranged from 52.4 to 79.8, four 1985 UNICEF estimates ranged from 65 to 79.8 (17,24-26), and four 1987 USAID estimates ranged from 59 to 72 (32, 33-
36).6
These organizations used several dif-
ferent original sources of data to make their estimates of IMR. The Ministry of
Health obtained the number of infant
deaths and the number of live births in each calendar year from the official civil registries. The U.S. Census Bureau, U.N.
6Throughout this article the infant mortality rate
(Im) is reported as the number of infant deaths per 1 000 live births.
Population Office, and CELADE used in-
direct methods that employed official
census data. In addition, use was made of several different sample surveys com- pleted in Guatemala during the 1980s that provided useful data for estimating IMR as well as IMR estimates of their own.
Specifically, two national Demographic
and Health Surveys (DHS) were carried out in 1983 and 1987 (8, 9), and two sur- veys of rural sentinel villages were con- ducted jointly by INCAP and the Min- istry of Health in 1983 and 1987 (13, 38).
The 1983 and 1987 Demographic and
Health Surveys and the 1983 INCAPMOH survey all provided their own IMR esti- mates.
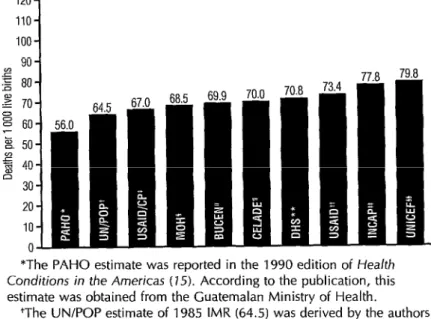
Figure 2 demonstrates the range of es- timates encountered in this study for a single year, 1985. (That year was selected because it had the largest number of es- timates and sources of any 1980s year.) The range extends from 56.0 to 79.8, a difference of nearly 24 deaths per 1 000 live births.
The high extreme of the 1985 range (79.8), which was drawn from UNICEF’s 1986 annual report for the country, ap- pears to have originated with a Ministry of Health study (12) on services to mothers and infants that was published in 1985. In fact, the same 79.8 figure is cited by three sources: the MOH mother/infant study cites it for 1984, the 1986 UNICEF country report (25) cites it for 1985, and
the 1989 USAID/Guatemala annual re-
port (36) cites it for 1984. While it is pos-
sible that the MOH mother/infant study
was influenced by the 1983 sentinel vil- lages study published in 1986 (13), which reported a rural IMR of 86.5 for 1983, it is unlikely that the results reported for earlier years by the 1987 Demographic and Health Survey (DHS) (9) were a factor in determining the 79.8 figure. The two 1985 estimates of IMR for rural popula- tions-77.8 and 78, see Figure 1, INCAP
Sent (13) and USAID/Guat (36)-are also
close to the top of the range.
The low extreme of the 1985 range (56.0) was reported by PAHO in its 1990 Health
Conditions in the Americas (14).
According to PAHO, this figure was copied from official country statistics based solely on civil registry data, and thus was not in- fluenced by DHS results or other special studies. Estimates obtained by indirect methods, such as those reported by the U.S. Census Bureau (5, 6), U.N. Popu- lation Office (27-29), and CELADE (7), fell between the two extremes of the range.This 1985 pattern is more or less re-
peated throughout the decade. That is,
one finds a wide range of IMRs, with estimates based on surveys and special studies (especially of rural populations) near the top of the range, estimates based on indirect methods in the middle of the
range, and estimates based on direct
methods toward the bottom of the range. As Figure 1 indicates, we did find excep- tions to this pattern, notably the high 1983 DHS estimate of 96 (8) and the high PAHO estimate of 81.1 reported for both 1980 and 1983 (24). The reasons for these exceptions are not known.
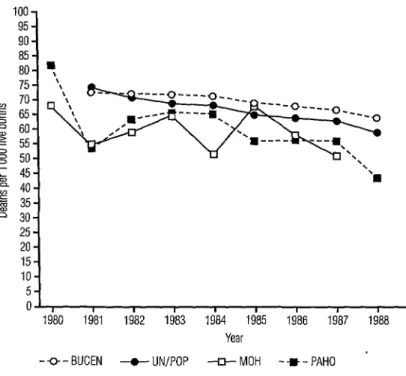
Figure 3 displays time trends from four sources: the U.S. Census Bureau (6), U.N.
Population Office (29), PAHO (14, 15),
and the Guatemalan Ministry of Health
(10, II). Both the Census Bureau and the
Population Office relied on indirect
methods to generate these time trends;
therefore, the curves tracing the two
trends are relatively smooth. Clearly, the U.N. model is the more optimistic of the two. On the other hand, the MOH ob- tains the number of live births and infant deaths for a given calendar year as re- ported in the official civil registry and divides the deaths by the live births. This direct method yields a trend that is ir- regular and generally well below the first two estimates. The lowness of these MOH estimates appears due to large-scale un- derreporting of infant deaths in the civil
registry, an underreporting problem
clearly identified by the MOH on page
Figure 2. The range of Guatemalan infant mortality estimates found for the year 1985, showing the source of each estimate within the column.
1201
90 g 80
2 70 E 60 E 50 $ 40 o 30 20 10 0
*The PAHO estimate was reported in the 1990 edition of Health Conditions in the Americas (15). According to the publication, this estimate was obtained from the Guatemalan Ministry of Health.
+The UN/POP estimate of 1985 IMR (64.5) was derived by the authors from the two S-year IMR estimates beginning in mid-l 980 and mid-l 985 in World Population Prospects: 1988 (29), using a linear interpolation between the midpoints of the two S-year estimates.
*The USAIDKP estimate, reported in the agency’s 1987 Congressional Presentation (35), is based on U.S. Census Bureau estimates.
§The MOH estimate was reported in Anuarios Estadisticos (1980- 1987) (10).
“The BUCEN estimate, reported by the U.S. Bureau of the Census printout furnished in 1990 (6), was one in a series of annual estimates.
TThe CELADE estimate was reported in la Mortalidad en la Nitiez en CentroamPrica, Panamii y Belize (7).
**The DHS estimate of 1985 IMR (70.8) was derived by the authors from the two S-year IMR estimates beginning in mid-1977 and mid-1982 in Encuesta de Planificacibn familiar y Salud Maternal lnfantii de Guatemala 1983: lnforme Final (8), using a linear extrapolation from the midpoints of the two S-year estimates.
++This USAID estimate, reported in USA/D/Guatemala Action Plan, FY 89 (36), is actually the DHS (9) estimate for the S-year period beginning in mid-l 982.
**The INCAP estimate, reported in Encuesta Simplificada de Salud y Nutricibn Materno-lnfantil, Guatemala (73), is for rural areas and is based on data obtained from the sentinel villages survey.
§§This UNICEF estimate, reported in the 7986 Annual Report (251, was apparently based on a Guatemalan Ministry of Health study.
Figure 3. Guatemalan infant mortality trends in 1980-l 988, as indicated by four different sources. (BUCEN = U.S. Bureau of the Census; UN/POP = United Nations Office of Population; MOH = Ministry of Health of Guatemala; PAHO = Pan American Health Organization.)
01, I I I I I I I I I
1980 1981 1982 1963 1984 1985 1986 1987 1988 1989 Year
-Q - BUCEN -t- UN/POP -III- MOH --m-PAHO '
34
of its ownAnuario 1987: Guatemala en
Cifias de Salud
(II). The reason for the irregular, almost sawtooth shape of theMOH data was not determined by the
authors.
Even though the estimates of IMR re- ported by PAHO in
Health Conditions in
the
Americas
(24, 25) are taken directly from official Guatemala Ministry of Health sta- tistics, they do not always match the MOH estimates reported in the annual year- books (20). In some years these estimates by the MOH and PAHO are nearly iden- tical (e.g., 1981, 1983, 1986), while in other years they differ widely (e.g., 1980, 1984, 1985). Similarly, as seen in Figure 1, thetwo
editions ofPAHO’s Healfh Conditions
in the
Amerikas
(1986 edition and 1990 edi- tion) agree in some years (e.g., 1980) and disagree in others (e.g., 1983). The reasons for these discrepancies are not known.8 Bulletin
of
PAHO 29(l), 1995The indirect models used by CELADE, the U.N. Population Office, and the U.S.
Census Bureau all incorporated the DHS
gress on child survival (33, 34) both re- treated to reporting only a 1987 estimate based on the same 1987 DHS survey (9). (The 1987 DHS survey actually reported a single figure, 73.4, for the 5-year period beginning in mid-1982.)
UNICEF’s annual country report for
1988 (26) cites IMRs of 71 for 1985 and 65 for 1986, an apparent recognition of the DHS results. The USAID congres- sional presentations (35) claim to obtain their IMR estimates from the U.S. Census Bureau, an example of original sources (DHS and INCAP) passing through a sec- ondary source (Census Bureau) to influ-
ence a third source (USAID, congres-
sional presentations). The differences
between the IMRs reported by the Cen- sus Bureau (6) and USAID in its congres- sional presentations (35) probably reflect the Census Bureau’s practice of retro- spectively altering its estimates for prior years based on the latest information. In-
terestingly, the USAID congressional
presentation for fiscal year 1990 (35) re- ported an IMR of 79 for 1988, a rate much higher than those reported for previous years and totally out of context. This
anomaly could have arisen through
misreporting of the 1987 DHS estimate
for the lo-year period mid-1977 through mid-1987.
Figure 1 portrays first-level dissemi- nation of the 1987 DHS results (9). The DHS provided national estimates of IMR for two 5-year periods (1977-1981 and mid-1982 through mid-1987), as well as urban and rural estimates for the entire lo- year period (mid-1977 through mid-1987). As noted, several sources factored the DHS results into their own estimates. In sum- mary, it appears that the “events” of the DHS and INCAP sentinel village studies influenced the various organizations in- volved at different paces, but that nearly all eventually factored the data from these “events” into their computations, the two exceptions being those PAHO and MOH estimates based solely on civil registry data.
It is difficult to know which single source is most accurate. If a single estimate is required for some reason, the best data source is one of the organizations with teams of demographers who analyze new
empirical data and adjust their models
accordingly-such as CELADE, the U.N.
Population Office, or the U.S. Census
Bureau. Direct estimates reported by the
Ministry of Health and PAHO are too
unreliable at this stage of civil registry
development in Guatemala. Some esti-
mates, particularly those made by the U.S. Census Bureau, the U.N. Population Of- fice, and the World Bank, should be ac- companied by a date when the estimate was made as well as by dates defining the period to which the estimate applies, because they retrospectively revise prior
year estimates as new information be-
comes available.
VACCINATION
COVERAGE:
TRENDS AND VARIATIONS
Measuring
Vaccination
Coverage
of Children
Worldwide, the effort to estimate vac- cination coverage rates on an annual ba- sis has been greater than the effort to estimate other child survival indicators. This is true despite the fact that the vac- cination coverage rate is not synonymous
with the rate of immunization. (Vacci-
nation does not guarantee protection, be- cause not all vaccinations result in the
seroconversion necessary to assure im-
munization, especially in situations where
frequent breakdowns in the cold chain
render vaccines ineffective.)
One reason for the extraordinary effort
devoted to estimating vaccination cov-
erage is the potential for rapid change in a given vaccination coverage rate. Every year a completely new cohort of infants must be vaccinated. Because the success in vaccinating each cohort depends on a
number of short-term factors, coverage
rates can and do fluctuate dramatically from one year to the next; therefore,
the rate must be estimated anew each
year.
In general, two methods of estimating vaccination coverage rates have been re- fined over the years: routine reporting
(generating what are known as admin-
istrative estimates) and surveys.
In Central America, where reporting
systems are relatively well developed,
emphasis has been placed on improving
the quality of routine reporting. How-
ever, special surveys carried out from time to time provide an alternative view of coverage levels that may be more rep- resentative of the entire target population and thereby serve as a check on bias found in data from routine reporting systems. Normally, ministries of health report ad- ministrative estimates, and these in turn
are received and reported by interna-
tional organizations such as PAHO, WHO, and UNICEF.
Administrative estimates are calculated by taking the number of vaccine doses administered to the children of a partic- ular age group during a given time pe- riod (the numerator) and dividing it by the total number of children in that age
group during that time period (the denom- inator). An administrative estimate is thus
based on
period
data (data collectedthroughout a relatively long period of time, usually a year). Several factors contribute to discrepancies, and sometimes errors, in both the numerators and denominators of administrative estimates.
With respect to numerators, standard
practice calls for generating annual ad- ministrative estimates of vaccination cov- erage from a count of vaccine doses ad-
ministered to children
under one year of
age throughout a year. Typically, the
health sector keeps a count of the vaccine doses administered. Some of the factors
contributing to numerator variation in
these administrative estimates include the following:
10 Bulletin of PAHO 29(l), 1995
Some estimates count doses sent to the field; others count doses admin- istered as reported by the field. Fluctuating inventories of vaccines can significantly influence estimates based on doses sent to the field.
With respect to doses administered, the inclusion of children vaccinated
outside
the recommended age range, especially children over one year ofage, inflates the numerator and
therefore the estimate of coverage. Because many countries count doses of vaccine administered without dif- ferentiating by age, this is a frequent error.
l Delays in reporting data from the pe-
riphery can delay the publication of updates by 6 to 12 months,
l Administrative estimates often in-
clude only government-adminis- tered vaccines. In that case vaccina-
tions administered by the private
sector-including private physicians
and nongovernmental organiza-
tions-are not counted.
Denominators of administrative esti-
mates are typically the estimated number of children who survive the first year of life. The number of one-year survivors is frequently obtained by subtracting an es- timate of the infant deaths during the year (based on infant mortality estimated
by a demographic model or taken from
census projections) from an estimate of the number of live births during the year (often obtained from a vital events reg-
istration system). However, sometimes
the total number of live births during the year is used rather than the number of
survivors, and in other instances the
number used is a midyear estimate of the 0- 11.9 month population.
l Use of the alternative definitions noted
above (one-year survivors, live births,
and midyear population) and use of
alternative sources (demographic
models, censuses, and vital events registration systems).
l Use of different demographic models,
which produce different estimates of the IMR used to estimate the number of one-year survivors. (Demographic models typically capture relatively
long-term trends and rarely reflect
recent reversals in those trends.)
l Use of inappropriate partial cohorts,
including cohorts that reflect the vac- cination window (e.g., 9-11.9 months for measles) rather than the entire year.
In contrast to the period data used by
routine reporting systems, survey esti-
mates are based on data collected at a particular
point
in time, namely, the point in time of the survey. The recommendedsurvey methodology for estimating vac-
cination coverage rates “by the first birth- day” is to survey children 12 through 23.9 months of age, and to count as vac-
cinated only those children who were
vaccinated prior to their first birthday. In such a survey, estimates for the val-
ues of both the numerator (the number
of children 12-23.9 months old at the
time of the survey who were vaccinated prior to their first birthday) and the de- nominator (all children who were 12-23.9 months old at the time of the survey) are taken directly from the survey data. Health cards are used to determine birth dates, vaccination status, and age of the child at vaccination. In some cases, mothers’ recall about the vaccination is also used.
Under the direction of the World Health
Organization, a standard sampling meth-
odology (a two-stage cluster sampling
technique) has evolved for estimating
vaccination coverage. (In Guatemala, no
surveys that used this technique were en-
countered, although other more exten-
sive health surveys that included vacci-
nation information were found.)
Various factors, including the follow- ing, contribute to discrepancies and er- rors in survey-based estimates.
Samples may not be truly represent- ative, because limited resources fre- quently restrict the movement of sur- vey teams in remote places.
The phenomenon surveyed may be
seasonal (in the case of vaccination programs, coverage rates found at one point in time may reflect recent cam- paigns, temporary breakdowns in the cold chain, or even the irregular pace
of vaccination programs forced by
rainy seasons, etc.).
Different sample sizes and sampling techniques (e.g., cluster sampling or simple random sampling) can yield different results.
The inclusion or exclusion from the numerator (the count of children vac-
cinated) of undocumented vaccina-
tions-supported by the mother’s
recall but not by a vaccination card- can affect estimates.
Data recorded on health cards may be incorrect.
Aggregation of subnational estimates may have been done incorrectly. Variations occur in the age ranges of the children sampled (0- 11.9 months, 12-23.9 months, 3-11.9 months, O- 59.9 months have all been used) and in the age range counted in the nu- merator. Surveys that include chil- dren vaccinated after their first birth-
day in the numerator overestimate
the true rate, while surveys that sam- ple only children under one year of age underestimate the true rate un- less adjustments are made.
A number of other factors may also contribute to discrepancies and errors in
vaccination coverage estimates. Pro- grams with lower coverage rates have an
opportunity to vaccinate more children
than programs with higher coverage rates because they can vaccinate all the chil- dren in the current year’s cohort plus many of the as yet unvaccinated children in the previous year’s cohort, especially in the case of antigens given early in life.
Because denominators are not adjusted
to account for this, estimates relating to
low-coverage programs have a potential
for overestimating true coverage.
In addition, delivery methods can have a spurious effect on coverage estimates. For example, in the wake of a campaign, vaccination coverage with DPT 3 and po- lio 3 tend to be underreported, and cov- erage with DPT 1 and polio 1 tend to be
overreported, because mothers tend to
forget how many times their children were vaccinated.
Vaccination
Coverage of Children
in Guatemala
Vaccination coverage rates reported for Guatemala in the 198Os, based on both
administrative and survey data, were
found to have been influenced by most
of the variation-producing factors noted
above. Some surveys accepted the
mother’s recall of a vaccination, while others did not. Different sampling frames
and sampling methodologies were used.
Administrative estimates were found to
vary with respect to (1) the time elapsing between the end of the reporting period and the time the report was actually re- ceived, (2) the population estimate (de- nominator) selected, and (3) the degree of rigor applied in limiting the numerator to children vaccinated prior to their first birthday.
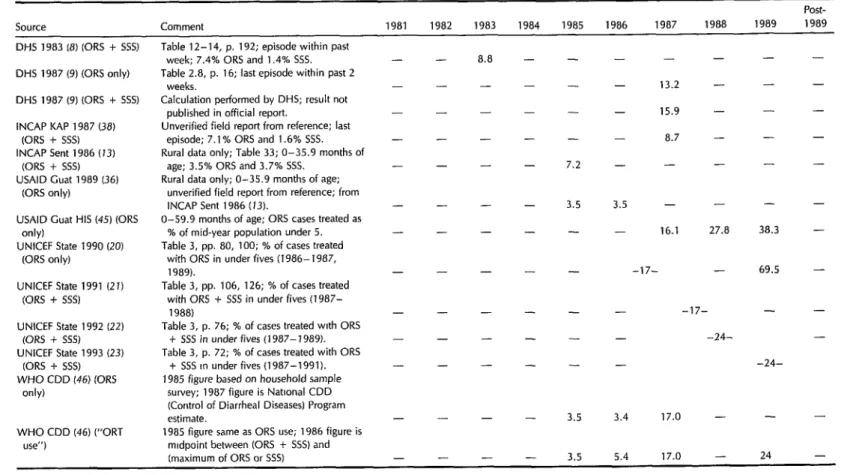
Table 1 displays all of the data sources (8-22,
13-21,
25, 26, 30-35, 38-45) and the full range of measles vaccination cov- erage rates discovered during the inves- tigation. The same sources provided in-formation on BCG, DPT 3, and polio 3
vaccination coverage rates in the same
years.7 Eight different rates were derived
from the 1987 Demographic and Health
Survey (see table listings for DHS 1987 and DHS 1989-9, 39), including five for children 12-23.9 months old at the time of the survey. Line 4 in Table 1 gives the coverage reported for the 55.5% of all children surveyed in this age group with
vaccination cards; this is the rate pub- lished in the official report of the DHS. Lines 6, 7, 8, and 9 present estimates of the overall rate (for the children in this age group without cards plus those with
cards) based on different assumptions
about the vaccination rate among the
children without cards. (Lines 6-10 in
Table 1 are from a 1989 draft document prepared by the DHS project staff-39.)
These coverage estimates based on dif-
ferent assumptions regarding coverage
among children without cards illustrate
how misleading published rates can be
unless their assumptions are specified. Line 6 in Table 1 is the rate derived di- rectly from the mother’s recall of her
child’s vaccination history. (Guatemala
was one of seven countries where the
mother was asked for a total history- most of the early demographic and health surveys asked only whether the mother recalled her child receiving at least one vaccination.) Line 8 in Table 1 is the rate derived by assuming that children whose mothers recalled at least one vaccination were vaccinated at the same rate as the children with cards. In addition, the DHS staff analyzed the veracity of the moth- er’s recall in the seven aforementioned surveys where the mother was asked for a total history and, based on the analysis, determined an adjustment factor to cor- rect for recall errors. This adjustment fac- tor lowered the coverage rates somewhat
7Tables containing the specific data for the other vaccines are available from the first author.
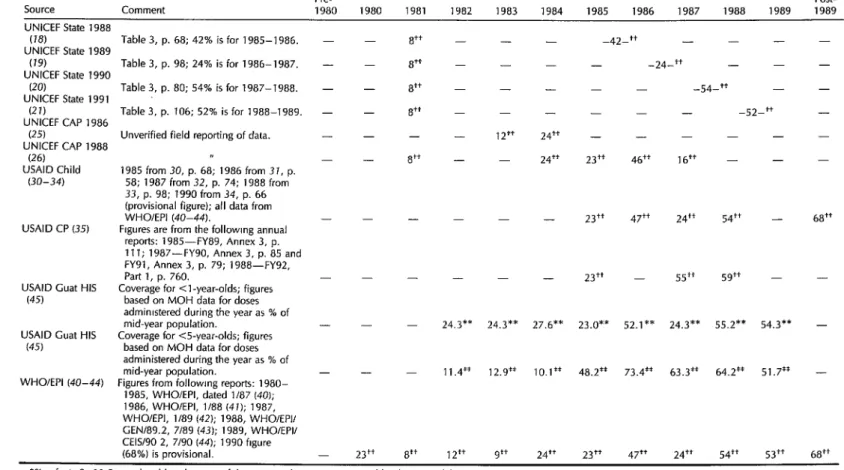
Table 1. Measles vaccination coverage rates in Guatemala, as reported by various sources.
Pre-
Source Comment 1980 1980 1981 1982 1983 1984 1985 1986 1987 1988 1989
Post- 1989
DHS 1983 (8)
DHS 1983 (8) DHS 1987 (9)
DHS 1987 (9)
DHS 1987 (9)
DHS 1989 (39)
DHS 1989 (39)
DHS 1989 (39)
DHS 1989 (39)
DHS 1989 (39)
Chat MOH 1980- 1987 (10) Cuat MOH 1987
(11)
INCAP KAP 1987 (38)
INCAP KAP 1987 (38)
INCAP Sent 1986 (13)
INCAP Sent 1986 (13)
PAHO 1986 (74) PAHO 1990 (75) UNICEF State 1986
(16)
UNICEF State 1987 (17)
Table 13-3, p. 195; coverage of those with cards.
Table 2.9, p. 17; coverage of those with cards (48.7% 3-l 1.9 months old had cards).
Table 2.9, p. 17; coverage of those with
cards (55.5% 12-23.9 months dd had
cards, see Table 2.10, p. 18). Table 2.9, p. 17; coverage of those with
cards (54.3% had cards). Table 6, column A; based on actual
mother’s recall of child’s vaccination history.
Table 6, column 6; assumes children without cards were vaccinated at rate of those with cards, adjusted. Table 6, column C; assumes children
without cards were vaccinated at rate of those with cards.
Derived assuming children without cards received no vaccination. Table 10; method unclear but probably
similar to that of the second DHS 1989 entry above.
Data obtained from MOH yearbooks, unverified.
Numerator of 103 276 vaccinations and denominator of 308 307 births in 1987.
Unverified field reporting of data.
Rural data only, Table 29 and p. 13. Unclear whether figure includes children without cards or mother recall.
Vol. I, pp. 407-410. Vol. I, p. 81, Table 20. Table 3, p. 137; 12% is for 1981-
1983.
Table 3, p. 94; 12% is for 1980-1981; 11% isfor 1984-1985.
- - - - - - - - - - - - - - - - - - - - - - - - -
60.0** 51.6**
Table 1. (Continued)
Pre- Post-
SOWX Comment 1980 1980 1981 1982 1983 1984 1985 1986 1987 1988 1989 1989
UNICEF State 1988
(18) Table 3, p. 68; 42% is for 1985-1986. - 8++ - - -42-t+ - - - -
UNICEF State 1989
(19) Table 3, p. 98; 24% is for 1986-l 987. - 8++ - - - -24-t+ _ - -
UNICEF State 1990
(20) Table 3, p. 80; 54% is for 1987-1988. - - 8++ - - -54-t+ - -
UNICEF State 199 1
(21) Table 3, p. 106; 52% is for 1988-1989. - - 8++ - - - -52-t+ _
UNICEF CAP 1986
(25) Unverified field reporting of data. - - - - 12++ 24++ _ _ - -
UNICEF CAP 1988
(26) I, a++
- 24++ 23++ 46++ lb++ _ _
USAID Child 1985 from 30, p. 68; 1986 from 37, p.
(30-34) 58; 1987 from 32, p. 74; 1988 from
33, p. 98; 1990 from 34, p. 66 (provisional figure); all data from
WHOlEPI (40-44). - - 23++ 47++ 24++ 54++ - 68++
USAID CP (35) Figures are from the followmg annual
reports: 1985-FY89, Annex 3, p.
111; 1987-FYYO, Annex 3, p. 85 and
FYYl, Annex 3, p. 79; 1988-FY92,
Part 1, p. 760. - - - 23++ - 55++ .jg++ - -
USAID Cuat HIS Coverage for <l-year-olds; figures
(45) based on MOH data for doses
admimstered during the year as % of
mid-year population. - - 24.3** 24.3** 27.6** 23.0** 52.1** 24.3** 55.2** 54.3** -
USAID Cuat HIS Coverage for <5-year-olds; figures
(45) based on MOH data for doses
administered during the year as % of
mid-year population. - - 11.4” 12.9** 10.1** 48.2** 73.4** 63.3** 64.2** 51.7** -
WHOIEPI (40-44) Figures from followmg reports: 1980-
1985, WHO/EPI, dated l/87 (40); 1986, WHOIEPI, 1188 (47); 1987, WHOIEPI, 1189 (42); 1988, WHOIEPII CEN/89.2, 7189 (43); 1989, WHOIEPII CEISAO 2, 7/90 (44); 1990 hgure
(68%) is provisional. 23++ 8++ 12++ 9++ 24++ 23++ 47++ 24++ 54++ 53++ 68++
*% Infants O-l 1 .Y months old at the time of the survey who were vaccmated by the time of the survey. +% infants 3-l 1 .Y months old at the time of the survey who were vaccinated by the time of the survey. *% children 12-l 7.9 months old at the time of the survey who were vaccinated by their first birthday.
4% children 12-23.9 months old at the time of the survey who were vaccinated by the time of the survey.
‘1% children 12-23.9 months old at the time of the survey who were vaccmated by their first birthday.
“% children 3-59.9 months old at the time of the survev who were vaccinated bv the time of the survey.
**% all infants (either mid-year population or l-year sukivors) who were vaccinaied at <l year, using-administrative data.
Itsignifies fl and/or **.
for all antigens except BCG. Line 7 shows the results of applying this adjustment factor to the line 8 estimates. Finally, line 9 shows the most pessimistic rate, which
was based on an assumption that any
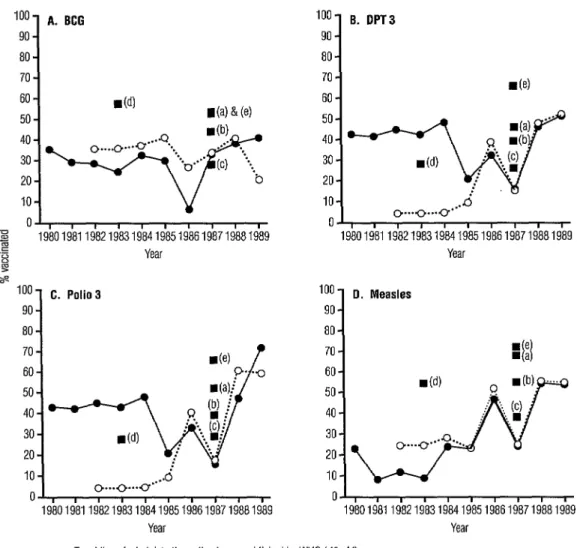
child without a card was not vaccinated. Figure 4 displays selected vaccination
coverage rates published by WHO and
reported by USAID. The trends based on the WHO numbers (solid trend line- 40-44) are the most basic, because they have been derived from information pro- vided by the Ministry of Health and are frequently used by other reporting agen- cies such as UNICEF (16-23) and USAID (30-34). A second trend line, reported by the USAID Mission in Guatemala (dotted
trend line-45), is also based on MOH
administrative data but differs substan- tially from the WHO-reported trend line in some years. During the first half of the decade, the WHO estimates are much higher than the USAID estimates for DPT 3 and polio 3, but lower than the USAID estimates for BCG and measles. These large discrepancies in the early part of the decade appear to be due primarily to the fact that the Ministry of Health data
used by USAID/Guatemala was actually
published in 1990 and therefore was sub- ject to adjustment by the Ministry in the intervening years; whereas the data used by WHO was reported as soon after the data collection period as possible. The WHO and USAID estimates in the latter half of the decade are closer together; the small differences can be largely explained by the use of different population esti-
mates in the denominator. The diver-
gence of the two trend lines for BCG cov- erage in 1989 (41 vs 20.8) points up the instability of vaccination coverage esti- mates. We do not know the reason for this divergence.
The results of the national demo-
graphic and health surveys (DHS) un- dertaken in 1983 (8) and 1987 (9), to- gether with the results of the 1987 KAP study (38), provide a useful comparison
to the official figures published by WHO (40-44). Figure 4 includes three of the five 1987 DHS (9, 39) estimates made for
children 12-23.9 months of age at the
time of the survey (see points a, b, and c). One of these estimates (see point a)
was based on the assumption that all
children without cards were vaccinated
at the same rate as those with cards; an- other one (see point b) was based on the
assumption that only those children
whose mothers recalled at least one vac- cination were vaccinated at the same rate as the children with cards; and the third (see point c) was based on the assump- tion that children without cards were not vaccinated.
The graphs in Figure 4 suggest an in-
triguing phenomenon regarding meas-
urement of vaccination coverage (both in- side and outside Guatemala) by means of survey data (as reported by DHS and
INCAP) versus administrative data (as
reported by WHO). Specifically, one is
tempted to jump to the conclusion that
apparent 1987 vaccination coverage as
determined by survey data is higher than
that determined by administrative data.
However, the group surveyed in 1987 was 12-23.9 months old; and so a significant part of the group was vaccinated in 1986. With the exception of the BCG trend line,
the WHO administrative rates for 1986
were higher than the most pessimistic
DHS estimates and only slightly lower
than the middle DHS estimates that as-
sumed the coverage of children whose
mothers recalled at least one vaccination was the same as the coverage found for children with cards. Thus, the difference between the two estimates (DHS 1987 and
WHO administrative) can be largely ex-
plained by differences in definition rather than differences in data. (The BCG ad- ministrative trend seems out of line with
the others, with vaccination coverage
falling off rather than rising in 1986. We know of no explanation for this devia- tion.) All four estimates reported by the
Figure 4. Vaccination coverage rates estimated by various agencies for BCG, DPT 3, polio 3, and measles vaccinations based on both administrative and survey data, 1980-l 989.
“’ A. BCG 90
80
70 60 50 40 30 20 IO
II’,
, , , , , , , , ,
z
-5 1980198119821983198419851986198719861989 .c
x Year
J s
1oo C. Polio3 90
de)
/’
p- ‘0
i!yJji.jY
IO-
O...O...O . ...&
0 , , , , , , , , ( ,
1980198119821983198419851986198719681989 Year
loo- B. DPT3 90 -
de)
0 , , , , , , , , , , 19801981 19821983198419851986198719881989
Year
100 0. Measles
90
80 70 60 50 40 30 20
10
00
19801981 19821983196419851986198719881989 Year
-o-Trend line of administrative estimates as published by WHO (40-44).
-cwTrend line of administrative estimates as reported by USAID/Guatemala using MOH data (45)
Notes:
1. The WHO and USAID/Guatemala administrative estimates are the ratios of vaccines given to children under 1 year of age to estimates of the mid-year populations for the years shown. 2. All survey estimates are for the age group 12 through 23.9 months of age.
Sources:
(a) DHS (9): assuming all children without vaccination cards were vaccinated at the same rate as the children in possession of vaccination cards.
(b) DHS (39): assuming only those children whose mothers recalled at least one vaccination for their children were vaccinated at the same rate as the children in possession of vaccination cards.
(c) DHS (39): assuming all children without vaccination cards received no vaccination at all. (d) DHS, 1983 (8): treatment of the card/recall issue unknown.
(e) KAP (38): treatment of the card/recall issue unknown.
KAP 1987 (38) survey for 1987 and two of the four estimates reported by the DHS 1983 (8) survey for 1983 are much higher
than the corresponding administrative
estimates for the same year, possibly be- cause relatively high coverage rates were ascribed to children without health cards.
Tetanus Toxoid Coverage
Deriving tetanus toxoid coverage trends among women from historical data is par- ticularly challenging, due partly to chang- ing definitions of the coverage indicator over time and partly to the cumulative pro- tective effect of tetanus toxoid vaccination over the course of a lifetime. These two matters are closely related.
Properly spaced, five doses of tetanus toxoid will protect a woman from tetanus and all of her newborns from neonatal tetanus throughout her childbearing years. In populations where little effort has been made to vaccinate women against teta- nus, the traditional strategy adopted by health professionals has been to give two shots during the latter stages of a single pregnancy. Hence, the historical indica- tor used to monitor program progress is the proportion of pregnancies in which two doses are administered.
However, as the number of women re- ceiving subsequent doses of the vaccine
through repeated pregnancies increases,
and as more young women who were vac- cinated for DPT as children reach child- bearing age, the proportion of protected newborns increases, even among mothers
who may not have received the prescribed two shots during any single pregnancy. Here the traditional indicator ceases to address the relevant issue, the proportion of new- borns protected against neonatal tetanus.
For this reason, efforts are underway
worldwide to modify the neonatal teta-
nus indicator so that it successfully meas-
ures long-term protection. The new in-
dicator is the proportion of newborns
whose mothers have received sufficient
tetanus toxoid vaccinations, properly
spaced, to guarantee the newborn’s pro- tection against neonatal tetanus. In some cases this coverage has been defined as the number of properly vaccinated women of childbearing age divided by the num-
ber of childbearing women in the pop-
ulation. However, because the accept-
ance of this new indicator varies and
underlying assumptions are not always
made explicit, it is not always possible to
determine which definition applies to a
particular published rate.
As with estimates of vaccination cov-
erage against childhood diseases, esti-
mates of tetanus toxoid coverage are
available from both administrative and
survey sources; and the quality of the latter is determined by many of the same factors that determine the quality of the former. Among other things, administra- tive estimates are only as good as the ability of the routine reporting system to capture the number of doses given and the accuracy of the estimated number of pregnancies occurring in a given time pe- riod. Frequently the denominator is es- timated by the number of live births dur- ing a period rather than the number of pregnancies, which, due to miscarriages
and stillbirths, underestimates the de-
nominator and therefore overestimates the coverage. Survey estimates are limited by the ability of mothers to recall their vac-
cination histories. Frequently, where
children have vaccination cards mothers
do not, and therefore maternal recall is
especially important. Also, surveys are
frequently not comparable due to the di- verse ways in which vaccination histories are sought and recorded.
Thirteen different sources of estimates were found for tetanus toxoid coverage in Guatemala in the 1980~~; Figure 5 dis- plays selected estimates. The DHS esti-
Figure 5. Tetanus toxoid vaccination coverage estimated by different sources that use administrative and survey data. Coverage is defined as the percentage of pregnant women in the calendar year receiving two or more doses of tetanus toxoid during the pregnancy, except in the case of the DHS estimate, where coverage is the percentage of live births in the preceding 5 years for which mothers received at least one dose during pregnancy.
25
1
“aj*
, ,
1983 1984 1985 1986 1987 1988 1989 Year
-o- Administrative estimates, MOH (74 77) -0-e Administrative estimates, USAID/Guat (45)
n DHS. 1987 (9) -CI- WHO/EPI (42,43)
mates for 1987 (9) reflect the percentages of births among urban, rural, and all sur-
vey respondents during the five years
preceding the survey for which the mother had received at least one tetanus toxoid vaccination. Three trend lines are shown
in Figure 5: estimates for 1983-1987
published by the MOH (20, II); estimates for 1983-1989 reported in the USAIDI Guatemala database using MOH data (45); and two estimates (1987 and 1989) re- ported by WHO/El’1 (42, 43) that are also based on MOH data. All three define the
numerator as the number of second doses given to pregnant women in the time pe-
riod indicated and define the denomi-
nator as the number of live births occur- ring in that period.
As may be seen, the tetanus toxoid
vaccination coverage rates appear quite
low throughout the decade. The unex-
plained 1986 drop in the Ministry of Health estimates may have been due to a change
in service delivery strategies, or may be an artifact of the method of computation applied by the Ministry.
ORS USE: TRENDS AND
VARIATIONS
Measuring
ORS Use Trends
The appropriate technology for treat-
ing watery diarrhea is administration of prepackaged oral rehydration salts (ORS) or homemade sugar-salt solutions (SSS). During the child survival initiative of the late 198Os, a distinction was made be-
tween the ORS use rate and the oral re-
hydration therapy (ORT) use rate, the
former being limited to use of prepack- aged ORS. The World Health Organiza- tion publishes both the ORS use rate and the (ORS + SSS) use rate, the latter under the heading of “ORT Use Rate.”
According to the USAID Child Survival Program (3U-34), ORT involves three as- pects of diarrhea case management-the administration of either ORS or SSS, con-
tinued appropriate feeding during diar-
rhea, and referral of severe cases to proper medical treatment facilities. None of the
ORT use rates published by WHO refer
to the more complex USAID definition.
Moreover, individuals and institutions
citing primary data sources commonly fail
to distinguish clearly between ORS,
(ORS + SSS), and ORT use rates.
Both ORS and (ORS +SSS) use rates are best determined by surveys. The rec-
ommended method for inquiring about
rehydration practice is to select children O-59.9 months old who have had diar- rhea in the two weeks preceding the sur- vey and to ask their mothers what treat- ment was administered to these children. (This method requires rather large sam- ple sizes to ensure finding enough chil- dren with diarrhea episodes in the two weeks preceding the survey.) Variations
in how the question is posed to the
mothers limit the comparability of survey
results, as does the fact that some sur- veys use recall periods that are longer or shorter than two weeks. Overall, errors and inconsistencies arise in the rates found by the surveys for various reasons, in- cluding the following:
different recall periods;
different treatment of households with more than one child under 5 years old;
sample composition differences aris-
ing from seasonal variations in the distribution of diarrhea cases;
different questions and methods of
asking questions to mothers about diarrhea and their own behavior; inaccurate responses by mothers who
have learned how to answer the
questions to please the authorities but have not changed their behavior; and loose handling of the distinctions be- tween packets, proper home solu- tions, and improper home solutions.
WHO has developed procedures for
estimating the ORS use rate from data on
the number of packets available in a
country during a given year. First, an estimate of diarrhea incidence is made, often from old surveys. An algebraic al- gorithm is then applied to estimate how many of those cases were treated with ORS, based on estimates of the avail- ability of ORS packets in homes and health facilities. In the absence of other empiri- cal data, these estimates are reasonable; however, factors such as the existence of packet supply backlogs or packet non- usage following distribution do not enter into the estimation procedure.
As use of oral rehydration treatment
for diarrhea has become more wide-
spread, increasing attention has been
given to proper application of the tech- nology. Studies have shown that all too often mothers use the packets but mix the solution incorrectly or fail to give ade-
quate amounts to their children. Simi-
larly, mothers do not always mix home solutions in the proper proportions or give adequate quantities to their children. In addition, there is always the possibility that reported increases in ORS or ORT use rates may simply reflect increased in- appropriate usage, especially the giving of inadequate quantities to not very sick children. Thus, a 40% use rate is not nec- essarily twice as good as a 20% use rate.
In years to come, indicators of ORS
and ORT use may be changed to distin- guish proper application of the treatment from faulty applications. Ideally, the re- ported oral rehydration use rate should
maximize appropriate use and minimize
inappropriate use in the light of resource limitations of both the home and the gov-
ernment. However, because ORS and
ORT use rates apply to all diarrhea epi- sodes, not just watery diarrhea, it is un- clear what the ideal use rate should be in most situations.
ORS Use Rates in Guatemala
In Guatemala, data are available re-
garding ORS and (ORS + SSS) use rates from two types of sources: the routine reporting system (as reflected in rates
published by WHO-46) and surveys.
The rates published by WHO are com-
puted by a variety of methods depending on the data available.
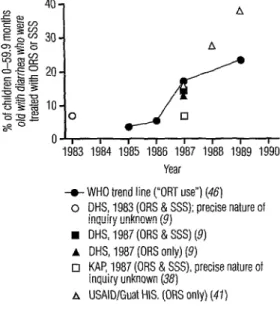
Figure 6 charts most of the data avail-
able regarding ORS and (ORS + SSS)
use. Table 2 contains the actual numbers, including several applying to multi-year estimates and several others applying to rural areas only that are not shown in the chart. While the apparent overall trend in (ORS + SSS) use is positive, the ab- solute levels of use attained by 1989 were still well below 50%.
The two 1987 DHS estimates in Figure 6 indicate the apparent gap between ORS use and (ORS + SSS) use in Guatemala. This gap does not seem very large, sug-
Figure 6. ORS and (ORS + SSS) use rates estimated by reports of different sources based on both administrative and survey data.
Year -e-WHO trend line (“ORT use”) (46)
o OHS! 1983 (0% & SSS); precise nature of inquiry unknown (9)
n OHS, 1987 (ORS & SSS) (9) A OHS. 1987 (ORS onlv) (9) 1.
q KA(Ap, 1987 (0% & SSS), precise nature of inquiry unknown (38)
A USAID/Guat HIS. (ORS only) (41)
gesting that the primary rehydration so- lution used in the country is the packet. More broadly, the diversity of the various 1987 estimates appears due primarily to differences in definitions rather than dif- ferences in data, underlining the need to
exhibit caution in comparing numbers
unless the definitions and procedures used to derive those numbers are known to be the same.
DISCUSSION
AND
CONCLUSIONS
Many different published and unpub-
lished estimates for rates of infant mor- tality, vaccination coverage, and ORS use were found for Guatemala in the 1980s. Counting a publication series as a single source,g we found 16 different sources for
‘The publication series that were counted as single sources include PAHO’s Health Conditions in the Americas (24, 25), UNICEF’s State of the World’s Chi/- dren (Z&23), the UNICEF Area Office for Central America and Panama Annual Report (25,26), USAID’s Congressional Presentafion: Latin America and the Car- ibbean (35), and USAID’s reports to Congress on child survival (30-34).
20 Bulletin
of
PAHO 29(Z), 1995infant mortality; 13 sources for BCG vac- cination coverage; 14 sources for DPT, polio, and measles coverage; 8 sources for tetanus toxoid coverage; and 8 sources for ORS use.
Although the reported IMR declines
more or less steadily throughout the dec- ade (see Figure 3), estimates of all vac- cination coverages and ORS use remain
relatively low-near or well below 50%
for most of the decade. Moreover, the
decade trends in vaccination coverage are not consistently favorable (see Figure 4). The coverages for BCG, DPT 3, polio 3,
and measles are all approximately con-
stant during the first half of the decade
according to WHO/EN (40-44) and
USAID/Guat HIS (45) estimates, and then show oscillating patterns in the last half of the decade. Finally, DPT 3, polio 3, and measles coverages were all higher at the end of the decade than at the begin- ning according to both sources, while 1989 BCG coverage was higher according to
WHO/El’1 (44) but lower according to
USAID/Guat HIS (45). Tetanus toxoid
coverage and ORS use (see Figures 5 and 6) show fairly consistent upward trends according to all available sources.