ABSTRACT: Objective: To evaluate the potential efectiveness of strategies of Oral Health Promotion (OHP),
which are carried out by teams in primary health care (PHC) in Brazilian capitals and regions. Methods: A sample of 1,848 dentists were interviewed (1,819 valid responses) working in the PHC of 26 capitals and the Federal District. The Efectiveness of the Assessment Tool for the Promotion of Oral Health Strategies was used. It is composed of 23 indicators grouped into three dimensions: oral health, health public policies, and human and social development. The answers were arranged in a Likert scale (1–5), and the inal score obtained for each sample unit can range from 23 to 115. Higher score values indicate greater potential for the strategy to promote oral health. Results: Statistically signiicant diferences were identiied among the analyzed geopopulation units considering the study object. The Southeast and South regions had better performance for the OHP strategies in comparison to the other regions of Brazil (p ≤ 0.01). Conclusions: The OHP strategies identiied in the study were heterogeneous, with better results favoring the Southeast regions, with disadvantages for people living in capitals from the Central‑North‑Northeast of Brazil. Eforts should be undertaken aiming to qualify the PHC teams, especially for those in disadvantageous regions. Therefore, an alignment of PSB strategies to the principles and values of health promotion is required, addressed to the social health determinants (SHDs) and in order to ight the inequalities in oral health.
Keywords: Health Promotion. Oral health. Primary health care. Efectiveness. Health service evaluation. Evaluation of the eicacy‑efectiveness of interventions.
Potential efectiveness of strategies to promote
oral health in primary health care: comparative
study among Brazilian capitals and regions
Potencial de efetividade das estratégias de promoção da saúde bucal na atenção
primária à saúde: estudo comparativo entre capitais e regiões do Brasil
Antonio Dercy Silveira FilhoI, Samuel Jorge MoysésI, Solena Ziemer KusmaI, Simone Tetu MoysésI
ORIGINAL ARTICLE / Artigo originAl
iPontifícia Universidade Católica do Paraná– Curitiba (PR), Brazil.
Corresponding author: Antonio Dercy Silveira Filho. Rua Treze de Maio, 1001, apto. 2, São Francisco, CEP: 80510‑030, Curitiba, PR, Brasil. E‑mail: [email protected]
INTRODUCTION
Brazilian states and cities play decisive roles in making the organization principles of the Unified Health System (SUS) effective. All Brazilian cities must at least struc‑ ture primary health care (PHC) and develop health promotion strategies, by imple‑ menting multiprofessional teams that work in basic health units (BHUs)1. Based on the National Oral Health Policy “Brasil Sorridente” (PNSB)2, on the National Basic Care Policy (PNAB)3, and on the National Health Promotion Policy (PNPS)4,5, the conduc‑ tion of oral health promotion (OHP) should be integrated with other health practices carried out by these teams, aiming at ensuring the integrality of health care to Brazilian citizens2‑5. The base is the social determination of the sickness‑health process and the facing of inequities6‑8.
Therefore, health promotion, in the sense of the term, is a complete praxis9, encourag‑ ing equality10 and processes to improve the quality of life11, using the approach over com‑ mon risk factors for several diseases. The potential efectiveness of OHP is related to the conceptual alignment of group interventions, conducted by health teams, involving the pil‑ lars (equity, participation, sustainability) and values (governance, autonomy, empowerment, inter‑sectoriality, integrality) that are usually mentioned in the critical literature about health promotion12,13. The pillars are the theoretical basis of health promotion, or the foundation supporting it, and are also its moral anchor.
RESUMO: Objetivo: Avaliar o potencial de efetividade de estratégias de Promoção da Saúde Bucal (PSB), desenvolvidas por equipes de Atenção Primária à Saúde (APS) nas capitais e macrorregiões brasileiras. Métodos: Foram entrevistados 1.848 cirurgiões‑dentistas (1.819 respostas válidas) atuantes em equipes de 26 capitais e do Distrito Federal. Utilizou‑se a Ferramenta de Avaliação da Efetividade de Estratégias de Promoção da Saúde Bucal, composta de 23 indicadores, reunidos em três dimensões: saúde bucal, políticas públicas saudáveis e desenvolvimento humano e social. As respostas foram ordenadas em uma escala tipo Likert (1 a 5). O escore inal para cada unidade amostral obteve uma variação de 23 a 115, sendo que valores maiores do escore indicam maior potencial da estratégia em promover a saúde bucal.Resultados: Foram identiicadas diferenças estatisticamente signiicativas entre as unidades geopopulacionais analisadas quanto ao objeto estudado. As regiões Sudeste e Sul apresentam desempenhos superiores quanto às estratégias de PSB adotadas frente às demais regiões do Brasil (p ≤ 0,01). Conclusões: As estratégias de PSB identiicadas no estudo foram heterogêneas, com melhores resultados favorecendo as regiões do Sul‑Sudeste e desvantagens para as pessoas que vivem nas capitais do Centro‑Norte‑Nordeste do Brasil. São necessários esforços objetivando qualiicar equipes de APS, sobretudo para as regiões desfavorecidas. Para isso, é fundamental um alinhamento de estratégias de PSB aos princípios e valores da promoção da saúde, orientados para os determinantes sociais da saúde (DSS) e combate as iniquidades em saúde bucal.
The use of adequate methodologies, validated to measure the efectiveness of health promotion, has been given attention in diferent health systems, aiming at the qualiication of care models to face social health determinants (SHDs)13. The purpose of assessing the efectiveness of OHP strategies in PHC is challenging, especially when it concerns provid‑ ing evidence that supports the formulation of public policies, in order to have a positive impact on epidemiological oral health indicators14,15. Decision‑making in health, based on evidence, is also a gap relected directly on the daily routine of public oral health manage‑ ment, and on the best use of investments in the ield16,17. Therefore, focusing on a research ield that can generate new evidence and support decision‑making in oral health manage‑ ment is justiied18,19.
This study also uses a large set of data produced by the National Study of Health Promotion Practices (E.N.PRO.SA)12, conducted by the Collaborative Center of the Ministry of Health in Oral Health Surveillance (CECOL/PUCPR). Its development took place in 2013–2014, integrating a deal of cooperation established between the National Coordination of Oral Health, at the Ministry of Health, and Pontifícia Universidade Católica do Paraná. Some of the products predicted were:
1. The production of a national mapping of the 26 state capitals and the Federal District, identifying OHP strategies adopted in PHC in Brazil;
2. The formulation of an effectiveness assessment tool of OHP strategies, whose validation is already published12,13;
3. The evaluation of the efectiveness potential of the mapped strategies.
As a consequence, this study proposes to evaluate and compare the efectiveness poten‑ tial of OHP strategies implemented by PHC in the capitals and regions of Brazil, analyzing interventions reported by the teams that were analyzed.
METHODS
Aiming at conducting exploratory, descriptive, and comparative analyses about the OHP strategies used by PHC teams in the 26 Brazilian capitals and the Federal District, as well as among the ive Brazilian regions, a database was produced based on the third stage of E.N.PRO.SA12, conducted from April to December, 2013. The project was approved by the Research Ethics Committee of Pontifícia Universidade Católica do Paraná, on March 29, 2012, under protocol CAAE: 01532112.4.0000.0020.
and social development (Chart 1). For each indicator, the responses are ordered in a Likert scale, grading from 1 (does not contemplate) to 5 (contemplates totally). A inal score is obtained ranging from 23 to 115; the higher the score, the stronger the association of the strategy with health promotion pillars and values, suggesting greater potential to pro‑ mote oral health. When using the median as cutof, scores between 23 and 74 character‑ ize weak strategies, with poor potential, whereas values between 75 and 115 characterize strong strategies, with higher potential to promote oral health in PHC. Obviously, it is necessary to consider that threshold values close to 74–75m characterize a strong transi‑ tion, or intensity in the potential of the strategy, ranging from the scale of “none/little” to “plausible/a lot of ” potential. One detail about the full content of the referred tool, also including the theoretical model used and a glossary, is available at http://www.universi‑ dadesaudavel.com.br/e‑books/.
With regard to the sampling plan, the first profile requirement for who would be considered important to respond to the questionnaire, was the involvement with OHP strategies — and not any random PHC team registered in the National Register of Health Establishments (CNES). In fact, according to the CNES record, 6,296 teams worked in the capitals at the time of the study (2,515 teams of oral health from Family
Chart 1. Descriptors matrix: pillars and values of health promotion, Brazil, 2014.
Oral health Healthy public policies Human and social development
1. Recognition of social health Determinants in the development of the assessed strategy 2. Recognition of common risk factors 3. Access to the epidemiological proile of oral diseases and conditions before and during the development of the strategy
4. Comparison and recognition of results reached
5. Strength of the deinition of new goals of the strategy
1. Prioritization of more vulnerable groups
2. Equanimous participation of the target population
3. Partnership between diferent social actors (professionals, institutions and
community leaders)
4. Partnership between diferent health professionals in the territory 5. Partnership with other health promotion activities in the territory
6. Recognition and support of the strategy by the local, district and municipal health administration 7. Speciic resources used for the
development of the strategy 8. Prediction of evaluation of process and results throughout the
development of the strategy 9. Pactuation and recognition of results
by the local UBS 10. Pactuation and recognition of results by the Local Health Council
1. Recognition of values of the target population for the development of the strategy 2. Participation of community in the deinition of priorities, goals, conduction, and evaluation of
the strategy 3. Promotion of evaluation and discussion of the results
generated by the strategy 4. Changes in the process of conducting the strategy based
on suggestions from the community
5. Publication of the strategy for the local community 6. Shared protagonism of the
strategy
7. Development of permanent education actions for health
professionals and diferent social actors 8. Maintenance of results and
beneits of the strategy
Health Strategy, being 1,969 in modality I, and 546 in modality II, added to 3,781 teams in traditional basic care).
To meet the presumed basic criterion of inclusion for the eligible population, the idea was to conirm the number of dental surgeons involved with the OHP, by making direct contact with oral health administrations from the capitals. In parallel, aiming at preventing the sub‑representation of teams in capitals with a larger PHC network, whenever possible the idea was to work with probability proportional to size, respecting the number of den‑ tal surgeons involved with OHP strategies, efectively working, thus generating subsamples of diferent sizes in the capitals.
So, the following actions were taken:
1. Getting in contact with the Health Secretariats in the cities, verbally reassuring the explanation of the research, already informed by printed mail;
2. Aligning the study with the person in charge of oral health coordination;
3. Verifying how health units were organized (if in teams that distinguished between traditional basic care or family health);
4. Establishing with oral health coordination or the administrator in charge, operational, log istic and feasibility matters, including the liberation of professionals in working hours; it was established that the sampling plan would aim at reaching at least 5% of the eligible oral health teams in Brazilian capitals, in order to ensure, whenever possible, the participation of a minimum sample of 25 members per capital;
5. Scheduling a meeting with these professionals and the researchers for data collection.
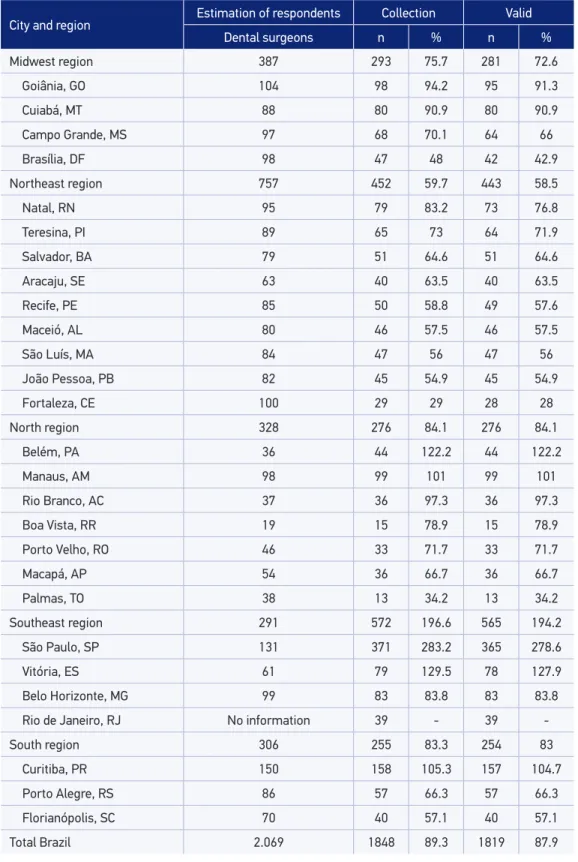
Originally, 2,069 dental surgeons who had been working in PHC for at least a year were identified. According to a statement from their coordinators, they were involved in OHP strategies. The response rate obtained for the set of participating cities was 87.9%. Table 1 presents the proportion of responses per city, starting with the described sampling plan. For data collection, participants attended an event car‑ ried out in each Brazilian capital, lasting an average of three hours each, scheduled in two subsequent sessions:
1. Individual and self‑applicable tool. Interviews with 1,848 dental surgeons (in the end, after procedures conducted to verify the consistency in order to make the base robust, there were 1,819 valid responses). All respondents were asked to describe a single OHP strategy with which they had been involved in PHC, at their choice, with the recommendation that the strategy should be the one they considered to have the highest potential, to promote oral health in the community. More speciically, four initial questions were answered about the identiication of the strategy/intervention in which the professional was involved:
• What is the strategy carried out?
City and region Estimation of respondents Collection Valid
Dental surgeons n % n %
Midwest region 387 293 75.7 281 72.6
Goiânia, GO 104 98 94.2 95 91.3
Cuiabá, MT 88 80 90.9 80 90.9
Campo Grande, MS 97 68 70.1 64 66
Brasília, DF 98 47 48 42 42.9
Northeast region 757 452 59.7 443 58.5
Natal, RN 95 79 83.2 73 76.8
Teresina, PI 89 65 73 64 71.9
Salvador, BA 79 51 64.6 51 64.6
Aracaju, SE 63 40 63.5 40 63.5
Recife, PE 85 50 58.8 49 57.6
Maceió, AL 80 46 57.5 46 57.5
São Luís, MA 84 47 56 47 56
João Pessoa, PB 82 45 54.9 45 54.9
Fortaleza, CE 100 29 29 28 28
North region 328 276 84.1 276 84.1
Belém, PA 36 44 122.2 44 122.2
Manaus, AM 98 99 101 99 101
Rio Branco, AC 37 36 97.3 36 97.3
Boa Vista, RR 19 15 78.9 15 78.9
Porto Velho, RO 46 33 71.7 33 71.7
Macapá, AP 54 36 66.7 36 66.7
Palmas, TO 38 13 34.2 13 34.2
Southeast region 291 572 196.6 565 194.2
São Paulo, SP 131 371 283.2 365 278.6
Vitória, ES 61 79 129.5 78 127.9
Belo Horizonte, MG 99 83 83.8 83 83.8
Rio de Janeiro, RJ No information 39 ‑ 39 ‑
South region 306 255 83.3 254 83
Curitiba, PR 150 158 105.3 157 104.7
Porto Alegre, RS 86 57 66.3 57 66.3
Florianópolis, SC 70 40 57.1 40 57.1
Total Brazil 2.069 1848 89.3 1819 87.9
• Where is it carried out?
• How is it carried out?
Then, the 23 indicators of the tool were illed out.
2. After all the forms were collected, the researchers in charge of data collection conducted a dialogic training about the subject, with the objective of promoting the reflection about health promotion strategies, based on the theoretical basics used in the research. This procedure was rigorously used in all participating cities, except for Rio de Janeiro, since the teams were not previously informed, neither was there an authorization for the activity with the researchers; data collection was conducted by municipal administrators of this capital, and sent by mail.
The database of this study is constituted of 1,819 OHP strategies that were reported by respondents and evaluated. This led to the classiication by scores that is present in the tool. At irst, the collected data were iltered to assess consistency. Right after, a robust database was analyzed in an exploratory manner, verifying the distribution of frequencies and scores obtained. The data were analyzed with the software SPSS v.21.0 and Microsoft Excel® for Mac 2011 v.14.1.0.
In order to identify the variation between the means of the intra and inter‑regional cap‑ itals, the analysis of variance one‑way ANOVA was used, and the post hoc analysis with the Games‑Howell test (multiple comparisons for heterogeneous variances) was used to verify for diferences between the dependent variables, whose mean diferences considered sig‑ niicant were p ≤ 0.05.
RESULTS
Table2. Descriptive statistics of the mean inal score per cities and regions, Brazil, 2014.
City and region n Mean 95%CI Minimum Maximum
Midwest region 281 66.26 63.9 – 68.5 27 111
Campo Grande, MS 64 74.75 69.4 – 80.0 29 111
Goiânia, GO 95 65.27 60.8 – 69.7 27 108
Cuiabá, MT 80 62.63 58.9 – 66.2 27 97
Brasília, DF 42 62.48 58.7 – 66.2 40 95
Northeast region 443 69.25 67.6 – 70.8 27 113
João Pessoa, PB 45 81.87 77.6 – 86.1 48 109
Fortaleza, CE 28 78.54 72.9 – 84.1 56 104
Recife, PE 49 74.63 70.1 – 79.0 49 105
São Luís, MA 47 70.19 64.8 – 75.5 32 102
Aracaju, SE 40 69.48 65.1 – 73.8 41 103
Natal, RN 73 67.77 64.1 – 71.4 30 102
Salvador, BA 51 67.04 61.9 – 72.1 34 104
Teresina, PI 64 64.61 60.1 – 69.0 36 113
Maceió, AL 46 55.65 51.4 – 59.8 27 92
North region 276 64.45 62.1 – 66.7 23 107
Palmas, TO 13 77.31 69.7 – 84.8 61 99
Manaus, AM 99 71.47 68.5 – 74.3 30 104
Porto Velho, RO 33 70.45 64.7 – 76.1 40 105
Rio Branco, AC 36 67.11 61.9 – 72.3 28 91
Macapá, AP 36 56.83 51.1 – 62.5 29 94
Belém, PA 44 51.68 44.5 – 58.8 23 107
Boa Vista, RR 15 43.07 35.1 – 51.0 28 83
Southeast region 565 77.61 76.2 – 78.9 27 115
Rio de Janeiro, RJ (*) 39 92.59 87.8 – 97.3 66 115
Belo Horizonte, MG 83 77.61 74.5 – 80.7 34 107
São Paulo, SP 365 77.09 75.4 – 78.7 33 110
Vitória, ES 78 72.53 69.2 – 75.8 27 104
South region 254 73.85 71.8 – 75.8 38 114
Curitiba, PR 157 74.66 72.0 – 77.3 38 114
Florianópolis, SC 40 73.25 68.5 – 77.9 41 93
Porto Alegre, RS 57 72.04 67.6 – 76.4 38 101
Total Brazil 1819 71.3 70.4 – 72.1 23 115
Among the state capitals performance in the Southeast region, the city of Rio de Janeiro stands out, with mean score value above the average of the region and also above other Brazilian capitals. Belo Horizonte, São Paulo, and Vitória presented the same means, or very close, to the regional average. In the South region, only the city of Curitiba performed better than the mean of the region. However, even being below the regional average, the performance of Florianópolis and Porto Alegre is very sim‑ ilar, which suggests some homogeneity between the essentials that sustain the OHP strategies implemented by health teams in PHC in the region. In the Midwest region, only Campo Grande performed better than the rest of the region. Cities with worse performance in relation to the mean of the region were Goiânia, Cuiabá, and Brasília. Among the nine state capitals composing the Northeast region, performances above the regional mean were João Pessoa, Fortaleza, Recife, São Luis, and Aracaju. Natal, Salvador, Teresina, and Maceió were below average. In the North region, among the seven state capitals composing it, four capitals performed better than the mean of the region — Palmas, Manaus, Porto, and Rio Branco; Macapá, Belém, and Boa Vista were below the regional average.
Aracajú (SE) Belém (PA)
Belo Horizonte (MG)
Boa Vista (RR) Brasília (DF)
Campo Grande (MS)
Cuiabá (MT) Curitiba (PR)
Florianópolis (SC)
Fortaleza (CE) Goiânia (GO)
João Pessoa (PB)
Macapá (AP) Maceió (AL) Manaus (AM) Natal (RN) Palmas (TO)
Porto Alegre (RS) Porto Velho (RO)
Recife (PE)
Rio de Janeiro (RJ)
Salvador (BA) São Luis (MA) São Paulo (SP) Teresina (PI)
100
80
60
40
95%CI Total
Another analysis about the performance of capitals considered its federative insertion, based on the ive Brazilian macro‑regions. Here, the sample was heterogeneous, with great variability in between regions. Aiming at identifying the score variation between the averages of the regions with the variation inside the region, the one‑way ANOVA was performed. The variable Brazilian region demonstrated statistical signiicance to inluence the result (p ≤ 0.01). Also, the Games‑Howell test showed signiicant mean dif‑ ferences in p ≤ 0.05 between the dependent variables according to region, with a clear distinction between the South and the Southeast regions, which formed a block that was signiicantly diferent from the North‑Northeast‑Midwest block. Graph 2 presents the performance of ive Brazilian regions. Therefore, by classifying the regions compara‑ tively, from the best to the worst performance, the Southeast region stands out, followed by the South region and then the Northeast, Midwest, and North regions. Among the regions, only the Southeast region had inal score higher than 75, which characterizes strategies that contemplate the pillars and values of health promotion; therefore, they have higher efectiveness potential.
Graph 2. The efectiveness potential of oral health promotion strategies per region in Brazil, Brazil, 2014.
95%CI Total
80
75
70
65
60
DISCUSSION
Clearly, the results obtained from the 26 Brazilian capitals and the Federal District by the evaluation of the 1,819 OHP strategies indicate a macro‑regional contrast divid‑ ing the country. The South and Southeast regions have better positions in relation to the others regarding the scores obtained in the research instrument used. It is plausible to admit that these outcomes, which show diferent efectiveness potentials, are related to inalist epidemiological outcomes (dental caries, edentulism, among others) in the respective regions — this fact has been demonstrated by a national epidemiological oral health survey (OH)20.
The intra‑regional variation is also remarkable in some cases, since capitals of the same region presented diferent results, as is the case of João Pessoa (better) and Maceió (worse) in the Northeast; in the North region, Palmas (better) and Boa Vista (worse); or Campo Grande (better) and Brasília (worse), in the Midwest region. The South region was very homogeneous, whereas in the Southeast region it is worth to mention the performance of Rio de Janeiro, which can be considered as an outlier, suggesting inconsistency with the rest of the data. This diference may be related to a study limitation, because the procedures used for collecting information were not conducted as predicted, and that may have gener‑ ated a selection or information bias. Another limitation of the study was the inconsistency of information of oral health coordinators as to the number of eligible professionals for the study in their respective capitals.
The results suggest that in specific capitals and/or regions, even in developed ones, that is, even if Brazilians have guaranteed access to strategies presumed as health promotion, there are inequalities. This happens because the strategies put in practice by oral health teams in PHC are not at all or little aligned to the pillars and values of the OHP, according to the adopted theory; therefore, there is poor poten‑ tial for effectiveness13.
The limitations of these actions are owed to the fact that they do not produce sus‑ tainable improvements in the mid and long term for the oral health of the populations. They are palliative measures that ignore the structural factors determining the deicient oral health. As a paradox, one of the possible results of these actions focused on individu‑ als is that inequities, instead of being reduced, can be aggravated, since those with more resources (materials, cognitive, contextual) are more prone to being beneitted by the interventions24,25,26. Therefore, it is important to advocate for OHP strategies that aim at reaching sustainable improvement, with multidimensional and complementary actions for the population. They should make (positive) protective health factors stronger, in order to prevent negative factors that can afect people, contextualized according to their life con‑ ditions and vulnerabilities.
The current National Health Promotion Policy in Brazil indicates the three govern‑ mental spheres as responsible for the establishment of instruments and indicators, to follow‑up and evaluate the objectives deined in the reported policy. It also shows, as one of its guidelines, incentive to produce research in the health promotion ield and the publication of efective initiatives for health professionals, managers, and users of SUS, considering participative methodologies and popular knowledge. It is up to the ser‑ vices to improve the understanding of health promotion in the PHC context, expanding the concept of health beyond the assistance to sick people (always necessary, however, insuicient), thus promoting the quality of life with interventions about the factors put‑ ting the population at risk, or already sufering inevitable damage. The improvement of instruments and techniques of evaluation is essential, as well as its institutionalization as a planning tool, that subsidizes decision‑making processes and aiming at the improve‑ ment of health services27.
The qualiication of OHP in PHC is still challenging, as well as the structure of eval‑ uation models13,28,29. Some initiatives have been experimented, such as the model of “Basic Care evaluation of Management,” in the State of Santa Catarina, whose theory considered the evaluation of PHC based on the principles and guidelines of the SUS27. It also considered the National Program of Improvement of Access and Quality of Basic Care – PMAQ‑AB, which predicts actions that qualify and strengthen the practice of PHC teams from diferent aspects, such as management, attention, and education all over the country. These evaluation models are applicable and useful for cities of dif‑ ferent sizes, enabling the sensitization of managers for the need of improving the qual‑ ity of oral health actions in the local level27. Therefore, studies indicate that PMAQ‑AB was not designed to assess all components in health promotion30. This dimension was reduced to educational actions addressed to speciic groups. So, PMAQ‑AB has limita‑ tions and does not include the dynamics of implementation processes or the evaluation of efectiveness in OH strategies.
oral health action. This is a participative and informative study that shares the view30 that improvements are possible regarding the alignment of OHP strategies, with principles of health promotion and values, making the best use of the applied resources and leading to better oral health12,13.
Inequities in oral health owing to local and regional diferences observed in this study within the ive regions of Brazil and also among each other show another important chal‑ lenge faced by PHC: to promote equality to reach social justice15. It is observed that, in major metropolitan centers, the impact of urban conurbation and high levels of popula‑ tion mobility are factors that dilute the impact of health interventions in the so‑called “tar‑ get‑populations.” This occurrence requires qualiication and valorization of the social role of PHC professionals, and the implementation of policies that clearly predict the facing of DSS in an inter‑sectorial manner, comprehending the health regions16.
CONCLUSION
The diference observed in the comparative analysis between cities and regions with bet‑ ter and worse performances shows the diversity of fundamentals that sustain the assessed strategies. Even though advances have been recognized in the incorporation of new knowl‑ edge and in OHP practices in the last decade, in the public Brazilian sphere, there is still a challenging set of problems involving the epidemiological proile of oral diseases and the resoluteness of care remains alive in the political, scientiic, and service management debate. Developing actions in this direction requires an agenda of healthy public policies, as central reference, for the institutionalized oral health action strengthening compromised structures and processes with the promotion of health. Moreover, the proactive knowledge acquisition is necessary to substantiate consistent practices and the continuing education of the health workforce.
From the same perspective, and as a result of the implementation of PNSB, centered on OHP and surveillance, the improvement and investment in evaluation strategies is required, in order to support the decision‑making about the oral health services manage‑ ment. Institutional commitment is necessary in the public sphere by means of the devel‑ opment of new studies, aiming at assessing practices and supporting the management of PHC. This implies the use of methodologies that enable assessing not only the quantita‑ tive epidemiological results and the impact of interventions, but also the political and social process to reach the goals in a sustainable manner.
ACKNOWLEDGMENTS
1. Brasil. Pacto pela Saúde, 2006. Portaria nº 399, de 22 de fevereiro de 2006. Disponível em: http://conselho. saude.gov.br/webpacto/volumes/01.pdf
2. Brasil. Ministério da Saúde. Diretrizes da Política Nacional de Saúde Bucal: Ministério da Saúde. Brasília: 16p.; 2004. Disponível em: http://conselho.saude.gov. br/web_comissoes/cisb/doc/politica_nacional.pdf 3. Brasil. Ministério da Saúde. Política Nacional de Atenção
Básica – PNAB. Brasília: 110 p.; 2012. Disponível em: http://bvsms.saude.gov.br/bvs/publicacoes/politica_ nacional_atencao_basica.pdf
4. Br asil. Ministério da Saúde. Secretaria de Vig ilância em Saúde, Secretaria de Atenção à Saúde. Política Nacional de Promoção da Saúde ‑ PNPS Brasília: 60p.; 2006. 3 ed. Disponível em: http://bvsms.saude.gov.br/bvs/publicacoes/ PoliticaNacionalPromocaoSaude.pdf
5. Brasil. Ministério da Saúde. Política Nacional de Promoção da Saúde: PNPS: revisão da Portaria MS/GM nº 687, de 30 de março de 2006, (2015). Disponível em: http://portalsaude.saude.gov.br/images/pdf/2015/ abril/20/PNPS‑2015‑inal.pdf
6. Heidmann ITSB, Almeida MCP, Boehs AE, Wosny AM, Monticelli M. Promoção à saúde: trajetória histórica de suas concepções: Texto Contexto Enferm, Florianópolis, 2006; 15(2): 352‑8. Disponível em: http:// www.scielo.br/pdf/tce/v15n2/a20v15n2
7. McQueen DV, Jones CM. Global perspectives on health promotion efectiveness: Springer; 2007. 425p. 8. WHO. World Conference on Social Determinants
of Health 2012. Disponível em: http://www. who.int/sdhconference/resources/Conference_ Report.pdf
9. Westphal MF. Avaliação e monitoramento das práticas de promoção da saúde relacionadas às doenças e ag r avos não tr ansmissíveis na c i d a d e d e S ã o Pa u l o : re l a t ó r i o f i n a l . S ã o Paulo: s.n; 2008. Disponível em: http://www. prefeitura.sp.gov.br/cidade/secretarias/upload/ relatorioenviadoCNPQDANT_1256129352.pdf 10. Barata RB. Desigualdades Sociais e Saúde. In: Campos
GWS, Minayo MCS, Akerman M, Drumond Jr. M, Carvalho YM, organizadores. Tratado de Saúde Coletiva. 2. ed. São Paulo‑Rio de Janeiro. Editora Hucitec‑Fiocruz; 2009. p. 457‑86.
11. Akerman M. Território, governança e articulação de agendas. São Paulo, Centro de Estudos, Pesquisa e Documentação em Cidades e Municípios Saudáveis. 2004. Disponível em: http://www.conseg.sp.gov.br/ Gerenciador/midia/download/30.pdf
12. Kusma SZ, Moysés ST, Moysés SJ. Avaliação da Efetividade de Estratégias de Promoção da Saúde Bucal: ferramenta de avaliação. Curitiba, 2010. Disponível em: http://www.universidadesaudavel.com.br/wp‑content/ uploads/downloads/2015/04/Ferramenta.pdf 13. Kusma SZ, Moysés ST, Moysés SJ. Health promotion:
perspectives for evaluation of oral health in primary healthcare. Cad Saúde Pública. 2012; 28(Suppl): s9‑s19. 14. Moysés SJ. O futuro da Odontologia, no Brasil e no mundo, sob o ponto de vista da Promoção da Saúde (Opinião). Rev Bras Odontol. 2008; 16: 10‑3. 15. Moysés SJ. Inequalities in oral health and oral health
promotion. Braz Oral Res. 2012; 26 Suppl 1:86‑93. 16. Bueno RE, Moysés ST, Bueno PAR, Moysés SJ.
Determinantes sociais e saúde bucal de adultos nas capitais do Brasil. Rev Panam Salud Publica. 2014; 36(1): 17‑23.
17. Pucca Junior GA, Lucena EHG, Cawahisa PT. Financing national policy on oral health in Brazil in the context of the Uniied Health System. Braz Oral Res. 2010; 24: 26‑32.
18. de Salazar L. Feasibility for health promotion under various decision‑making contexts. Global perspectives on health promotion efectiveness: Springer; 2007. p. 353‑65.
19. de Salazar L. Efectividad en promocion de la salud y salud publica. relexiones sobre la practica en America Latina y propuestas de cambio. Universidad del Valle; 2009. 391 p.
20. Moysés SJ, Pucca Junior GA, Paludetto Junior M, Moura Ld. Avanços e desaios à Política de Vigilância à Saúde Bucal no Brasil. Rev Saúde Pública. 2013; 47: 161‑7.
21. Moretti AC, Teixeira FF, Suss FMB, Lawder J, Lima L, Bueno RE, et al. Intersetorialidade nas ações de promoção de saúde realizadas pelas equipes de saúde bucal de Curitiba (PR). Cien Saúde Colet. 2010; 15(Supl 1): 1827‑34.
22. Santos APP, Nadanovsky P, Oliveira BH. Survey of Brazilian governmental health agencies shows conflicting recommendations concerning oral hygiene practices for children. Cad Saúde Pública. 2010; 26: 1457‑63.
23. Adair PM, Burnside G, Pine CM. Analysis of health behaviour change interventions for preventing dental caries delivered in primary schools. Caries Research. 2013; 47(Supl 1): 2‑12.
24. Yevlahova D, Satur J. Models for individual oral health promotion and their efectiveness: a systematic review. Aust Dent J. 2009; 54(3): 190‑7.
25. Watt RG. Strategies and approaches in oral disease prevention and health promotion. Bull World Health Organ. 2005; 83(9): 711‑8.
26. Watt RG. From victim blaming to upstream action: tackling the social determinants of oral health inequalities. Community Dent Oral Epidemiol. 2007; 35(1): 1‑11. 27. Colussi CF, Calvo MCM. An evaluation model for
oral health in primary care. Cad Saúde Pública. 2011;27(9):1731‑45.
28. Starield B. Atenção Primária: equilíbrio entre necessidades de saúde, serviços e tecnologia. Brasília: UNESCO, Ministério da Saúde; 2004. 726p. Disponível em: http://bvsms.saude. gov.br/bvs/publicacoes/atencao_primaria_p1.pdf
29. Campos CEA. Estratégias de avaliação e melhoria contínua da qualidade no contexto da Atenção Primária à Saúde. Rev Bras Saúde Matern Infant. 2005; 5(supl. 1): S63‑9.
30. Cardoso ACC, Santos Júnior RQ, Souza LEP, Barbosa MBCB. Inserção da equipe de saúde bucal no PSF um desafio para a melhoria da qualidade de atenção à saúde. Rev Baiana de Saúde Públ. 2014; 26(1‑2): 94.
Received on: 12/04/2015