163
Rev BRas epidemiol jan-maR 2014; 163-174
AbstrAct:Introduction: The Telephone Survey has several attractions, such as low operational costs and speed the process, when compared to the Household Survey. However, the exclusion of house holds without a landline phone canpose a serious question of the valid it yof the estimates. Objective:Evaluating the use of post stratiication adjustments to correct the potential biasdue to low coverage of landline phonein the results published in the Vigitel system. Methods: We compared the prevalence obtained by the Household Survey and the Vigitel, in Aracaju, Sergipe, where 49% of households had a telephone, calculating the diferences measured between the surveys thatused the square root mean square error as a measure of accuracy of the estimate. Results:The Household Survey showed ten variables associated with landline phone. From this set of variables, post stratiication weights corrected the potential bias of the consumption of beans in ive or more days per week, vegetables intake regularly and recommended self-assessment of health as bad and morbidity of diabetes,while the weights partially eliminated the bias of the prevalence of asthma, possession of health insurance coverage and prevention of breast cancer in women aged 50 to 59 years. Conclusions: In order to reduce the potential bias in the results published by Vigitel system, in areas with low telephone coverage, it becomes necessary to use alternative weighting procedures and selection strategy of external variables for construction of post-stratiication weights.
Keywords: Data collection. Interview. Population surveys. Selection Bias.
Vigitel – Aracaju, Sergipe, 2008: the efects of
post-stratiication adjustments in correcting
biases due to the small amount of households
with a landline telephone
Vigitel – Aracaju, Sergipe, 2008: efeitos da pós-estratiicação na correção de
vícios decorrentes da baixa cobertura de domicílios com telefone ixo
Regina Tomie Ivata BernalI, Deborah Carvalho MaltaII, Otaliba Libânio de Morais NetoIII, Rafael Moreira ClaroIV, Braulio Cesar de Alcantara MendoçaV, Antonio Cesar Cabral de OliveiraV, Nilza Nunes da SilvaVI
IPrograma de Pós-Doutorado da Faculdade de Saúde Pública da Universidade de São Paulo – São Paulo (SP), Brasil. IIEscola de Enfermagem da Universidade Federal de Minas Gerais – Belo Horizonte (MG), Brasil.
IIIDepartamento de Saúde Coletiva, Instituto de Patologia Tropical e Saúde Pública da Universidade Federal de Goiás – Goiânia (GO), Brasil.
IVDepartamento de Nutrição da Universidade Federal de Minas Gerais – Belo Horizonte (MG), Brasil. VNúcleo de Educação Física e Desporto da Universidade Federal de Alagoas – Maceió (AL), Brasil.
VIDepartamento de Epidemiologia,Faculdade de Saúde Pública da Universidade de São Paulo – São Paulo (SP), Brasil.
Corresponding author: Regina Tomie Ivata Bernal. Avenida Doutor Arnaldo, 715, Cerqueira Cesar, CEP: 01246-904, São Paulo, SP, Brazil. E-mail: [email protected]
Conlict of interests: nothing to declare – Financial support: none.
INTRODUCTION
In 2006, the Department of Health Vigilance of the Ministry of Health implemented the Vigilance System of Chronic Disease Risk Factors by Telephone Survey, known as Vigitel, in the 26 Brazilian capitals and in the Federal District. This system collects information about risk and protection factors pertaining to chronic diseases, such as smoking, eating habits, weight excess, physical exercise, excessive alcohol consumption, and self-reported morbidities, among others1. However, the main limitation of Vigitel concerns the exclusion
of households without a landline telephone in the northern and northeastern regions. Due to this exclusion, statistical inferences are made by means of mathematical procedures that adjust the results observed in the population with landline telephones to the population without landline telephones. This procedure has the purpose of correcting any potential biases introduced by the limited amount of landline telephones2,3.
Although the number of landline telephones has increased starting in 2000 in Brazil, the results of the Survey by Household Samples (Pesquisa de Amostras por Domicílios – PNAD)4 carried
out by the Brazilian Institute of Geography and Statistics (IBGE) in 2008 indicate very distinct estimates regarding households served by at least one landline telephone, varying among the capitals from 28% (Boa Vista) to 77% (São Paulo). The northern and northeastern regions have
resumO:Introdução: O Inquérito por Telefone, quando comparado ao Inquérito Domiciliar, apresenta vários atrativos, em especial baixo custo operacional e rapidez do processo de divulgação de resultados. No entanto, a exclusão de domicílios sem telefone ixo pode apresentar problemas na validade externa das estimativas. Objetivo: Avaliar os efeitos do uso de pós-estratiicação para corrigir vícios decorrentes da baixa cobertura de domicílios com telefone nos resultados divulgados no sistema Vigitel. Métodos: Comparar resultados levantados no Inquérito Domiciliar com Vigitel no município de Aracaju, Sergipe, cuja cobertura era de 49% de telefonia ixa. O vício do Vigitel foi expresso pela diferença entre as prevalências do Vigitel e do Inquérito Domiciliar, sendo calculada a raiz quadrada do erro quadrático médio como medida de acurácia da estimativa. Resultados:O Inquérito Domiciliar apontou dez variáveis associadas à posse de linha telefônica residencial (LTR). Desse conjunto de variáveis, os pesos de pós-estratiicação corrigiram os vícios potencias do consumo de feijão em cinco ou mais dias por semana, consumo de folhas, legumes e verduras (FLV) regularmente e recomendado, autoavaliação de saúde considerada ruim e morbidade referida de diabetes,enquanto os pesos eliminaram parcialmente o vício da prevalência de asma, posse de plano de saúde e a cobertura de prevenção de câncer de mama em mulheres de 50 a 59 anos. Conclusões: Tendo em vista a redução dos vícios potencias nos resultados divulgados pelo sistema Vigitel, em regiões de baixa cobertura de telefone ixo, torna-se necessário o uso de procedimentos de ponderação alternativo e a estratégia de seleção de variáveis externas para a construção de pesos de pós-estratiicação.
165
Rev BRas epidemiol jan-maR 2014; 163-174
the lowest percentages – 41 and 45% respectively. In Aracaju, 49% of the households have access to a landline telephone. In the Midwest region, the number reaches 59%, while the highest percentages are in the southeast and South regions, with 70 and 74%, respectively.
Even with this limitation, Vigitel has several appealing features, such as low operational costs and fast publication of results, in comparison to similar household surveys5-7. Nevertheless, three issues
have been pointed out in scientiic productions: the validity of estimates obtained by telephone surveys due to the exclusion of households without a landline telephone8-11; the increase in the
absence of answers10,11; and the methodological procedures used to obtain valid estimates2,3,12-16.
Concerning the rate of non-response, Vigitel’s experience in Brazil difers from that of other countries, as in the case of the Behavior Risk Factor Surveillance System (BRFSS)17,
which has been conducted in the United States for over 20 years. While refusals to participate have increased in the BRFSS over the past decade, the refusal rate has been progressively reduced in the case of Vigitel, reaching only 2.5% in its last edition18.
Our purpose in this study was to evaluate the efects of using post-stratiication to correct biases consequential of the small number of landline telephones in the results divulged by the telephone survey of non-transmissible chronic disease risk and protection factors (Vigitel) conducted in 2008, in Aracaju, Sergipe.
METHODS
The evaluation of the presence of potential biases in the results of the telephone survey was carried out by comparing the results obtained over the telephone to those of a household survey. The prevalence of the variables of the Household Survey was considered as population values9, as they refer to a sample of households with and without landline
telephones. To conduct the study, we adopted the following presuppositions: the prevalence of each variable of the Household Survey has insigniicant biases; the samples of the Vigitel and of the Household Survey are independent.
chronic bronchitis or emphysema, and osteoporosis); of health coverage; of breast cancer prevention in women from 50 to 59 years of age (individuals who had a mammography, and those who had had one in the last two years); and of cervical cancer protection in women from 20 to 59 years of age (had a pap test, and those who had had one in the last three years). These are all qualitative variables, transformed into dichotomous variables that were scored 1 if the answer was positive, and 0 if the answer was negative.
The database of the Household Survey was utilized to identify the possession of landline telephones and to characterize the sociodemographic proile of the population excluded by Vigitel. In the irst stage of the study, the adults of the Household Survey were divided in two strata, namely those who had a residential landline telephone (RLT) and those who did not have one. This enabled us to identify the prevalent factors associated with RLT possession by means of hypothesis testing in order to obtain the diferences in average between the populations with and without a landline telephone, considering a signiicance level of 5%. These data also allowed us to characterize the profile of the individuals who did not use a landline telephone through the model of multiple logistic regression
( x pxp
x x
β β
β π π
+ + + =
− ...
) ( 1
) (
log 1 2 2
⎧ ⎨
⎩ ⎧
⎨ ⎩
)19, in which π (x) expresses the probability of lack of access
to an RLT according to xp characteristics (age range, self-reported skin color, and years of schooling). The explanatory variables were qualitative, and we considered the last category as a reference. The results of a multiple logistic regression are expressed through the odds ratio for a certain xp and reference category. An odds ratio of 1 indicates that the odds are equally probable in both groups. A value above 1 indicates how many times the odds are higher in the irst group, and a value below 1 indicates how many times the odds are lower in the irst than in the second group.
In order to attenuate biases in the estimates of Vigitel due to a limited number of households with landline telephones, the system utilizes post-stratiication weights according to age, sex, and schooling, obtained by the propensity scores method16. These weights were
devised using data from the 2000 Census as an external source, and made available in the database. In order to control the efects of the factor time, new post-stratiication weights were devised based on data from the 2008 National Survey by Household Samples. These weights were obtained by means of the ratio between the relative frequency of the population (PNAD, 2008) and of Vigitel in each cell. In total, 36 cells were obtained, composed of sex (F, M), age range ([20-24], [25-34], [35-44], [45-54], [55-64] e [65-69] and schooling years ([0-8], [9-11] e [12-20].
The prevalence proportions ^(pV) of Vigitel were obtained by using the sample’s basic weight number_landline_telephones
number_adults
multiplied by the post-stratiication weights. In turn, the prevalent factors (p^ of the Household Survey were obtained by using the sample’s basic weights and D) variables of sample planning, as these are data from a complex sampling plan.
The efect of the post-stratiication weights on the prevalent factors detected by Vigitel was expressed by the diference between the prevalence divided by the weight’s sample, and by prevalence divided by the inal weight (ij * post-stratification_weightij
Number of adultsi
number of landline telephonesi
w = ) with
167
Rev BRas epidemiol jan-maR 2014; 163-174
The definition of bias in an estimate is given by [E(ȳ) – Ȳ ]1,2, that is, the difference
between the expected distribution of the sample’s averages and the population value. The lack of knowledge of these parameters is the main difficulty when evaluating biases associated with the sampling process. In this study, we used the difference between two estimates to calculate biases in the Vigitel. Its potential biases are expressed by the difference between the prevalent factors of the Vigitel and of the Household Survey (bias (p^
vigitel) = p^vigitel – p^ household)
8,9. We used the mean squared value (MSE) of the prevalence
MSE [p^
vigitel] = var [p^vigitel] + bias
2 (p^
vigitel)
2,3 and the square root of the MSE (RMSV) as
measures of accuracy. The RMSV informs the distance between the result divulged by the Vigitel system and the population value expressed by estimates of the Household Survey (population with and without landline telephones).
The Household Survey titled “Evaluation of the Efectiveness of the Program Academia da Cidade Aracaju” and the Vigitel were approved by the National Human Research Ethics Committee (CONEP). In the case of Vigitel, the informed consent was replaced by a verbal consent obtained from the interviewees over the telephone.
RESULTS
Upon comparing the prevalent factors between the individuals who had an RLT to those who did not in the Household Survey, we veriied signiicant diferences in 10 of the 22 variables analyzed (Table 1). The group with RLTs was diferent in prevalence proportions related to the regular and recommended consumption of beans, and fruits, vegetables and greens (FGV); to the consumption of meats with visible fat; to self-assessments in which health was deemed poor; to self-reported morbidities, namely diabetes, asthma, asthmatic bronchitis, and chronic bronchitis or emphysema; to health coverage; and to breast cancer prevention in women from 50 to 59 years of age.
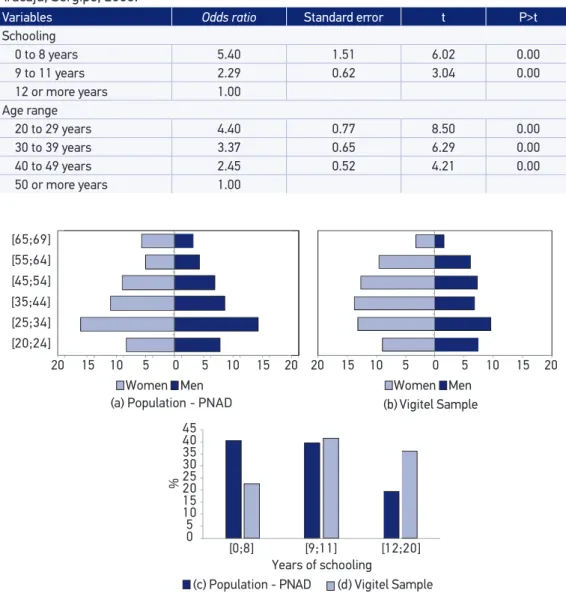
The results of the model of multiple logistic regression, expressed through odds ratios, show that the chance of an adult not being an user of an RLT decreases as schooling years add up. The same relation was found for the age range (Table 2). The variable self-reported skin color was not signiicant in this model.
In 2008, data from the PNAD4 indicated that 49% of the households in Aracaju, Sergipe,
were equipped with a landline telephone. Due to the exclusion of households without landline telephones, it is possible to observe that the age pyramid of Vigitel’s sample is diferent from the population estimated by PNAD4 in 2008 if only the sample’s basic weights are taken into
consideration. This diference also occurred with the variable years of schooling. Upon using propensity procedures to correct statistical inferences, the distribution of Vigitel’s sample was adjusted to that of the population estimated by PNAD4, which was used as an external
Upon assessing the efects of the post-stratiication weights on the prevalent factors divulged by Vigitel, we found that the prevalence associated with having an RLT presented the biggest diferences, except for self-assessments in which health was deemed poor, self-reported diabetes, and mammography examinations. The weights decreased the prevalence of regular and recommended FGV consumption, health plans, and whether female Table 1. Prevalent factors according to landline telephone possession detected in the Household Survey. City of Aracaju, Sergipe, 2008.
Variables
With telephone (n1)
Without
telephone (n2) Diference
p1 p2 p1-p2 p-value
Food consumption
Beans, 5 or more days per week 69.33 80.82 -11.48 0.00
FGV regularl intake 45.21 30.92 14.30 0.00
FGV recommended intake 27.12 15.38 11.73 0.00
Meats with visible fat 27.60 36.47 -8.87 0.00
Whole milk 52.84 54.92 -2.09 0.54
Sugared soda, 5 or more days per week 17.18 21.94 -4.76 0.11
Alcohol consumption
Abusive 22.51 22.90 -0.39 0.88
Dangerous driving 5.06 2.53 2.53 0.06
Smoking
Smoker 12.04 14.81 -2.77 0.12
Smokes more than 20 cigarettes per day 4.46 5.16 -0.70 0.60
Health self-assessment
Poor health 2.18 4.73 -2.55 0.04
Self-reported morbidity
Arterial hypertension 21.60 20.82 0.78 0.71
Diabetes 5.65 2.75 2.90 0.00
Heart attack, stroke or cardiovascular accident 5.88 4.13 1.74 0.13
High cholesterol or triglycerides 2.87 2.65 0.22 0.80
Asthma, asthmatic bronchitis, chronic bronchitis or emphysema 24.41 13.45 10.97 0.00
Osteoporosis 4.99 3.17 1.82 0.12
Health coverage
Has a health plan 48.44 17.77 30.68 0.00
Breast cancer prevention (50 to 59 years of age)&
Had a mammography exam 91.24 61.66 29.57 0.00
Had a mammography exam in the last two years 78.93 47.79 31.14 0.00
Cervical cancer prevention (25 to 59 years of age)§
Had a pap test 85.25 84.87 0.38 0.89
Had a pap test in the last three years 78.22 79.47 -1.25 0.66
FGV: fruits, greens and vegetables.
(*)n1=1,088 (size of the sample with telephone) and n2= 1,180 (size of the sample without telephone).
&n
1 =216 and n2=115. §n
169
Rev BRas epidemiol jan-maR 2014; 163-174
individuals had had a mammography examination in the last two years, and increased the proportion of consumption of beans ive or more days per week, and of meats with visible fat. Among the prevalent factors not associated with having an RLT, the post-stratiication weights increased — in less than 2% — the prevalence proportions of consumption of whole milk, and sugared soda and alcohol, while self-reported arterial hypertension, heart attack, Figure 1. Age pyramid and distribution of the variable years of schooling, according to the surveys. City of Aracaju, Sergipe, 2008.
Women Men Women Men
[20;24] [25;34] [35;44] [45;54] [55;64] [65;69]
(a) Population - PNAD (b) Vigitel Sample
0 5 10 15 20 25 30 35 40 45
%
Years of schooling
(c) Population - PNAD (d) Vigitel Sample
20 15 10 5 0 5 10 15 20
20 15 10 5 0 5 10 15 20
[0;8] [9;11] [12;20]
Table 2. Odds ratio estimates related to non-users of residential landline telephones obtained through the model of multiple logistic regression. Household Survey conducted in the city of Aracaju, Sergipe, 2008.
Variables Odds ratio Standard error t P>t
Schooling
0 to 8 years 5.40 1.51 6.02 0.00
9 to 11 years 2.29 0.62 3.04 0.00
12 or more years 1.00
Age range
20 to 29 years 4.40 0.77 8.50 0.00
30 to 39 years 3.37 0.65 6.29 0.00
40 to 49 years 2.45 0.52 4.21 0.00
and cervical cancer prevention decreased up to 2.6%. It is also observable that the prevalence proportions that were lower than or equal to 10%, or above 90% presented diferences that did not reach 1% (Table 3).
Table 3. Weighted prevalence, standard errors, and absolute diferences detected in Vigitel. City of Aracaju, Sergipe, 2008.
Variables
Sample’s weight Final weight
|B-A| Prevalence
(A)
Standard error
Prevalence (B)
Standard error
Food consumption
Beans, 5 or more days per week# 68.08 1.22 72.74 1.40 4.66
FGV regular intake# 39.74 1.29 34.27 1.55 5.47
FGV recommended intake# 21.58 1.08 18.48 1.23 3.10
Meats with visible fat# 24.82 1.15 29.08 1.64 4.25
Whole milk 46.34 1.32 47.43 1.68 1.09
Sugared soda, 5 or more days per week 11.56 0.84 12.82 1.15 1.26
Alcohol consumption
Abusive 17.75 1.01 19.48 1.39 1.73
Dangerous driving 2.54 0.42 2.99 0.66 0.45
Smoking
Smoker 10.66 0.83 11.50 1.06 0.84
Smokes more than 20 cigarettes per day 3.70 0.49 4.24 0.71 0.53
Health self-assessment
Poor health# 2.28 0.39 3.03 0.71 0.74
Self-reported morbidity
Arterial hypertension 26.40 1.17 25.20 1.42 1.20
Diabetes# 6.64 0.65 6.32 0.76 0.32
Heart attack, stroke or cardiovascular accident 6.67 0.66 5.57 0.62 1.11
High cholesterol or triglycerides 2.74 0.41 2.90 0.51 0.16
Asthma, asthmatic bronchitis, chronic
bronchitis or emphysema#
27.74 1.17 25.05 1.44 2.69
Osteoporosis 4.61 0.56 4.66 0.70 0.04
Health coverage
Has a health plan# 54.46 1.33 41.63 1.58 12.82
Breast cancer prevention (50 to 59 years of age)
Had a mammography exam# 94.74 1.24 94.41 1.67 0.33
Had a mammography exam in the last
two years#
81.72 2.34 78.21 3.60 3.51
Cervical cancer prevention (25 to 59 years of age)
Had a pap test 85.80 1.41 83.33 1.90 2.46
Had a pap test in the last three years 80.68 1.58 78.05 2.06 2.63
#Prevalence related to having a residential landline telephone (RLT).
171
Rev BRas epidemiol jan-maR 2014; 163-174
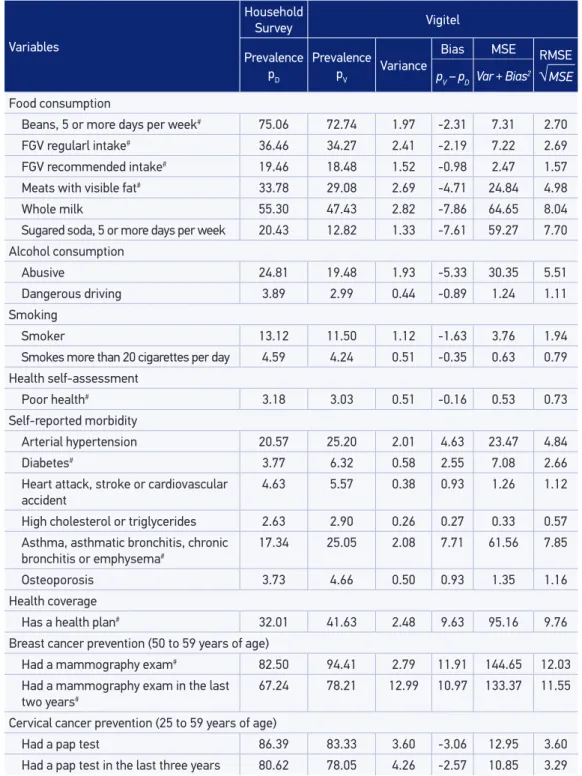
In the evaluation of potential biases, the results pointed to the presence of absolute biases that were above 2% in 14 of the 22 prevalent factors. Vigitel underestimates the prevalence rates that monitor indicators of food consumption, alcohol consumption, and cervical cancer prevention among women from 25 to 59 years of age. On the other hand, Vigitel overestimates the prevalence rates of self-reported morbidities, the possession of health coverage, and breast cancer prevention among women from 50 to 59 years of age. Out of the 15 prevalent factors, 8 are associated with having an RLT, with biases varying from 2.31 to 12.99% (Table 4).
The post-stratiication weights corrected the potential biases of consumption of beans ive days or more per week, as well as of regular and recommended FGV intake, and also partially eliminated potential biases regarding the consumption of meats with visible fat, self-reported asthma, health plan possession, and breast cancer prevention among women from 50 to 59 years of age. Among the variables not associated with having an RLT, the presence of biases concerning the consumption of whole milk (7.9%), sugared soda ive or more days per week (7.7%), and abusive alcohol intake (5.5%) stand out, as well as self-reported arterial hypertension, at 4.8% (Table 4).
DISCUSSION
In 2008, only 49% of the permanent, private households located in the capital of Sergipe, Aracaju, were equipped with a landline telephone, according to data from PNAD4.
Non-users of landline telephones are concentrated in classes with less years of schooling and among younger individuals. These results are consistent with other studies that identiied the proile of individuals who do not use landline telephones10,20.
The results of the Household Survey point to ten prevalent factors associated with having an RLT, namely regular consumption of beans, regular and recommended consumption of FGV, consumption of meats with visible fat, self-assessment of health deemed poor, self-reported diabetes, asthma, asthmatic bronchitis, chronic bronchitis or emphysema, health coverage, and breast cancer prevention among women between 50 and 59 years old. In this set of prevalent factors, the post-stratiication weights corrected potential biases concerning the consumption of beans ive or more days per week, and consumption of FGV regularly down to levels below 3%. The weights also partially eliminated the potential bias regarding the prevalence of asthma, possession of a health plan, and breast cancer prevention among women between 50 and 59 years old. Bernal21 found a similar result for
Table 4. Mean squared error of the prevalent factors detected in Vigitel. City of Aracaju, Sergipe,2008.
Variables
Household
Survey Vigitel
Prevalence pD
Prevalence
pV Variance
Bias MSE RMSE
√
MSEpV – pD Var + Bias 2
Food consumption
Beans, 5 or more days per week# 75.06 72.74 1.97 -2.31 7.31 2.70
FGV regularl intake# 36.46 34.27 2.41 -2.19 7.22 2.69
FGV recommended intake# 19.46 18.48 1.52 -0.98 2.47 1.57
Meats with visible fat# 33.78 29.08 2.69 -4.71 24.84 4.98
Whole milk 55.30 47.43 2.82 -7.86 64.65 8.04
Sugared soda, 5 or more days per week 20.43 12.82 1.33 -7.61 59.27 7.70
Alcohol consumption
Abusive 24.81 19.48 1.93 -5.33 30.35 5.51
Dangerous driving 3.89 2.99 0.44 -0.89 1.24 1.11
Smoking
Smoker 13.12 11.50 1.12 -1.63 3.76 1.94
Smokes more than 20 cigarettes per day 4.59 4.24 0.51 -0.35 0.63 0.79
Health self-assessment
Poor health# 3.18 3.03 0.51 -0.16 0.53 0.73
Self-reported morbidity
Arterial hypertension 20.57 25.20 2.01 4.63 23.47 4.84
Diabetes# 3.77 6.32 0.58 2.55 7.08 2.66
Heart attack, stroke or cardiovascular accident
4.63 5.57 0.38 0.93 1.26 1.12
High cholesterol or triglycerides 2.63 2.90 0.26 0.27 0.33 0.57
Asthma, asthmatic bronchitis, chronic
bronchitis or emphysema#
17.34 25.05 2.08 7.71 61.56 7.85
Osteoporosis 3.73 4.66 0.50 0.93 1.35 1.16
Health coverage
Has a health plan# 32.01 41.63 2.48 9.63 95.16 9.76
Breast cancer prevention (50 to 59 years of age)
Had a mammography exam# 82.50 94.41 2.79 11.91 144.65 12.03
Had a mammography exam in the last
two years#
67.24 78.21 12.99 10.97 133.37 11.55
Cervical cancer prevention (25 to 59 years of age)
Had a pap test 86.39 83.33 3.60 -3.06 12.95 3.60
Had a pap test in the last three years 80.62 78.05 4.26 -2.57 10.85 3.29
#Prevalence related to having a residential landline telephone (RLT).
173
Rev BRas epidemiol jan-maR 2014; 163-174
However, the international scientiic production on the presence of biases in Telephone Surveys8-11 shows that propensity scores eliminate biases only partially. The results found in
the Vigitel Aracaju system corroborate the international literature.
With the purpose of reducing potential biases, another strand of research uses alternative methods known as dual frame22 and multiple mode and frame23 surveys. These methods utilize
more than one set of records for random sampling and have some advantages over the Telephone Survey. Previously, the greatest challenge was obtaining valid estimates for data from multiple sets of records, but with current technological advancements, algorithms are available to aid in obtaining valid estimates. Nevertheless, Flores-Cervantes et al.13 alert that,
for surveys with a low rate of households with landline telephones, the dual frame survey has a relatively high cost, which also makes its use unfeasible.
CONCLUSION
In Aracaju, Sergipe, non-users of landline telephones are concentrated in less favored social classes, and present a higher prevalence in variables related to risk factors, such as the consumption of meat with visible fat.
In general, the post-stratiication weights partially eliminated estimate biases, whose origin is associated with the limited number of households equipped with a landline telephone. However, in Aracaju, we observed that the method of propensity scores had a poor performance in reducing biases when a given prevalence detected in the population with landline telephones was below 10% or above 90%.
With the purpose of reducing potential biases in results divulged by the Vigitel system in regions with a small number of landline telephones, it is necessary to use alternative weighting procedures and strategies of selection of external variables in order to devise post-stratiication weights. The use of alternative methods with multiple sets of records is also necessary in order to increase Vigitel’s coverage.
In Brazil, the challenge lies in the lack of methodological studies on the estimation of biases resulting from the absence of response and from the limited sets of records that are used in random sampling.
REFERENCES
1. Brasil. Vigitel Brasil 2006. Vigilância de fatores de risco e proteção para doenças crônicas por inquérito telefônico: estimativas sobre freqüência e distribuição sócio-demográica de fatores de risco e proteção para doenças crônicas nas capitais dos 26 estados brasileiros e no Distrito Federal em 2006. Brasília: Ministério da Saúde; 2007 2. Kish L. Survey Sampling. New York: John Wiley &
Sons; 1965.
3. Kalton G. Compensating for Missing Survey Data. An Arbor, Michigan: Institute for Social Research, The University of Michigan; 1983.
4. Instituto Brasileiro de Geografia e Estatística. Microdados da Pesquisa Nacional por Amostra de Domicílios-2008. Rio de Janeiro; 2009.
6. Nathan G. Telesurvey methodologies for household surveys - areview and some thoughts for the future. Survey Methodology 2001; 27: 7-31.
7. Monteiro CA, Moura EC, Jaime PC, Lucca A, Florindo AA, Figueiredo ICR, et al. Monitoramento de fatores de risco para doenças crônicas por entrevistas telefônicas. Rev Saude Publica 2005; 39: 47-57.
8. Groves RM. Nonresponse rates and nonresponse bias in household survey. Public Opinion Quarterly, 70 (5), Special Issue, 2006, p. 646-75. Disponível em http://poq.oxfordjournals.org/content/70/5/646. full (Acessado em 12 de dezembro de 2009). 9. Kerckhove V, Montaquilla JM, Carver PR, Brick
JM. An Evaluation of Bias in the 2007 National Household Education Surveys Program: Results From a Special Data Colletion Effort (NCES 2009-029).National Center for Education Statistics, Institute of Education Sciences, US Department of Education. Washington, DC; 2008.
10. Battaglia MP, Frankel MCR, Link MW. Improving Standard Poststratiication Techniques for Random-Digit-Dialing Telephone Surveys. Survey Research Methods 2008; 2: 11-9. ISSN 1864-3361. Disponível em http:// w4.ub.uni-konstanz.de/srm/article/view/597/1295 (Acessado em 24 de novembro de 2010).
11. Lepkowski JM, Tucker C, Brick J, De Leeuwe E, Japec L, Lavraskas PJ, et al. Advanced in Telephone Survey Methodology. New York: John Wiley & Sons, Inc; 2008.
12. Kalton G, Flores-Cervantes I. Weighting Methods. J Oicial Statistics 2003; 19: 81-97.
13. Flores-Cervantes I, Brick JM, Jones ME. Weighting for nontelephone household in the 2001 California Health Interview Survey. Joint Statistical Meetings – Section on Survey Research Methods; 2002. 14. Brick JM,Keeter S, Waksberg J, Bell B, Westat Inc.
Adjusting for Coverage Bias Using Telephone Service Interruption Data, NCES 97-336, US Department of Education. National Center for Education Statistics, project otlcer. Washington; 1996. Disponível em http://nces.ed.gov/pubs/97336.pdf. (Acessado em 24 de novembro de 2010).
15. Izrael D, Battaglia MP, Frankel MR. Extreme Survey Weight Adjustment as a Component of Sample Balancing (a.k.a. Raking).SAS Global Forum paper 2009. Disponível em http://www.abtassociates. com/Page.cfm?PageID=40858&FamilyID=8600. (Acessado em 12 de dezembro de 2010).
16. Lee S, Valliant R. Weighting Telephone Samples Using Propensity Scores. Advanced in Telephone Survey Methodology. New York: John Wiley &Sons, Inc.; 2008. 17. CDC. Center for Disease Control and Prevention.
Behavioral Risk Factor Surveillance System – BRFSS. Survey Data and Documentation, 2009. Disponível em http://www.cdc.gov/brfss/technical_infodata/ weighting.htm. (Acessado em 12 de dezembro de 2010). 18. Ministério da Saúde. Vigitel Brasil 2010. Vigilância de
fatores de risco e proteção de doenças crônicas por inquérito telefônico: estimativas sobre freqüência e distribuição sócio-demográfica de fatores de risco e proteção para doenças crônicas nas capitais dos 26 estados brasileiros e no Distrito Federal em 2010. Brasília; 2011. 19. Paula GA. Modelos de reg ressão com apoio
computacional. São Paulo: IME - USP; 2004. 20. Thornberry JR OT, Massey JT. Correcting for Undercoverage
Bias in Random Digit Dialed National Health Survey. National Center for Health Statistics, 1978. Disponível em http://www.amstat.org/sections/srms/proceedings/ papers/1978_045.pdf. (Acessado em 25 de outubro de 2010). 21. Bernal RTI. Inquéritos por Telefone: inferências
válidas em regiões com baixa taxa de cobertura de linhas residenciais. [Tese de Doutorado]. São Paulo: Faculdade de Saúde Pública, USP; 2011.
22. Groves RM, Lepkowski JM. Dual Frame, Mixed Mode Survey Designs. Journal of Oicial Statistics. 1985: 1(3): 263-86. Disponível em http://www.jos.nu/Articles/ article.asp. (Acessado em12 de dezembro de 2010). 23. Brick JM, Lepkowski JM. Multiple Mode and Frame
Telephone Survey. Advanced in Telephone Survey Methodology. New York: John Wiley &Sons, Inc.; 2008. Received on: 10/01/2012