Airton José RombaldiI,II
Marilda Borges NeutzlingIII
Marcelo Cozzensa da SilvaI,II
Mario Renato AzevedoI,II
Pedro Curi HallalI,II
I Programa de Pós-Graduação em Educação Física. Universidade Federal de Pelotas (UFPel). Pelotas, RS, Brasil
II Grupo de Estudos em Epidemiologia da Atividade Física. Escola Superior de Educação Física. UFPel. Pelotas, RS, Brasil III Departamento de Medicina Social.
Faculdade de Medicina. Universidade Federal do Rio Grande do Sul. Porto Alegre, RS, Brasil
Correspondence:
Airton José Rombaldi R. Luis de Camões, 625 – Areal 96055-630 Pelotas, RS, Brasil E-mail: [email protected] Received: 9/28/2009 Approved: 9/8/2010
Article available from: www.scielo.br/rsp
Factors associated with regular
non-diet soft drink intake
among adults in Pelotas,
Southern Brazil
ABSTRACT
OBJECTIVE: To assess factors associated with regular intake of non-diet soft drinks among adults.
METHODS: Population-based cross-sectional study including 972 adults (aged 20 to 69) in the city of Pelotas, Southern Brazil, conducted in 2006. The frequency of non-diet soft drink intake in the 12 months prior to the study was evaluated by the question: “In general since last <month>, how many times did you have a non-diet soft drink?”. The answers were dichotomized for the analysis. Intake of non-diet soft drinks fi ve times or more per week was considered regular intake. The association between the outcome and sociodemographic, behavioral and nutritional variables was tested using the chi-square test for heterogeneity and linear trend and a multivariate analysis was performed through Poisson regression with a robust variance.
RESULTS: Approximately one in every fi ve adults (20.4%) reported regular intake of non-diet soft drinks. Males (PR 1.50; 95%CI 1.20;2.00), smokers (RP 1.60; 95%CI 1.20;2.10) and those reporting weekly intake of snacks (PR 2.10; 95%CI 1.60;2.70) had higher prevalence of non-diet soft drink intake in the adjusted analysis. The analysis stratifi ed by gender showed that in women regular intake of fruits and vegetables was protective against soft drinks consumption (PR 0.50; 95%CI 0.30;0.90).
CONCLUSIONS: Regular intake of non-diet soft drinks among adults was high, particularly among men, young adults and smokers.
DESCRIPTORS: Adult. Soft Drinks. Food Consumption. Diet Surveys. Cross-Sectional Studies.
INTRODUCTION
The WHO recommendation has been a priority of public health policies in many countries. The recommended maximum calorie intake is 10% of total dietary energy intake.21 Soft drinks have been banned from schools in England and France and their sale has been restricted or prohibited in the United States (Los Angeles, Philadelphia and Miami).18 The Dietary Guide for the Brazilian Populationa recommends a reduction of at least one-third the current consumption of these foods as a strategy for healthy eating.
The identifi cation of factors associated with soft drink consumption is a fi rst step to approach high-risk groups. Previous studies8,17 have pointed out gender, low education and age as major determinants of soft drink consumption. Recent studies7,18,23 have also showed that dietary quality may be associated with the consumption of soft drinks. Compared to other countries such as the United States,7,17 and European countries,19 there are few data in Brazil about soft drink consumption and factors associated. The most recent Family Budget Survey conducted in Brazilb showed a signifi cant increase in the consumption of soft drinks (400%) compared to the 1970s. The consumption of soft drinks may be even higher since the Family Budged Survey data included only consumption at home. The Telephone-Based Surveillance of Risk and Protective Factors forChronic Diseases (Vigitel) 2007c showed that the rate of adults reporting regular consumption of soft drinks diet ranged from 21.0% in Aracaju, Northeastern Brazil, to 31.7% in Porto Alegre, Southern Brazil, and 38.4% in Macapá, Northern Brazil. The consumption rate was higher among men and decreased with age and education.
The present study aimed to assess factors associated with non-diet soft drink consumption in adults.
METHODS
A cross-sectional population-based study was conducted in the city of Pelotas, Southern Brazil. Pelotas is located in the extreme south of the state of Rio Grande do Sul with about 340,000 inhabitants. According to the Instituito Brasileiro de Geografi a e Estatística (IBGE – Brazilian Institute of Geography and Statistics), there are 408 urban household census tracts, which are arranged in a “spiral” from downtown to the districts. Of 404 census tracks including households, 40 were randomly selected for inclusion in the study, covering the city’s entire urban area. We generated a random starting point for each track drawn for the selection of
a Ministério da Saúde, Secretaria de Atenção à Saúde, Coordenação-Geral da Política de Alimentação e Nutrição. Guia alimentar para a população brasileira. Brasília (DF); 2005
b Instituto Brasileiro de Geografi a e Estatística. Pesquisa de Orçamentos Familiares 2002–2003: análise da disponibilidade domiciliar de alimentos e do estado nutricional no Brasil. Rio de Janeiro; 2004
c Ministério da Saúde. Vigitel Brasil 2007. Vigilância de fatores de risco e proteção para doenças crônicas por inquérito telefônico. Brasília (DF); 2008
d Associação Brasileira de Empresas de Pesquisa. Critério de classifi cação econômica Brasil. São Paulo; 2006[cited 2009 Feb 25]. Available from: http://www.abep.org/codigosguias/CCEB2008-Base2006e2007.pdf
households to be included in the study. The fi rst house-hold was selected and then the next ones were system-atically selected by skipping every seven households, up to 15 households were included in each census track. There were selected 600 households for the study. All residents aged 20 and 69 years were sampled, except those with severe physical or mental disabilities that would prevent them from answering the questionnaire.
We performed two estimates for the sample size. The sample size to assess the prevalence of soft drink consumption was estimated at 35.0% for a margin of error of 4.0%, 95% confi dence interval, an addition of 10% for losses and refusals and a design effect of 1.5. It was estimated a sample of 901 respondents. For the assessment of the association between soft drink consumption and independent variables, the following parameters were used for estimating the sample size: 95% confi dence level, 80% power, exposure preva-lence ranging from 10% to 90%, prevapreva-lence ratio of 1.7, addition of 10% for non-respondents and 15% for controlling for confounders and a design effect of 1.5. The estimated sample consisted of 990 respondents.
Information on demographic and socioeconomic characteristics and health and nutritional status were collected using a standard questionnaire with 100 questions. The variable skin color was reported by interviewer observation and socioeconomic status was classifi ed according to the Associação Brasileira de Empresas de Pesquisa (Brazilian Association of Research Companies) criteria.d The level of physical activity during leisure time was assessed using the long version of the International Physical Activity Questionnaire (IPAQ).3 A cutoff of 150 minutes per week was set to classify individuals as physically active or inactive.3 Nutritional status was evaluated using body mass index (BMI), which was calculated based on self-reported weight and height and classifi ed according to WHO criteria.20
times a week (regular use). Consumption was evaluated over a 12-month period prior to the interview.
Both male and female interviewers aged 18 years or more with a minimum requirement of complete high school education attended theory and practical sessions of a 20-hour training program. Interviewers were consistently supervised during the fi eldwork. The supervisors, who were physical education and physical therapy undergraduate students, reviewed the questionnaires and carried out quality control checks through re-visits to 25% of the sample. Data obtained from questionnaires were double entered using EpiInfo 6.0 and the analysis was conducted using Stata 9.0.
The crude analysis tested the relationship between the outcome and gender, age, skin color/ethnicity, socioeconomic status, smoking, leisure-time physical activity, nutritional status, regular consumption of fruits and vegetables (fi ve or more times a week) and weekly consumption of snack foods (burgers and hot dogs) (once or more a week). The chi-square test was used for testing heterogeneity and linear trend. Multivariate analysis was performed through Poisson regression with robust variance. The sampling effect was taken into consideration in the analysis using Stata svy commands. The level of signifi cance was set at 5%.
The study was approved by the Research Ethics Committee of the Escola Superior de Educação Física da Universidade Federal de Pelotas on 01/17/2008 (protocol No. 005/2008). Data were collected after respondents signed an informed consent form.
RESULTS
Of 514 households selected, 1,062 adult residents were eligible to participate in the study. Of them, 972 answered the questionnaire (nonresponse rate of 9.3%). The independent variable with most missing values was BMI as 87 respondents did not know their weight and/or height.
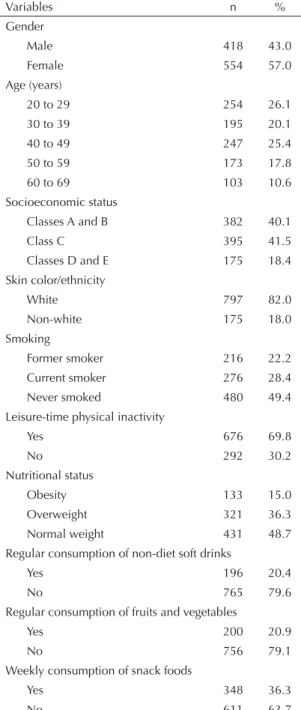
The study sample was characterized by: 57% were female; 26.1% aged between 20 and 29 years; 41.5% were categorized in class C; 82% were white; 49.4% have never smoked; 69.8% were sedentary; 51.3% were overweight or obese; 20.9% reported regular consumption of fruits and vegetables; and 36.6% reported snack food consumption on a weekly basis (Table 1).
Regular consumption of non-diet soft drink was 20.4% (95% CI 17.9;22.9). The design effect, considering the census track as the sampling unit, was 1.6. Additional analyses showed that the design effect using the house-hold as the sampling unit was 1.4 for regular consump-tion of non-diet soft drinks.
Table 2 shows the frequency of consumption of regular non-diet soft drinks and the prevalence ratios for the independent variables. There were no statistically signifi cant differences in age, socioeconomic status, skin color/ethnicity, leisure-time physical inactivity, nutritional status and regular consumption of fruits and vegetables. In the adjusted analysis, males, current smokers, and those who reported snack food consump-tion had the highest prevalence of regular consumpconsump-tion of non-diet soft drinks.
Table 1. Description of the sample according to sociodemographic, behavioral, nutritional and health-related variables. Pelotas, Southern Brazil, 2006. (n=972)
Variables n %
Gender
Male 418 43.0
Female 554 57.0
Age (years)
20 to 29 254 26.1
30 to 39 195 20.1
40 to 49 247 25.4
50 to 59 173 17.8
60 to 69 103 10.6
Socioeconomic status
Classes A and B 382 40.1
Class C 395 41.5
Classes D and E 175 18.4 Skin color/ethnicity
White 797 82.0
Non-white 175 18.0
Smoking
Former smoker 216 22.2 Current smoker 276 28.4
Never smoked 480 49.4
Leisure-time physical inactivity
Yes 676 69.8
No 292 30.2
Nutritional status
Obesity 133 15.0
Overweight 321 36.3
Normal weight 431 48.7 Regular consumption of non-diet soft drinks
Yes 196 20.4
No 765 79.6
Regular consumption of fruits and vegetables
Yes 200 20.9
No 756 79.1
Weekly consumption of snack foods
Yes 348 36.3
After adjusting for potential confounders, it was found that the variables regular consumption of fruits and vegetables (inverse association) and weekly consump-tion of snack foods (direct associaconsump-tion) among females and smoking and consumption of snack foods (direct association) among males remained associated with regular consumption of non-diet soft drinks (Tables 3 and 4).
DISCUSSION
The study sample was representative of adults aged 20 to 69 years living in the city of Pelotas in view of the high proportion of respondents and low loss and refusal rate. One of the study limitations is that comparisons with results from other studies should be treated with caution due to different sampling and Table 2. Factors associated with regular consumption of non-diet soft drinks. Pelotas, Southern Brazil, 2006. (n=972)
Variables
Regular consumption
of non-diet soft drinks PR (95%CI) Adjusted PR (95%CI)a p
n %
Gender 0,001b
Male 113 27.4 1.80 (1.40;2.33) 1.50 (1.20;2.00)
Female 83 15.2 1 1
Age (years) 0.10c
20 to 29 69 27.3 2.10 (1.22;3.62) 1.50 (0.80;2.60) 30 to 39 44 23.2 1.78 (1.01;3.15) 1.50 (0.80;2.60)
40 to 49 38 15.5 1.19 (0.66;2.14) 1.00 (0.60;1.80) 50 to 59 32 18.5 1.42 (0.78;2.58) 1.34 (0.70;2.40)
60 or more 13 13.0 1 1
Socioeconomic status 0.36c
Classes A and B 78 20.5 1.16 (0.80;1.69) 1.30 (0.90;1.90) Class C 82 20.8 1.17 (0.81;1.71) 1.30 (0.90;1.90)
Classes D and E 31 17.7 1 1
Skin color/ethnicity 0.55b
White 157 20.0 0.89 (0.65;1.21) 0.90 (0.70;1.30)
Non-white 39 22.4 1 1
Smoking <0.001c
Never smoked 84 17.8 1 1
Current smoker 79 28.7 1.62 (1.24;2.12) 1.60 (1.20;2.10) Former smoker 33 15.5 0.87 (0.60;1.26) 1.00 (0.70;1.05)
Leisure-time physical inactivity 0.80b
Yes 132 19.7 0.90 (0.69;1.18) 0.97 (0.70;1.30)
No 63 21.9 1 1
Nutritional status 0.56c
Obesity 27 20.8 0.94 (0.64;1.37) 1.10 (0.70;1.60) Overweight 64 20.0 0.90 (0.68;1.20) 0.90 (0.70;1.20)
Normal weight 94 22.1 1 1
Regular consumption of fruits and vegetables
Yes 26 13.0 0.59 (0.40;0.86) 0.70 (0.50;1.10) 0.09b
No 167 22.1 1 1
Weekly consumption of snack foods
Yes 113 32.6 2.42 (1.88;3.11) 2.10 (1.60;2.70) <0.001b
No 82 13.5 1 1
data collection procedures and frequency of use clas-sifi cations. Reverse causality bias may be present in the association between frequency of non-diet soft drink consumption and nutritional status as obese overweight may modify their consumption because of their nutritional status. In addition, there may be recall error as the period of consumption studied was 12 months prior to the interview.
A fi fth (20.4%) of the adults studied in Pelotas regularly consumed non-diet soft drinks. The design effects for both the census track and the household were very close to those obtained in the sample size estimation and controlled for in the statistical analyses.
The rate of non-diet soft drink consumption found in this study is much lower than that reported in the United States. In 2007 Dhingra et al5 found that 35% of adults in the Framingham Study consumed non-diet soft drinks at least once a day. Our fi ndings are similar to that reported in a Brazilian study on risk factors for noncommunicable diseases (Vigitel).c
Corroborating other studies,10,17 the present study found higher rates of non-diet soft drink consumption among men, and no signifi cant differences were seen regarding age, socioeconomic status and skin color/ethnicity. However, other authors reported differences in age,10,15 socioeconomic status4 and color skin/ethnicity.4 Table 3. Factors associated with regular consumption of non-diet soft drinks in women. Pelotas, Southern Brazil, 2006. (n=554)
Variables
Regular consumption
of non-diet soft drinks PR (95%CI) Adjusted PR (95%CI)a P
n %
Age (years) 0,16b
20 to 29 28 20.9 4.04 (1.28;12.77) 3.66 (0.90;14.50) 30 to 39 22 19.3 3.73 (1.16;11.96) 3.47 (0.90;14.06) 40 to 49 15 10.3 1.99 (0.60;6.61) 2.21 (0.50;9.10) 50 to 59 15 15.6 3.02 (0.91;10.00) 4.10 (1.00;16.60)
60 or more 03 5.2 1 1
Socioeconomic status 0.40b
Classes A and B 26 12.4 0.79 (0.45;1.41) 1.20 (0.57;2.52) Class C 40 17.2 1.10 (0.65;1.87) 1.50 (0.76;3.00)
Classes D and E 16 15.7 1 1
Skin color/ethnicity 0.74c
White 63 14.3 0.76 (0.48;1.19) 0.92 (0.55;1.52)
Non-white 20 18.9 1 1
Smoking 0.35c
Never smoked 41 13.7 1 1
Current smoker 28 20.0 1.46 (0.94;2.26) 1.40 (0.89;2.21) Former smoker 14 12.8 0.94 (0.53;1.65) 1.09 (0.60;1.97)
Leisure-time physical inactivity 0.20c
Yes 68 16.4 1.46 (0.86;2.46) 1.40 (0.80;2.60)
No 15 11.3 1 1
Nutritional status 0.30b
Obesity 13 17.1 1.25 (0.70;2.25) 1.50 (0.80;2.80) Overweight 26 17.0 1.25 (0.78;2.00) 1.29 (0.80;2.00)
Normal weight 34 13.7 1 1
Regular consumption of fruits and vegetables 0.03c
Yes 14 9.5 0.56 (0.32;0.96) 0.50 (0.30;0.90)
No 68 17.1 1 1
Weekly consumption of snack foods <0.001c
Yes 43 25.7 2.49 (1.68;3.69) 2.30 (1.05;3.40)
No 39 10.3 1 1
Among current smokers the rate of non-diet soft drink consumption was signifi cantly higher, which is consis-tent with other studies.5,11,15 This fi nding confi rms the trend that a health risk behavior is associated with a range of other health risk behaviors.5,11
We did not find any association between excess weight and non-diet soft drink consumption, which contrast with the results from recent reviews and meta-analyses.13,18 A recent systematic literature review13 has pointed a positive association between higher consumption of sugar-sweetened beverages and weight
gain and obesity in children and adults. In a meta-analysis including 88 studies, Vartanian et al18 found a strong association between soft drink consumption and increased energy intake and body weight. Possibly the cross-sectional design of our study was a limiting factor in the analysis of this association.
One possible explanation for weight gain resulting from overconsumption of sugar-sweetened beverages is different physiological effects of energy intake from solid and liquid foods on satiety. Thus, carbohydrates form liquid foods would promote a higher positive Table 4. Factors associated with regular consumption of non-diet soft drinks in men. Pelotas, Southern Brazil, 2006. (n=418)
Variables
Regular consumption
of non-diet soft drinks PR (95%CI) Adjusted PRa
(95%CI) p-value
n %
Age (years) 0.70b
20 to 29 41 34.5 1.45 (0.80;2.63) 0.90 (0.50;1.80) 30 to 39 22 29.0 1.22 (0.64;2.32) 1.10 (0.60;2.10)
40 to 49 23 23.2 0.98 (0.51;1.87) 0.80 (0.40;1.50) 50 to 59 17 22.1 0.93 (0.47;1.84) 0.80 (0.40;1.70)
60 or more 10 23.8 1 1
Socioeconomic status 0.20b
Classes A and B 52 30.4 1.48 (0.89;2.45) 1.60 (0.90;2.80) Class C 42 25.9 1.26 (0.75;2.12) 1.40 (0.80;2.40)
Classes D and E 15 20.6 1 1
Skin color/ethnicity 0.70c
White 94 27.3 0.98 (0.64;1.48) 1.10 (0.70;1.70)
Non-white 19 27.9 1 1
Smoking <0.001c
Never smoked 43 24.7 1 1
Current smoker 51 37.8 1.53 (1.09;2.14) 1.90 (1.30;2.70)
Former smoker 19 18.3 0.74 (0.46;1.20) 1.10 (0.70;1.80)
Leisure-time physical inactivity 0.14c
Yes 64 25.0 0.81 (0.59;1.11) 0.80 (0.60;1.10)
No 48 31.0 1 1
Nutritional status 0.07b
Obesity 14 25.9 0.76 (0.46;1.24) 0.80 (0.50;1.40) Overweight 38 22.8 0.67 (0.47;0.94) 0.60 (0.40;0.90)
Normal weight 60 34.1 1 1
Regular consumption of fruits and vegetables 0.20c
Yes 12 22.6 0.81 (0.48;1.38) 0.70 (0.40;1.20)
No 99 27.8 1 1
Weekly consumption of snack foods <0.001c
Yes 70 38.9 2.10 (1.51;2.91) 1.80 (1.30;2.60)
No 43 18.5 1 1
energy balance. Possibly because liquid foods cause less gastric distension and have faster transit time, the body would not properly “identify” the energy contained in these foods with incomplete compensation for energy consumed in liquid form.1,6
Contrasting with previous studies,11,15 no signifi cant association was seen between regular consumption of non-diet soft drinks and physical inactivity in our study. However, this result should be treated with caution as these studies used different instruments and criteria for classifi cation of physical activity levels.
A signifi cant association was found between weekly consumption of snack foods and regular consumption of non-diet soft drinks. Other authors2,5,12,16 have argued that in general people who regularly consume soft drinks also eat nutritionally poor diets because these beverages would stimulate their appetite for non-nutritious foods. A study16 showed that individuals who consume more
soft drinks have diets with a higher glycemic index, confi rming the assumption that intake of foods with high glycemic index such as soft drinks would stimulate the intake of other similar foods.12 Another study have showed that consumption of soft drinks is associated with the consumption of burgers and pizza.2
Regular consumption of fruits and vegetables was inversely associated with that of non-diet soft drinks, especially in females. A similar association was reported by Marshall et al14 in U.S. children, by Figueiredo et al9 in adults in São Paulo and in young adults in Japan.23
1. Almiron-Roig E, Chen Y, Drewnowski A. Liquid calories and the failure of satiety: how good is the evidence? Obes Rev. 2003;4(4):201-12. DOI:10.1046/ j.1467-789X.2003.00112.x
2. Bes-Rastrollo M, Sanchez-Villegas A, Gomez-Gracia E, Martinez JA, Pajares RM, Martinez-Gonzalez MA. Predictors of weight gain in a Mediterranean cohort: the Seguimiento Universidad de Navarra Study 1. Am J Clin Nutr. 2006;83(2):362-70; quiz 94-5.
3. Craig CL, Marshall AL, Sjostrom M, Bauman AE, Booth ML, Ainsworth BE, et al. International physical activity questionnaire: 12-country reliability and validity. Med Sci Sports Exerc. 2003;35(8):1381-95. DOI:10.1249/01.MSS.0000078924.61453.FB
4. Deshmukh-Taskar P, Nicklas TA, Yang SJ, Berenson GS. Does food group consumption vary by differences in socioeconomic, demographic, and lifestyle factors in young adults? The Bogalusa Heart Study. J Am Diet Assoc. 2007;107(2): 223-34. DOI:10.1016/j. jada.2006.11.004
5. Dhingra R, Sullivan L, Jacques PF, Wang TJ, Fox CS, Meigs JB, et al. Soft drink consumption and risk of developing cardiometabolic risk factors and the metabolic syndrome in middle-aged adults in the community. Circulation. 2007;116(5): 480-8. DOI:10.1161/CIRCULATIONAHA.107.689935
6. DiMeglio DP, Mattes RD. Liquid versus solid carbohydrate: effects on food intake and body weight.
Int J Obes Relat Metab Disord. 2000;24(6):794-800. DOI:10.1038/sj.ijo.0801229
7. Duffey KJ, Popkin BM. Adults with healthier dietary patterns have healthier beverage patterns. J Nutr.
2006;136(11):2901-7.
8. Elfhag K, Tynelius P, Rasmussen F. Sugar-sweetened and artifi cially sweetened soft drinks in association to restrained, external and emotional eating. Physiol Behav. 2007; 91(2-3):191-5. DOI:10.1016/j. physbeh.2007.02.005
9. Figueiredo IC, Jaime PC, Monteiro CA. Factors associated with fruit and vegetable intake among adults of the city of Sao Paulo, Southeastern Brazil.
Rev Saude Publica. 2008; 42(5):777-85. DOI:10.1590/ S0034-89102008005000049
10. Garriguet D. Beverage consumption of Canadian adults. Health Rep. 2008;19(4):23-9.
11. Kvaavik E, Andersen LF, Klepp KI. The stability of soft drinks intake from adolescence to adult age and the association between long-term consumption of soft drinks and lifestyle factors and body weight.
Public Health Nutr. 2005;8(2):149-57. DOI:10.1079/ PHN2004669
12. Ludwig DS. The glycemic index: physiological mechanisms relating to obesity, diabetes, and cardiovascular disease. JAMA. 2002;287(18):2414-23. 13. Malik VS, Schulze MB, Hu FB. Intake of
sugar-sweetened beverages and weight gain: a systematic review. Am J Clin Nutr. 2006;84(2):274-88. 14. Marshall TA, Eichenberger Gilmore JM, Broffi tt B,
Stumbo PJ, Levy SM. Diet quality in young children is infl uenced by beverage consumption. J Am Coll Nutr.
2005;24(1):65-75.
15. Palmer JR, Boggs DA, Krishnan S, Hu FB, Singer M, Rosenberg L. Sugar-sweetened beverages and incidence of type 2 diabetes mellitus in African American women. Arch Intern Med. 2008;168(14):1487-92. DOI:10.1001/archinte.168.14.1487
16. Schulze MB, Manson JE, Ludwig DS, Colditz GA, Stampfer MJ, Willett WC, et al. Sugar-sweetened beverages, weight gain, and incidence of type 2 diabetes in young and middle-aged women. JAMA. 2004;292(8):927-34.
17. Storey ML, Forshee RA, Anderson PA. Beverage consumption in the US population. J Am Diet Assoc. 2006; 106(12):1992-2000. DOI:10.1016/j. jada.2006.09.009
18. Vartanian LR, Schwartz MB, Brownell KD. Effects of soft drink consumption on nutrition and health: a systematic review and meta-analysis. Am J Public Health. 2007; 97(4):667-75. DOI:10.2105/AJPH.2005.083782
19. Vereecken CA, Inchley J, Subramanian SV, Hublet A, Maes L. The relative infl uence of individual and contextual socio-economic status on consumption of fruit and soft drinks among adolescents in Europe. Eur J Public Health. 2005;15(3):224-32. DOI:10.1093/ eurpub/cki005
20. World Health Organization. Physical Status: the use and interpretation of anthropometry - Report of a WHO Expert Committee. Geneva; 1995. (WHO Technical Report Series, 854).
21. World Health Organization. Food and Agriculture Organization of the United Nations. Expert Consultation on Diet, Nutrition and the prevention diseases. Diet Nutrition and the Prevention of chronic diseases: report of a joint WHO/FAO WHO expert consultation. Geneva; 2003. (WHO Technical Report Series, 916).
22. Wolff E, Dansinger ML. Soft drinks and weight gain: how strong is the link? Medscape J Med.
2008;10(8):189.
23. Yamada M, Murakami K, Sasaki S, Takahashi Y, Okubo H. Soft drink intake is associated with diet quality even among young Japanese women with low soft drink intake. J Am Diet Assoc. 2008; 108(12):1997-2004. DOI:10.1016/j.jada.2008.09.033
REFERENCES