An Index of Susceptibility to Drought (
ISD
)
for the Semiarid Brazilian Northeast
Josemir Araujo Neves
1, Silvio de Barros Melo
2, Everardo Valadares de Sá Barreto Sampaio
3 1Empresa de Pesquisa Agropecuária do Rio Grande do Norte, Parnamirim, RN, Brazil.
2
Centro de Informática, Universidade Federal de Pernambuco, Recife, PE, Brazil.
3
Departamento de Energia Nuclear, Universidade Federal de Pernambuco, Recife, PE, Brazil.
Received: 4/2/2015 - Accepted: 24/9/2015
Abstract
This work presents the development of a composite Index of Susceptibility to Drought (ISD) for semiarid Brazilian Northeast that considers climatology, physical properties, soil usage, social and economic aspects, the risk of harvest losses and the shortage of human and animal drinking water. The index started with the Index FUNCEME of drought Se-verity (IFS), developed by FUNCEME. Then, it evolved to use some tools proposed by the Joint Research Centre/Orga-nization for Economic Co-operation and Development (JRC/OECD), as well as techniques of multiple imputation for missing data and datawinsorization. The work was tested and validated with real data from Rio Grande do Norte State in three climatologic scenarios (dry, regular and rainy). A multivariate analysis test and a Monte Carlo simulation were also produced for a sensibility and strength analysis of the developed model. These analyses validated the composition model and the obtained results with real data. TheISDcan be used as a tool to support decision makers in various government levels to help guide the actions for the drought-affected areas.
Keywords:drought index, composite indicators, Semiarid Brazilian Northeast.
Um Índice de Susceptibilidade ao Fenômeno da Seca (
ISFS
)
para o Semiárido Nordestino
Resumo
Esse trabalho teve como objetivo o desenvolvimento de um Índice de Susceptibilidade ao Fenômeno da Seca (ISFS) para o semiárido nordestino brasileiro, que considera além da climatologia, aspectos da natureza física e uso dos solos, aspectos econômicos, sociais e os riscos de perda da safra agrícola e de falta de água para consumo humano e animal. O índice foi desenvolvido tendo como base o Índice FUNCEME de Severidade de seca (IFS) e foi elaborado usando ferramentas propostas pelo Joint Research Centre/Organization for Economic Co-operation and Development (JRC/OECD), e usando também técnicas de preenchimento de dados com falhas ewinsorização. Ele foi testado e validado com os dados reais do Estado do Rio Grande do Norte em três cenários climatológicos (ano seco, normal e chuvoso). Foram realizados também um teste de análise multivariada e uma simulação de Monte Carlo para a análise de sensibilidade e robustez do modelo desenvolvido, cujos resultados validaram a sua composição e os resultados obtidos com dados reais. O ISFS pode ser utilizado como uma ferramenta de auxílio aos decisores, em vários níveis governamentais, para orientar as ações de socorro às áreas atingidas pela seca.
Palavras-chave:índice de seca, indicadores compostos, Semiárido Nordestino.
1. Introduction
The phenomenon of drought is characterized by the partial or total absence of rain or by its irregular distribu-tion. Drought is cyclic and occurs more often in and is char-acteristic of semiarid regions around the world, even
though it may also happen in regions with higher levels of precipitation. Compared with other natural disasters, such as floods, earthquakes and hurricanes, the impacts of drought are silent but no less severe due to the combination of slow effects, periodicity, political assistance measures
Artigo
that keep local populations dependent on governmental aid and worker migration to areas with higher economical flux, which creates several social problems such as increase of population living in slums in large cities. Thus, the severity of a drought is not only associated with environmental as-pects, the scarcity of water, and limiting ecological factors for plants, animals and humans but also the social, eco-nomic and cultural conditions of the affected populations. (Dantas, 1961; Guerra, 1981; Duarte, 2002; Freitas, 2005).
In Brazil, the Northeast Semiarid region is the region most affected by drought, with the first historical record of this phenomenon occurring in the XVI century (Dantas, 1961; Guerra, 1981; Carvalho, 1988). Since then, droughts have been repeatedly recorded in the region, with harmful effects, particularly on agriculture, livestock and the water supply of urban and rural populations (Dantas, 1961; Guer-ra, 1981; Duarte, 2002; Moreira Filho, 2002; Pessoa, 2002; Freitas, 2005). The main meteorological phenomenon asso-ciated with drought occurrences in the Northeast Semiarid region is the El-Niño Southern Oscillation (ENSO) (Nobre and Melo, 2004; Araújo et al., 2008). The ENSO has
caused droughts in the Brazilian Northeast and in many gions around the world in addition to floods in other re-gions, such as the Southern and Southeastern regions of Brazil. During the ENSO-positive phase, the Northeast Semiarid region experiences a seasonal decrease in rains and consequently an increase in drought intensity (Alveset al., 1998; Bruniniet al., 2005; Andreoli and Kayano, 2007; Mendonça and Danni-Oliveira, 2007; Araújoet al., 2008;
Gonzalezet al., 2013; Kayanoet al., 2013; Kayano and
Capistrano, 2014).
Even disregarding the ENSO, still the Tropical Atlan-tic (TA) has influenced the variability of precipitation in the Brazilian Northeast, due to the anomalies of Sea Surface Temperature (SST). The SST’s influence is more remark-able in the Tropical South Atlantic (TSA) than in the Tropi-cal North Atlantic (TNA). Researchers have demonstrated that when the SST’s anomalies show balanced values, but with signs TSA and TNA opposing each other, the precipi-tation’s anomalies are more pronounced in the Brazilian Northeast. Nevertheless, the probability of these events oc-cur without the ENSO’s influence is somewhere around 12% (Andreoli and Kayano, 2007; Gonzalezet al., 2013).
Another issue to be considered is the impact of global climate change. Studies have shown that for the Brazilian Northeast is expected a reduction in rainfall with a conse-quent increase in periods of drought accompanied by an in-crease in temperature in the range of 3 to 5.5 °C, for the worst case scenario projected by the Intergovernmental Panel on Climate Change (IPCC) until the end of this cen-tury. Should this scenario occur disastrous consequences in food production will follow, causing food insecurity due to
the decrease of subsistence farming in the region (Marengo, 2006; Angelotti; Sá; Melo, 2009; PBMC, 2013).
In recent years, significant progress has been made in the monitoring of climatic events in the Northeast Semiarid region. An example of this is the climatic and weather mon-itoring accomplished by the Center for Weather Fore-casting and Climate Studies/ National Institute for Space Research - CPTEC/INPE (http://www.cptec.inpe.br), with its northeastern climatic regional centers, among them the Meteorology Foundation of Ceará State (FUNCEME) (http://funceme.br). A service resulting from this monitor-ing is the drought-occurrence forecast. This forecast allows the executive governmental sphere to plan actions to miti-gate the effects of droughts, which typically only occur when the drought has already been completely established, farming is in decline, and the population is in a state of ca-lamity, suffering shortages of water even for basic human consumption.
Drought forecasting is also realized through the use of drought indexes, which are tools that trace relevant infor-mation using aggregation, quantification and simplification to understand the phenomenon. In short, drought indexes are essential tools for facilitating a more precise diagnosis of drought magnitude in the affected regions, and several models of evaluation exist for this purpose. Simpler drought indexes consider only meteorological and/or hy-drological variables (Byun and Whilite, 1999). The most sophisticated indexes also associate the precipitation level to economic, social, cultural, environmental and political parameters of the affected regions (Byun and Wilhite, 1999; Pandeyet al., 2010; Magalhães and Martins, 2011). This is the case with the Index FUNCEME of drought Se-verity (IFS), developed in 2000 by FUNCEME (Ensslinet al., 2000; FUNCEME, 2000; Silvia and Forte, 2002). The
IFS considers climatology, physics, social and economic aspects, risk of harvest loss and the rural and urban water supply status of affected cities (Ensslin et al., 2000;
FUNCEME, 2000; Silvia and Forte, 2002). However, most likely due to its complex data structure and operational dif-ficulty, this index has not been deployed and has remained a mere prototype.
insur-ance) per 100 rural residents; 7.Climatology; 8.Standard deviation of rainfall; 9.Runoff; 10.Rainfall distribution in-dex; 11.Aridity inin-dex; 12.Coverage rate of urban water supply (Neves, 2010; Magalhães and Martins, 2011). All sub-indicators have an equal weight in the composite index, however its application until now has been limited to the state of Ceará (Neves, 2010).
The drought phenomenon’s inherent complexity im-plies that a single index hardly would be suitable because it cannot summarize all the factors involved in drought events. Complex indices should produce superior results and more appropriate answers for the mitigation of the drought impact and improved preparation strategies (Smakhtin and Huges, 2004).
The necessity for the development of more indexes with data and accessible information, deployed in user-friendly software to facilitate its implementation to clarify drought phenomenon in the Northeast Semiarid region is clear. Such indexes could become a valuable tool to aid de-cision makers in fund allocation as well as directing effec-tive actions to confront the effects of drought.
In this context, this work describes the Index of Sus-ceptibility to Drought (ISD) for the Brazilian semiarid
re-gion that was subject of a doctoral thesis developed by Neves (2010) and that considers climatology, the aspects of physical nature and the land usage, economics, social fac-tors, the risk of harvest losses and shortages of human and animal drinking water at the local level. TheISDwas
devel-oped from IFS and evolved by using some tools proposed by the Joint Research Center of the European Commis-sion/Organization for Economic Co-operation and Devel-opment - JRC/OECD (http:/www.oecd.org, Nardoet al.,
2009). More details about theISDwill be presented in the
methodology item.
The paper is structured as follow: Section 2 describes the material and methodology. Section 3 presents the re-sults and discussions. Summary and concluding remarks are presented in Section 4.
2. Materials and Methods
The construction of the ISD started with the IFS
(Ensslinet al., FUNCEME, 2000; Silva and Forte, 2002)
using the same dimensions and weights or importance lev-els, and then it evolved by using as a methodological basis some tools for the construction of composite indicators pro-posed by the JRC/OECD (Nardoet al., 2009). TheISD
con-sists of using statistical techniques of multiple imputation for missing data and datawinsorization, which is defined as
a statistical transformation that brings the extreme observa-tions tom ±c(mis the median andcÎÂ). TheISDwas
im-plemented in a computer application written in the C#
language for operational use. TheISDwas tested and
vali-dated with real data related to the municipalities of the Rio Grande do Norte state situated in the Brazilian Northeast. It was subjected to a sensibility analysis through a Monte Carlo simulation. The analysis results validated the munici-pality classification obtained in the tests with real data and ensured the consistency of the weights used in its composi-tion. Mainly, the available variants and/or alternatives that represent a qualitative improvement over the parameters originally used in theISDas well as the information
avail-ability were considered.
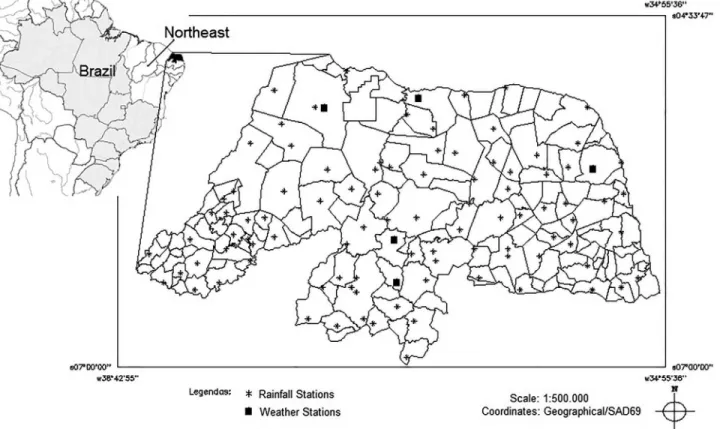
The rainfall daily data of 93 rainfall stations and five weather stations, distributed over 85 municipalities in the nineteen micro-regions of the Rio Grande do Norte State (RN), Brazil (Fig. 1), were used for obtaining the climato-logical normal of each of the municipalities, for theISD
validation and computation. The data used were provided by the Rio Grande do Norte Agricultural Research Com-pany (EMPARN). The data were filtered and only those rainfall stations with at least 30 years of data were consid-ered, totaling 93 stations in 85 municipalities out of the State’s 167 municipalities.
In addition, other data sets were used, as follow: areas of fallow, permanent and temporary crops and native and planted pastures, according to the 2006 IBGE Agricultural Census; population data from the 2000 IBGE Census; rural Gross Domestic Product (GDP) and total GDP of the mu-nicipalities in the Rio Grande do Norte State (IBGE, 2005); current municipality income data from the National Trea-sure Secretariat – Farm Secretariat (IBGE, 2007); national data concerning sanitation – Ministry of Cities (www.snis.gov.br); and agricultural suitability information for RN municipalities (MA/DNPEA-SUDENE/DRN, 1971).
TheISDvalidation was based on real data from Rio
Grande do Norte (1963 to 2006). It was chosen four years of daily rainfall data from a series (1963 to 2006), consist-ing of a regular rainfall scenario (2000), two dry years (1998 and 2005) and a rainy year scenario (2006).
Finally, the results were evaluated by using multi-variate analysis of the data aiming at validating the propor-tions ofISDcomponents after an analysis of sensibility by
using a Monte Carlo simulation. The main objective is to estimate the confidence intervals of the developed model, the stochastic dominance of the municipalities’ classifica-tion and the consistency of the weights used in the building of the index. The data multivariate analysis was conducted through the application of Principal Component Analysis (PCA) in all tested years as implemented in the R’s PRCOMP library.
TheISDsensibility analysis was performed by using
a Monte Carlo Simulation based on Butleret al.(1997).
tested years were modeled by the generation of 5,000 simu-lations of those sub-indicators in the R system, by using the
Mersenne Twisterpseudo-random number generator. Then
the statistics were computed, and boxplots together with a final graph to evaluate the stochastic dominance of the model alternatives were generated. One alternative, A, is said tostochastically dominatethe classification of an
al-ternative B in the stochastic dominance plot if B is never above or to the left of A (Butleret al., 1997).
For the second stage, the relaxation of the ISD
weights used was accomplished by using a two-step simu-lation approach: 1) randomization that preserves the sub-indicator weight order but allows different weight values, and 2) randomization that preserves the order of sub-indi-cator weights and maintains equal values among the origi-nal weights of some sub-indicators. The same simulation parameters were used. The same statistics, plots and graph-ics as used in the previous simulation were generated. This final analysis stage examined the impact of the original weight changes on the results ofISDclassification in the
different tested scenarios.
The R scripts used in the Monte Carlo simulation were run on a computer with a 4-GHz Core 2 Duo processor and 4 GB of RAM, and the processing time was approxi-mately 7 min for the first simulation and 56 min for the sec-ond simulation.
2.1. The compositeISD
TheISDwas built with seven sub-indicators (Fig. 2), e.g. VP11, VP12, VP21, VP22, VP131, VP132,VP133, and its meaning are shown in the Table 1. The termVPused in the codification of the sub-indicators is the abbreviation for “viewpoint”. The numbers to the right of the sub-indicators stand for their levels of importance or significance in the model.
Figura 1- Location of the sites (rainfall and weather stations) in Rio Grande do Norte, Brazil, used in this work.
Figura 2-ISDStructure. The term VP is the abbreviation for “viewpoint”.
TheISDis obtained by the following equation:
ISD w I w w w
I
m t
u u m t u u m t = + + = ¹ -=
å
, , , with and 1 71 2 7 1
1
K
(1)
whereISDm
t = indicator value for the municipality
min
pe-riodt, withm= 1, 2, ..,L;Lindicates the total number of
municipalities,Iu m t
, = normalized value of the sub-indicator
u for the municipalitymat timet,wu= weight associated
with the sub-indicator u with w1 = 0.15; w2 = 0.12;
w3= 0.15;w4= 0.12;w5= 0.06;w6= 0.2;w7= 0.2. Assuming that
Iq m f x
t
q q m t
, = ( , ) [ ,Î 0100] [ ]È -1
withxu m t
, = raw value of the sub-indicatorufor the
munici-pality m at timet; fu( ) = normalization function of the
sub-indicatoru.
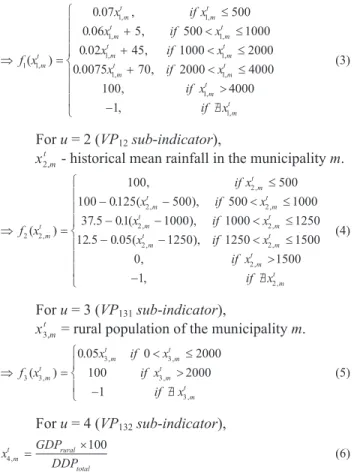
Thus, for the Rio Grande do Norte state the functionf
is defined as follows:
Foru= 1 (VP11sub-indicator),
xtm WASm APCm ATCm FAm NPAm PPAm 1
1000 ,
( )
= + + + + (2)
whereWASm= Weight (score) of the Agricultural
Suitabil-ity of municipalSuitabil-ity land m; APCm = Area of Permanent
Crops in the municipalitym(ha);ATCm= Area of
Tempo-rary Crops in the municipalitym(ha);FAm= Fallow Area in
the municipalitym(ha);NPAm= Native Pasture Area of the
municipalitym(ha);PPAm= Planted Pasture Area in the
municipalitym(ha).
Þ =
£
+ <
f x
x if x
x if m t m t m t m t 1 1 1 1 1
0 07 500 0 06 5 500
( ) . , . , , , , , x
x if x
x m t m t m t m 1 1 1 1 1000 0 02 45 1000 2000 0 0075 , , , , . , . £
+ < £
t m t m t m t if x if x if x
+ < £
>
- /$
70 2000 4000 100 4000 1 1 1 1 , , , , , , ì í ï ï ï î ï ï ï (3)
Foru= 2 (VP12sub-indicator),
x m
t
2, - historical mean rainfall in the municipalitym.
Þ = £ - -f x if x x if m t m t m t 2 2 2 2 100 500 100 0125 500 5
( )
, . ( ),
,
,
, 00 1000
37 5 01 1000 1000 125
2
2 2
< £
- - < £
x
x if x
m t m t m t , , ,
. . ( ), 0 12 5 0 05 1250 1250 1500
0 2 2 2 . . ( ), , , , ,
- - < £
>
x if x
if x m t m t m t 1500 1 2 - /$ ì í ï ï ï î ï ï ï , ,
if xtm
(4)
Foru= 3 (VP131sub-indicator),
xtm
3, = rural population of the municipalitym.
Þ =
< £ >
-f x
x if x
if x m t m t m t m t 3 3 3 3 3
0 05 0 2000 100 2000 ( ) . , , , ,
1 if x3m t /$ ì í ï î ï , (5)
Foru= 4 (VP132sub-indicator),
x GDP DDP m t rural total 4 100 , = ´ (6)
where the rural and total GDP(Gross Domestic Product) re-fer to the year preceding the calculation
Þ =
>
- < £
f x
if x
x if x
m t m t m t m t 4 4 4 4 4 100 50 3 2 60 37 5
( )
,
. , .
,
,
, , 50
2 4 30 25 37 5 16 10 12 5
4 4 4 4 . , . . , . , , ,
x if x
x if x
m t m t m t
- < £
- < ,
, , , . . , m t m t m t m t
x if x
if x £ < > - /$ ì í ï ï ï î ï ï ï 25 0 8 0 12 5
1
4 4
4
(7)
Foru= 5 (VP133sub-indicator),
x m
t
5, = current income per capita received by
munici-pality m in the year preceding the calculation
Þx = current income population m t m m 5, ( ) (8) Þ = £ - < f x if x
x if x
m t m t m t m t 5 5 5 5 5 100 150 120 3 2 150 ( )
, . ,
,
,
, , <
³ - /$ ì í ï ï î ï ï 900 0 900 1 5 5 x if x m t m t , , (9)
Foru= 6 (VP21sub-indicator),
xm
t
6, = rainfall Distribution Index (RDI) for the
munic-ipalitymat timet.
Þx = ´IS
P m t 6 100 , (10)
Tabela 1- List of indicators for drought susceptibility, respective weights and levels of importance.
Indicators Meaning Weigths / levels
of importance
VP11 Represent the physical characteristics of the municipalities and are obtained from the agricultural suitability of soils and use of land of the municipalities.
0.15
VP12 Represent the weather conditions by the historic mean rainfall of the municipali-ties.
0.12
VP131 Represent the basic rural characteristics by the rural population of the municipal-ities.
0.15
VP132 Represent the basic rural characteristics by the participation of the agricultural activities in GDP of the municipalities.
0.12
VP133 Represent the local conditions that can mitigate the drought effects based on the current municipality income per capita.
0.06
VP22 Indicate the risks associated with harvest lost and is based on the rain distribution in the municipalities.
0.20
VP21 Indicate the risks associated with short-ages of human and animal drinking wa-ter of the municipalities.
and IS P ND ND obs = ´ ´ ´ -j j j 1 3 2
( ) (11)
whereIS= Drought index;j1= Number of days with rain;
j2= Duration in days of the longest period without rain;
j3= Number of days in the longest period of rain that did not occur in a short summer less than 15 days;Pobs=
Precip-itation during the period;P= Average rainfall for the period
chosen for the entire state;ND= Total number of days in
the period chosen for calculating the RDI.
Þ =
- £
-f x
x if x
x if m t m t m t m t 6 6 6 6 6
100 01 50 120 0 5 5
( )
. , . ,
,
, ,
, 0 150
97 5 0 35 150 250 13 33 01
6
6 6
< £
- < £
-x
x if x
m t m t m t , , , . . ,
. . 34 10 250 1000 0 1000
1
6 6
6
6
x if x
x if x m t m t m t m , , , , , . ,
- < £
>
- /$ t
ì í ï ï ï î ï ï ï (12)
Foru= 7 (VP22sub-indicator),
Þ = ´
+ ´ x I I I m t 7 055 050 022 1 1 , (13)
whereI055= Index of total water service;I050= Index of to-tal linear losses;I022= Average per capita consumption of water.
Þ =
- £
-f x
x if x
x if m t m t m t m t 7 7 7 7 7
100 0 26 250 55 0 8
( )
. , . ,
,
, ,
, 250 500
30 0 03 500 1000
0 1
7
7 7
7 < £
- < £
> x
x if x
x m t m t m t m t , , , , . , 000 1 7 - /$ ì í ï ïï î ï ï
ï if xm
t ,
(14)
Notably, the above described functions were adjusted for the Rio Grande do Norte State conditions. Thus, utiliza-tion of theISDin another state and/or region would require
adjustments of all of the functions with the exception of the
VP21sub-indicator function.
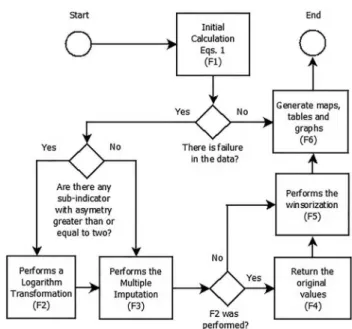
TheISDcalculation occurs in a maximum of six stages (Fig. 3). When data are not missing, the procedure will be finished in a minimum of two stages. In stage one (F1), all variables of the seven sub-indicators are calculated accord-ing to the previously described equations. A sub-indicator is computed as missing when one of the variables that contrib-ute to this sub-indicator is missing or absent. Stage two (F2) is optional; it will only be necessary if there is a sub-indicator with an asymmetry greater than or equal to two. This proce-dure is performed to improve the characteristics of the data distribution and to achieve the conditions of multivariate normality required by the multiple imputation data method used in the next stage. Stage three (F3) consists of multiple imputation of the missing data from the initial phase. There are three available methods for multiple imputation: Predic-tive Mean Matching, Bayesian Linear Regression and Markov-Chain Monte Carlo. Stage four (F4) only will occur
if F2 is executed, and stage five (F5) consists of the winsorization procedure, using two allowable patterns of winsorization (5% and 10%). Finally, stage six (F6) involves the generation of the final map with theISDresults, the chart containing the municipality drought susceptibility calcula-tions and radar graphics displaying the impact of each of the sub-indicators in the index composition.
TheISDclassification is based on the quantiles of
dis-tribution of the index for the data mass of the region ad-justed by the region of interest in five categories: high susceptibility (ISD > q0.85), medium-high susceptibility (q0.65<ISD £q.085), medium susceptibility (q0.35<ISD£
q.065), medium-low susceptibility (q0.15<ISD£q.035), and low susceptibility (ISD£q.015) (Xavier and Xavier, 1999). The classification data obtained after the adjustments for Rio Grande do Norte State are given in Table 2.
3. Results and Discussion
3.1. Validation of theISDwith real data
First, for theISDtest and validation with real data,
scenarios were chosen that represent the conditions of dry, Figura 3- Flow chart of calculation -ISD.
Tabela 2- Degree of susceptibility to drought for the Rio Grande do Norte
state.
Category Variation
High susceptibility ISD> 52.05174 Medium-high susceptibility 44.72983 <ISD£52.05174 Medium susceptibility 31.76541 <ISD£44.72983 Medium-low susceptibility 23.26673 <ISD£31.76541
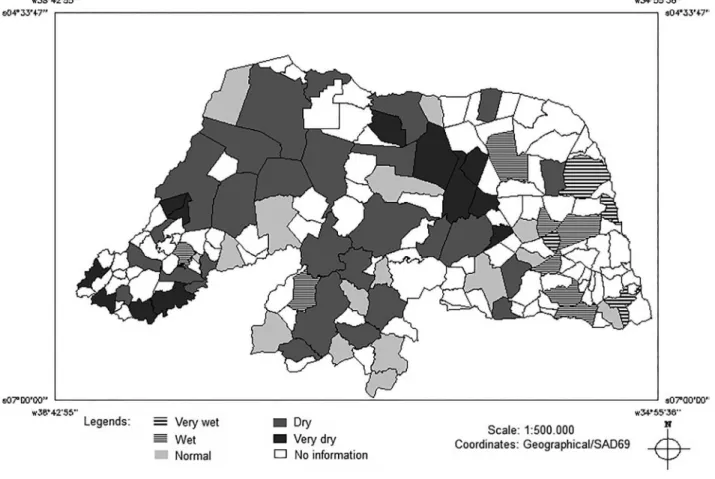
Figura 4- Rain distribution in Rio Grande do Norte - 1998 (extremely dry).
Figura 6- Rain distribution in Rio Grande do Norte - 2005 (dry).
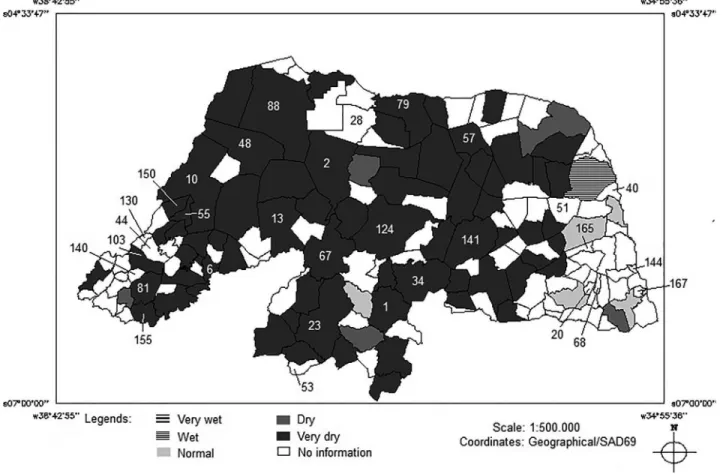
regular and normal years. Preference was also given to more recent years since their information is more thor-oughly available, allowing that all relevant parameters could be used. Thus, the years 1998 and 2005 were chosen for the extremely dry and dry scenario, respectively, the year 2000 was chosen as a primarily normal scenario, and 2006 was chosen for a rainy scenario (Figs. 4, 5, 6 and 7, respectively). The numbers in Fig. 4 were placed to iden-tify the municipalities and assist subsequent analysis.
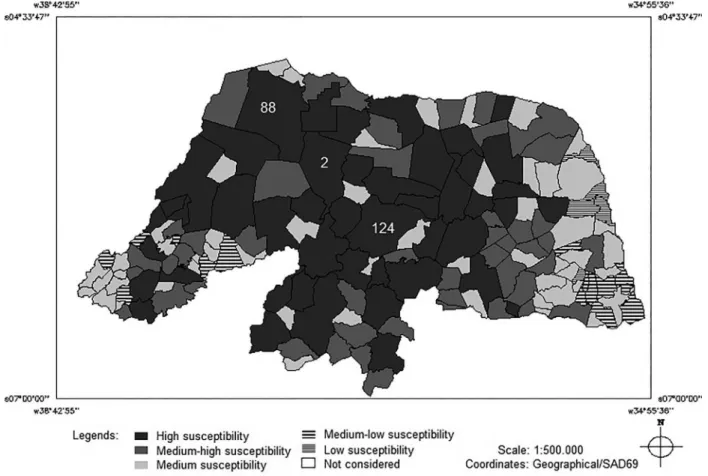
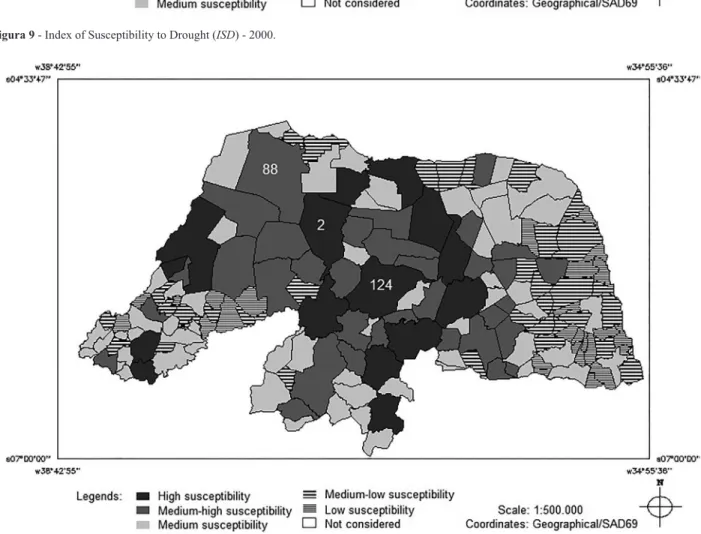
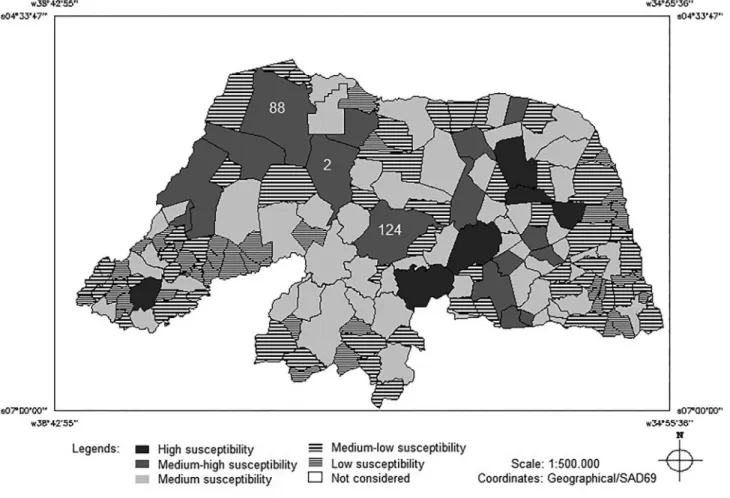
Figures 8, 9, 10 and 11 show the maps with theISD
results for 1998, 2000, 2005 and 2006, respectively. When comparing these results with the results shown in Figs. 4 to 7, it is possible to verify that theISDgenerally followed the
rainfall tendency of each year for every tested scenario. The analysis should be done in the reverse order of the catego-ries of precipitation maps; for example, the “Very Dry” cat-egory would have its equivalent in the catcat-egory of “High Susceptibility” of theISD, and so forth.
However, some differences were observed in the more susceptible regions, such as some regions with mu-nicipalities in the high susceptibility and medium-high sus-ceptibility categories in the regular and rainy years, notably in the central and western central mesoregions of Rio Gran-de do Norte.
3.2. Multivariate data analysis
The results of the PCA (Table 3) indicate that for 1998, 2000 and 2006, five main components explain more than 80% of the variation in the data (values in bold in the table), and for 2005, four main components explain more than 80% of the variation in the data. These results indi-cate a desirable balance for theISD component dimen-sions.
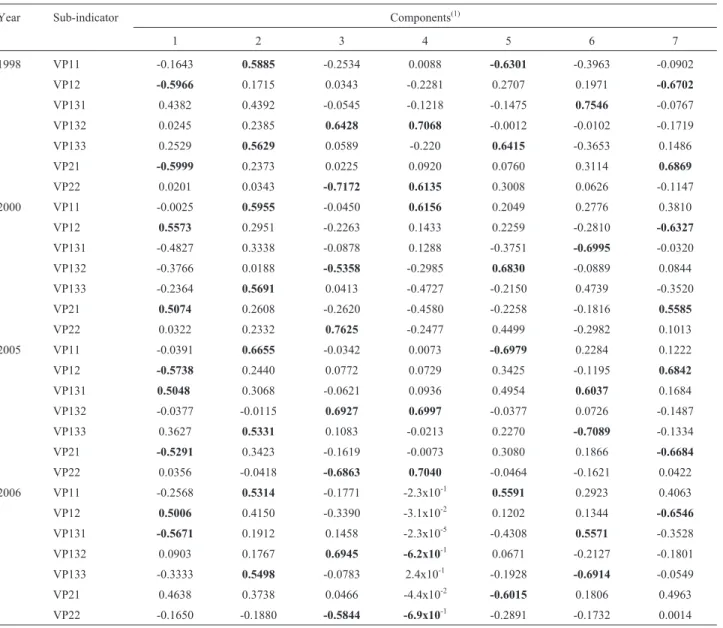
Table 4 shows the charge factors for theISD sub-indicators in all tested years. High charges (> 0.75) and moderate charges (> 0.50) indicate that the sub-indicators are related to the main components. The bold values indi-cate which sub-indicators are significant for each of the components and consequently the total variation of the ex-plained data for each component in Table 3.
The main component is determined by the sub-indi-catorsVP12 andVP21 in almost every tested year, which means that the climate (historical mean rainfall) and the risk of harvest loss explain the highest proportion of data variation. These sub-indicators also appear to influence only one of the main components, which means that they are independent from the otherISDsub-indicator compo-nents.
The second component in every tested year is mainly influenced by the sub-indicatorsVP11andVP133, which suggests that agricultural suitability, land use
Figura 10- Index of Susceptibility to Drought (ISD) - 2005.
Tabela 3- ISD PCA results.
Year Main
components(1) Eigenvalue explained (%)Variance variance (%)Cumulative
1998 1 2.064 29.50 29.50
2 1.478 21.10 50.60
3 1.212 17.30 67.90
4 0.813 11.60 79.60
5 0.687 9.80 89.40
6 0.501 7.17 96.58
7 0.239 3.42 100.0
2000 1 1.806 25.80 25.80
2 1.520 21.70 47.50
3 1.138 16.30 63.80
4 0.870 12.40 76.20
5 0.710 10.20 86.40
6 0.583 8.36 94.72
7 0.369 5.29 100.0
2005 1 2.108 30.10 30.10
2 1.592 22.80 52.90
Year Main
components(1) Eigenvalue explained (%)Variance variance (%)Cumulative
3 1.247 17.80 70.70
4 0.793 11.30 82.10
5 0.537 7.69 89.74
6 0.440 6.30 96.00
7 0.276 3.95 100.0
2006 1 1.752 25.10 25.10
2 1.552 22.2 47.20
3 1.157 16.5 63.70
4 0.863 12.3 76.10
5 0.844 12.1 88.10
6 0.506 7.26 95.41
7 0.321 4.59 100.0
(1)Indices in boldface represent components which are sufficient to explain more than 80% of the variation; their corresponding eigenvalues, ex-plained variance and cumulative variance are also shown in boldface in the other columns.
ditions and the current municipality income are the pa-rameters that explain the second highest proportion of data variation.
The third component in every tested year was con-trolled by the sub-indicatorsVP132andVP22, which means that the economic basis, as represented by the agriculture related to other economic activities from the municipalities, and the human and animal drinking water shortage risk are the parameters that explain the third highest proportion of variation in the data.
Finally, components 4 and 5 display a higher varia-tion of contribuvaria-tion from sub-indicators from year to year, except for the sub-indicatorVP11. It is also interesting to note thatVP131was redundant in the first two tested years.
3.3. Validation of theISDwith simulated data
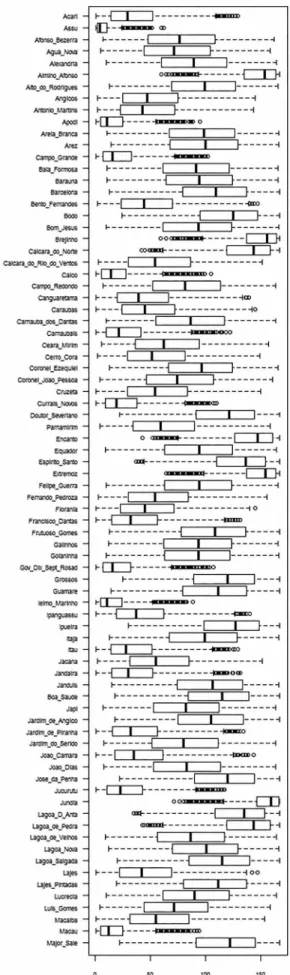
Table 5 lists the statistics of the first simulation, and in Fig. 12, the boxplot of theISDclassification that allows
evaluation of the data symmetry, its dispersion and the exis-tence of outliers is shown. In addition, Figure 13 shows the classification of the stochastic dominance of the municipal-ities from Rio Grande do Norte according to the order num-ber given in Table 5.
The analysis of Table 5 and Fig. 12 indicates that the configuration of three groups of municipalities displayed more criticalISDcategory values in most simulations.
The first group of municipalities consists of Assu (2), Mossoró (88) and Santana dos Matos (124). The number in parenthesis means the class order of municipalities. These Tabela 4- Matrix of factors of charges rotated ofISDsub-indicators.
Year Sub-indicator Components(1)
1 2 3 4 5 6 7
1998 VP11 -0.1643 0.5885 -0.2534 0.0088 -0.6301 -0.3963 -0.0902
VP12 -0.5966 0.1715 0.0343 -0.2281 0.2707 0.1971 -0.6702
VP131 0.4382 0.4392 -0.0545 -0.1218 -0.1475 0.7546 -0.0767
VP132 0.0245 0.2385 0.6428 0.7068 -0.0012 -0.0102 -0.1719
VP133 0.2529 0.5629 0.0589 -0.220 0.6415 -0.3653 0.1486
VP21 -0.5999 0.2373 0.0225 0.0920 0.0760 0.3114 0.6869
VP22 0.0201 0.0343 -0.7172 0.6135 0.3008 0.0626 -0.1147
2000 VP11 -0.0025 0.5955 -0.0450 0.6156 0.2049 0.2776 0.3810
VP12 0.5573 0.2951 -0.2263 0.1433 0.2259 -0.2810 -0.6327
VP131 -0.4827 0.3338 -0.0878 0.1288 -0.3751 -0.6995 -0.0320
VP132 -0.3766 0.0188 -0.5358 -0.2985 0.6830 -0.0889 0.0844
VP133 -0.2364 0.5691 0.0413 -0.4727 -0.2150 0.4739 -0.3520
VP21 0.5074 0.2608 -0.2620 -0.4580 -0.2258 -0.1816 0.5585
VP22 0.0322 0.2332 0.7625 -0.2477 0.4499 -0.2982 0.1013
2005 VP11 -0.0391 0.6655 -0.0342 0.0073 -0.6979 0.2284 0.1222
VP12 -0.5738 0.2440 0.0772 0.0729 0.3425 -0.1195 0.6842
VP131 0.5048 0.3068 -0.0621 0.0936 0.4954 0.6037 0.1684
VP132 -0.0377 -0.0115 0.6927 0.6997 -0.0377 0.0726 -0.1487
VP133 0.3627 0.5331 0.1083 -0.0213 0.2270 -0.7089 -0.1334
VP21 -0.5291 0.3423 -0.1619 -0.0073 0.3080 0.1866 -0.6684
VP22 0.0356 -0.0418 -0.6863 0.7040 -0.0464 -0.1621 0.0422
2006 VP11 -0.2568 0.5314 -0.1771 -2.3x10⁻¹ 0.5591 0.2923 0.4063
VP12 0.5006 0.4150 -0.3390 -3.1x10⁻² 0.1202 0.1344 -0.6546
VP131 -0.5671 0.1912 0.1458 -2.3x10⁻⁵ -0.4308 0.5571 -0.3528
VP132 0.0903 0.1767 0.6945 -6.2x10⁻¹ 0.0671 -0.2127 -0.1801
VP133 -0.3333 0.5498 -0.0783 2.4x10⁻¹ -0.1928 -0.6914 -0.0549
VP21 0.4638 0.3738 0.0466 -4.4x10⁻² -0.6015 0.1806 0.4963
VP22 -0.1650 -0.1880 -0.5844 -6.9x10⁻¹ -0.2891 -0.1732 0.0014
municipalities had positions in 25% of the realized simula-tions, in the first six positions in 50% of simulations and the first fifteen positions in 75% of simulations. In Fig. 13, it is possible to clearly see the stochastic relation of Mossoró municipality (88) to Assu (2) and Santana do Matos (124). These three municipalities were also stochastically domi-nant in all of the simulations. These results confirm what was observed with the actual data (Figs. 8 to 11) in that these municipalities were classified as high susceptibility and medium-high susceptibility in all the tested scenarios.
The second group consists of the municipalities of Apodi (10), Campo Grande (13), Caicó (23), Governador
Dix Sept Rosado (48), Ielmo Marinho (51), Macau (79), São Tomé (141) and Severiano Melo (150). These munici-palities are classified in the first seven positions in 75% of the simulations, in the first sixteen in 50% of simulations and in the first thirty-three in 75% of simulations. This group had three different dominance subgroups (Fig. 13). In the first, the municipalities of Ielmo Marinho (51), Apodi (10) and Macau (79) were dominant. The second sub-group consisted of São Tomé (141), Severiano Melo (150) and Caicó (23) and was dominant compared with Governador Dix Sept Rosado (48) and Campo Grande (13); however, it is not possible to graphically distinguish among Tabela 5- Statistics of mainISDclassification results from the first simulation.
Class order City Mode Min 25th Pctile 50th Pctile 75th Pctile Max Mean Standard
deviation
1 Acari(3) 96 1 14 29 52 129 35.62 26.48
2 Assu(1) 1 1 2 4 11 62 7.69 8.64
6 Almino_Afonso 90 60 135 153 163 167 146.33 20.64
10 Apodi(2) 16 1 5 11 25 95 17.08 16.28
13 Campo_Grande(2) 25 1 7 16 33 102 22.87 19.95
20 Brejinho 165 59 137 155 164 167 147.77 20.02
23 Caico(2) 40 1 6 14 28 105 19.79 18.07
28 Carnaubais(3) 4 1 10 21 41 122 27.96 22.94
34 Currais_Novos(3) 20 1 9 19 38 110 25.59 21.47
40 Extremoz 153 64 137 154 163 167 147.08 20.68
44 Francisco_Dantas(3) 18 1 15 32 56 131 38.11 27.57
48 Gov_Dix_Sept_Rosado(2) 13 1 7 16 32 107 22.07 19.40
51 Ielmo_Marinho(2) 5 1 5 11 24 88 16.57 15.76
53 Ipueira 83 30 98 126 148 167 120.69 32.12
55 Itau(3) 12 1 14 28 51 129 34.91 26.38
57 Jandaira(3) 55 1 15 30 52 131 36.20 26.75
67 Jucurutu(3) 54 1 11 23 43 117 29.35 23.17
68 Jundia 167 71 146 159 166 167 153.12 16.48
79 Macau(2) 5 1 5 12 25 94 17.39 16.51
81 Marcelino_Viera(3) 27 1 12 25 45 121 31.00 24.19
88 Mossoro(1) 9 1 1 4 9 51 6.74 7.76
103 Pau_dos_Ferros(3) 23 1 15 30 54 129 37.04 27.27
124 Santana_do_Matos(1) 5 1 3 6 15 75 10.69 11.32
130 Sao_Francisco_do_Oeste 159 55 131 151 162 167 143.16 23.00
140 Sao_Rafael(3) 18 1 13 28 51 126 34.66 26.21
141 Sao_Tome(2) 2 1 5 13 28 100 18.85 17.62
144 Senador_Georgino_Avelino 137 53 131 151 162 167 143.54 22.62
150 Severiano_Melo(2) 4 1 6 14 28 98 19.69 17.96
155 Tenente_Ananias(3) 17 1 11 23 42 128 29.53 23.34
165 Vera_Cruz 119 50 126 148 161 167 140.54 24.43
167 Vila_Flor 94 48 127 148 160 167 140.81 24.09
these municipalities. Lastly, Governador Dix Sept Rosado was dominant over Campo Grande, although the difference is not very large. These results also confirm the results shown in Figs. 8 to 11.
The third group of municipalities with criticalISD
classifications, but which was not as dominant as the previ-ous two groups, included Currais Novos (34), Carnaubais (28), Jucurutu (67), Tenente Ananias (155), Marcelino Vieira (81), São Rafael (140), Itaú (55), Acari (1), Jandaíra (57), Pau dos Ferros (103) and Francisco Dantas (44).
Of the municipalities in the more critical categories, Jundiá (68) displayed the most significant statistics (Ta-ble 5) and null stochastic dominance compared with the other municipalities of Rio Grande do Norte. Thus, the ob-tained results agree with the actual data (Figs. 8 to 11) as it received a less critical classification in that analysis. Fol-lowing the municipality of Jundiá (68) in reverse order of stochastic dominance are Brejinho (20), Extremoz (40) and Almino Afonso (6), with no distinction in dominance among them, after the municipalities of Senador Georgino Avelino (144) and São Francisco do Oeste (130), which also lack any distinction in dominance between them, and Maxaranguape (83), Vila Flor (167) and Natal (165). All of these municipalities are located in micro-regions next to the coast, except for Almino Afonso and São Francisco do Oeste, which are situated in the mountain region of the Rio Grande do Norte and experience better rainfall (average
rainfall above 800 mm). These geographical and climate factors explain their classification in the less susceptible
ISDcategories.
In the second simulation, the randomization of the
ISD weights was achieved by maintaining the original
sub-indicator values for each tested year. A substantial duction of dispersion of the municipality classifications re-lated to the first simulation was observed. When Fig. 14 is compared to Fig. 12 with respect to the stochastic domi-nance, a predominance of the cities with critical ISD cate-gory assignations in the real data analyses are observed, which validates these results. As shown in Table 6 and Fig. 15 (stochastic graphic for the year 1998), Santana do Matos (124) and Mossoró (88) were dominant with respect to drought risk.
In the second approach of the second simulation, ran-domization of theISD weights was realized, maintaining
the order of weights and the equality of weights for the sub-indicatorsVP11and VP131, VP12andVP132, andVP21 andVP22. In each step of the simulation, four measures were generated, and these were attributed to their respec-tive sub-indicators, which allowed the order and the equal-ity of the originalISDweights to be maintained.
In addition, the simulation verified a substantial re-duction of the municipality classifications related to the first simulation, as translated by the higher break values of the Interquartile Range, and related to the first approach of
these simulations. With respect to stochastic dominance, there was a predominance of the municipalities that ap-peared in the most critical categories ofISDin the real
sim-ulations, which also validates these results (Table 7).
Thus, respecting the order of importance of theISD
sub-indicators, these results are similar to the results from the first simulation and the first approach from the second simulation in terms of the municipalities classified as
be-Figura 14- Boxplot of theISDclassification resulting from the first approach of the second simulation. Year: 1998.
Tabela 6- Summary of the stochastic dominance results from the first approach of the second simulation.
Year Dominants Dominated
1998 Santana do Matos (124) and Mossoró (88) Brejinho (20), Natal (89), Maxaranguape (83) and São Gonçalo do Amarante (131)
2000 Currais Novos (34), Jandaíra (57) and São Tomé (141) Brejinho (20), Almino Afonso (6), Maxaranguape (83) and Extremoz (40)
2005 Matos (124), São Tomé (141), Severiano Melo (150), Apodi (10), and Tenente Ananias (155)
Extremoz (40), Maxaranguape (83), Senador Georgino Avelino (144) and Almino Afonso (6)
2006 São Tomé (141), Marcelino Vieira (81), Ielmo Marinho (51), Bento Fernandes (17), João Câmara (64) and Monte das Gameleiras (87)
longing to the most critical categories and their relation to the cities in the less susceptible categories. Taken together, these results justify the choice of the weights used in the in-dex.
4. Summary and Concluding Remarks
TheISDallows a higher-level vision of the harmful effects of drought because it correlates and externalizes the impacts beyond the physical and climatic aspects common in most of the indexes in the literature.
Because theISDis a composite indicator with an
in-formation structure hierarchy (vector structure), its
compo-nents can be evaluated separately. This feature allows pub-lic managers to potentially direct interventions towards particular factors contributing to the vulnerability of the re-gions under evaluation.
In general, theISDcan be used as a helpful tool for
decision makers and provides the information necessary to direct actions to care and support populations affected by drought.
Since 2011 the ISD is being provided on the
homepage of the EMPARN
(http://189.124.135.176/ISFS.html) giving a different view of the drought in Rio Grande do Norte.
Figura 15- Stochastic dominance of theISDclassification according to the indexing of Table 4, the first approach from the second simulation.
Tabela 7- Summary of the stochastic dominance results from the second approach of the second simulation.
Year Dominants Dominated
1998 Mossoró (88) and Santana do Matos (124) Brejinho (20), Maxaranguape (83), Natal (89), São Gonçalo do Amarante (131), Extremoz (40), Pedro Velho (107), José da Penha (66), Doutor Severiano (35), Jundiá (68)
2000 São Tomé (141), Jandaíra (57), Currais Novos (34) Brejinho (20), Almino Afonso (6), Jundiá (68), Extremoz (40), Maxaranguape (83)
2005 Santana do Matos (124), Severiano Melo (150), São Tomé (141), Apodi (10), Tenente Ananias (155), Macau (79), Assu (2), Currais Novos (28)
Extremoz (40), Jundiá (68), Almino Afonso (6), Viçosa (166), En-canto (37), Maxaranguape (83), Senador Georgino Avelino (144), Vera Cruz (165), Brejinho (20)
2006 Ielmo Marinho (51), São Tomé (141), Marcelino Vieira (81), Bento Fernandes (17), João Câmara (64)
In 2012, theISDwas adapted for use in watersheds in
Southeastern Brazil (in which the rainy season lasts from October to the end of March) and was tested and validated with real data of the Guandu river basin, Espirito Santo State, Brazil (Batista Júnior, 2012). Dry, normal and wet years scenarios were tested and the results showed up in agreement with the Standardized Precipitation Index (SPI) for the Basin.
References
ALVES, J.M.B.; CAMPOS, J.N.B.; SOUZA, E.B.; REPELLI, C. A. Produção agrícola de subsistência no Estado do Ceará com ênfase aos anos de ocorrência de El Niño e La Niña.
Revista Brasileira de Agrometeorologia, v. 6, n. 2,
p. 249-256, 1998.
ANDREOLI, R.V.; KAYANO, M.T. A importância relativa do Atlântico tropical sul e Pacífico leste na variabilidade de precipitação do nordeste do Brasil. Revista Brasileira de
Meteorologia, v. 22, n. 1, p. 63-74, 2007.
ANGELOTTI, F.; SÁ, I.B.; MELO, R.F. Mudanças climáticas e desertificação no semiárido brasileiro. In: ANGELOTTI, F.; SÁ, I.B.; MENEZES, E.A.; PELLEGRINO, G.Q. Mudan-ças climáticas e desertificação no semiárido brasileiro. Pe-trolina, PE: Embrapa Semiárido; Campinas, SP:Embrapa
Informática Agropecuária, 2009. cap. 3. p. 41-49.
ARAÚJO, L.E.; SOUZA, F.A.S.; RIBEIRO, M.A.F.M.; SAN-TOS, A.S.; MEDEIROS, P.C. Análise estatística de chuvas intensas na bacia hidrográfica do Rio Paraíba.Revista
Bra-sileira de Meteorologia, v. 23, n. 2, p. 162-169, 2008.
BATISTA JÚNIOR, W. Identificação e avaliação dos fatores de ocorrência de secas na Bacia do Rio Guandu - Espírito Santo. 2012, 127p.Doutorado em Meteorologia Agrícola.
Universidade Federal de Viçosa. UFV. Brasil.(avail. in
http://www.tede.ufv.
br/tedesimplificado/tde_arquivos/23/TDE-2012-10-25T08 1915Z-4032/ Publico/texto%20completo.pdf)
BRUNINI, O.; DIAS, P.L.S.; GRIMM, A.M.; ASSAD, E.D.; BOKEN, V.K. Agricultural drought phenomenon in Latin America with focus on Brazil. In: BOKEN, V.K.; CRACKNELL, A.P. ; HEATCOTE, R.L. Monitoring and predicting agricultural drought: A global study. New York,
Oxford University Press.pp. 156-168, 2005.
BUTLER, J.; JIA, J.; DYER, J. Simulation techniques for the sen-sitivity analysis of multi-criteria decision models.
Euro-pean Journal of Operation Research, v. 3, p. 531-546,
1997.
BYUN, H.; WILHITE, D.A. Objective quantification of drought severity and duration.Journal of Climate, v. 12, p. 2747-2756, 1999.
CARVALHO, O. A economia política do Nordeste (seca, irriga-ção e desenvolvimento). Rio de Janeiro-RJ:Editora Cam-pus, 1988. 505 p.
DANTAS, J.A. Homens e fatos do Seridó Antigo.Garanhuns:
Gráfica do “O Monitor”, 1961. 168 p.
DUARTE, R.S. A seca de 1958: uma avaliação pelo ETENE.
Fortaleza: Banco do Nordeste; Recife: Fundação
Joa-quim Nabuco, 2002. 200 p. (Série Estudos sobre as Secas
no Nordeste, 1).
ENSSLIN, L.; ENSSLIN, S.R.; NORONHA, S.M.D.; PETRI, S.M. Elaboração de um índice de severidade de seca para o Ceará utilizando-se uma metodologia de apoio à decisão (MCDA). In: XXXII SIMPÓSIO BRASILEIRO DE PES-QUISA OPERACIONAL, 1, 2000, Viçosa, MG. Anais...
Viçosa: Sociedade Brasileira de Pesquisa Operacional,
2000. pp. 1147-1164.
FREITAS, M.A.S. Um sistema de suporte à decisão para o moni-toramento de secas meteorológicas em regiões semiáridas.
Revista Tecnologia,v.Suplem, p. 84-95, 2005.
FUNDAÇÃO CEARENSE DE METEOROLOGIA.Manual do
índice FUNCEME de severidade de seca.Fortaleza, 2000.
278 p.
GONZALEZ, R.A.; ANDREOLI, R.V.; CANDIDO, L.A.; KAYANO, M.T.; SOUZA, R.A.F. A influência do evento El Niño-Oscilação sul e Atlântico equatorial na precipitação sobre as regiões norte e nordeste da América do Sul.Acta
Amazonica (Impresso), v. 43, p. 469-480, 2013.
GUERRA, P.B.A civilização da seca.Fortaleza, DNOCS, 1981.
324 p.
INSTITUTO BRASILEIRO DE GEOGRAFIA E ESTATÍS-TICA.Produto interno bruto dos municípios: 1999-2002.
Contas Nacionais, n.14. Rio de Janeiro, 2005. 188 p.
INSTITUTO BRASILEIRO DE GEOGRAFIA E ESTATÍS-TICA.Sinopse preliminar do censo demográfico – 2000.
Rio de Janeiro, v. 7, 2001. 415 p.
INSTITUTO BRASILEIRO DE GEOGRAFIA E ESTATÍS-TICA.Censo agropecuário – 2006: Resultados
Prelimi-nares.Rio de Janeiro, 2006. 146 p.
INSTITUTO BRASILEIRO DE GEOGRAFIA E ESTATÍS-TICA. Contas regionais do Brasil: 2002-2005. Contas
Regionais do Brasil, n. 21. Rio de Janeiro, 2007. 110 p.
KAYANO, M.T.; ANDREOLI, R.V.; SOUZA, R.A.F. Relations between ENSO and the South Atlantic SST modes and their effects on the South American rainfall.International
Jour-nal of Climatology, v. 33, p. 2008-2023, 2013.
KAYANO, M.T.; CAPISTRANO, V.B. How the Atlantic multi-decadal oscillation (AMO) modifies the ENSO influence on the South American rainfall.International Journal of
Cli-matology, v. 34, p. 162-178, 2014.
MAGALHÃES, A.R.; MARTINS, E.S. Drought and drought pol-icy in Brazil. In: SIVAKUMAR, M.V. K.; MOTHA, R.P.; WILHITE, D.A.; QU, J.J. (Eds.). Towards a Compendium on National Drought Policy. Proceedings of an Expert Meet-ing, july 14-15, 2011, Washington DC, USA: Geneva, Swit-zerland: World Meteorological Organization.AGM-12;
WAOB-2011. p. 57-67.
MARENGO, J.A. Mudanças climáticas globais e seus efeitos sobre a biodiversidade: caracterização do clima atual e defi-nição das alterações climáticas para o território brasileiro ao longo do século XXI. Brasília, DF: Ministério do Meio
Ambiente, 2006, 159 p. il. (Biodiversidade, 26).
MENDONÇA, F.; DANNI-OLIVEIRA, I.M. Climatologia: No-ções básicas e climas do Brasil. São Paulo: Oficina de
Textos, 2007. 206 p.
MOREIRA FILHO, J.C. A seca de 1993: crônica de um Flagelo anunciado. Fortaleza: Banco do Nordeste; Recife:
Fun-dação Joaquim Nabuco, 2002. 138 p. (Série Estudos sobre
MA/DNPEA-SUDENE/DRN. Levantamento exploratório - reco-nhecimento de solos do Estado do Rio Grande do Norte.
Recife: MA/DNPEA-SUDENE/DRN, PE, 1971. 534 p.
NARDO, M.; SAISANA, M.; SALTELLI, A.; TARANTOLA, S.; HOFFMAN, A.; GIOVANNINI, E. Handbook on con-structing composite indicators: Methodology and user guide.OECD Statistics Working Papers, OECD,
Statis-tics Directorate, No 2005/3, 2005. 109 p. Web-site:
http://econpapers.repec.org/RePEc:oec:stdaaa:2005/3-en. NEVES, J.A.Um índice de susceptibilidade ao fenômeno da
seca para o semiárido nordestino. 2010. 399 p. Tese (
Dou-torado em Matemática Computacional) - Universidade
Federal de Pernambuco, Recife, 2010.
NOBRE, P. ; MELO, A.B.C. Variabilidade climática intrasazonal sobre o Nordeste do Brasil em 1998-2000.Revista
Clima-nálise, ano 2, n. 1, 2004.
PAINEL BRASILEIRO DE MUDANÇAS CLIMÁTICAS (PBMC). Contribuição do grupo de trabalho 2 ao primeiro relatório de avaliação nacional do Painel Brasileiro de Mu-danças Climáticas. Sumário executivo do GT2. PBMC, Rio de Janeiro. 2013. 28 p.
PANDEY, C.B.; SINGH, G.B.; SINGH, S.K.; SINGH, R.K. Soil nitrogen and microbial biomass carbon dynamics in native forests and derived agricultural land uses in a humid tropical climate of India. Plant and Soil, v. 33, n. 3, p. 453-467, 2010.
PESSOA, D.M. Caráter e efeito da seca nordestina de 1970.
Fortaleza: Banco do Nordeste; Recife: Fundação
Joa-quim Nabuco,2002. 302 p. (Série Estudos sobre as Secas
no Nordeste; v. 2).
SMAKHTIN, V. U.; HUGHES, D.A. Review, automated estima-tion and analyses of drought indices in South Asia. Working Paper 83. Colombo, Sri Lanka: International Water
Management Institute, 2004.
SILVA, J.S.V. , FORTE, S.H.A.C. Uma contribuição nas deci-sões emergenciais da gestão pública em regiões semiáridas.
Revista Econômica do Nordeste, v. 33, n 4, p. 176, 2002.
XAVIER, T.M.B.S.; XAVIER, A.F.S. Caracterização de perío-dos secos ou excessivamente chuvosos no Estado do Ceará através da técnica dos quantis: 1964-1998. Revista
Bra-sileira de Meteorologia, v. 14, n. 2, p. 63-78, 1999.