BAR, Curitiba, v. 6, n. 2, art. 4, p. 137-152, Apr./June 2009
Differentiation of Municipalities in São Paulo State based
Differentiation of Municipalities in São Paulo State based
Differentiation of Municipalities in São Paulo State based
Differentiation of Municipalities in São Paulo State based
on Constitutional Transferences and Income Tributary
on Constitutional Transferences and Income Tributary
on Constitutional Transferences and Income Tributary
on Constitutional Transferences and Income Tributary
Taxes
Taxes
Taxes
Taxes
Maria Aparecida Gouvêa *
E-mail address: [email protected]
Faculdade de Economia, Administração e Contabilidade da Universidade de São Paulo – FEA/USP São Paulo, SP, Brazil.
Milton Carlos Farina
E-mail address: [email protected]
Faculdade de Economia, Administração e Contabilidade da Universidade de São Paulo – FEA/USP São Paulo, SP, Brazil.
Patrícia Siqueira Varela
E-mail address: [email protected]
Faculdade de Economia, Administração e Contabilidade da Universidade de São Paulo – FEA/USP São Paulo, SP, Brazil.
A
A
A
A
BSTRACTBSTRACTBSTRACTBSTRACTThis paper is part of a large study that combines several groups of municipalities in São Paulo State that are analyzed through multivariate statistical techniques. This study is intended to indicate whether the variables per capita transfer amounts from the Municipalities Participation Fund [MPF], Product and Service Circulation Tax Quota [ICMS] and collected tributary income have different average values among the municipalities of São Paulo State that present different economic and social situations according to the social responsibility index. The evaluation was carried out by multivariate analysis of variance. The results show that the tributary income has the greater difference of average among the groups. It was also found that MPF distribution criteria are applied differently and contribute to the available income fairness, giving support to local governments in the development of public policy.
Key words: municipalities; public revenues; São Paulo state index of social responsibility.
Received 24 June 2008; received in revised form 15 December 2008.
Copyright © 2009 Brazilian Administration Review. All rights reserved, including rights for
translation. Parts of this work may be quoted without prior knowledge on the condition that
the source is identified.
* Corresponding author: Maria Aparecida Gouvêa
IIII
NTRODUCTIONNTRODUCTIONNTRODUCTIONNTRODUCTIONIn federalist systems, there are several reasons for the existence of intergovernmental transferences, such as: dealing with the absence of matching between means of obtaining incomes and with needs of expenses of the local governments, approaching the horizontal iniquities, supply compensations to local governments by benefits generated for the population outside of its jurisdiction, influence the subnational policies of taxation and expense, among others. In order to reach its various objectives, a system of transference should be appropriately designed because otherwise there could be some undesirable results in terms of social welfare. The criteria for transferences are a delicate matter and, in Brazil, they have been the focus of discussion among a number of authors, such as Campello (2003), Gasparini and Melo (2003), Lopes and Arvate (2006) and Arvate and Mattos (2007).
One of the main questions concerning the reform of the State in the last few decades has been the radical change of the rule relative to the social division of work, i.e., in the responsibility assumed by the municipalities and by the private sector to produce goods and services that were once considered an occupation of the national State (Oszlak, 1998, p. 53).
In the case of the municipalities, the decentralization movement has been a strategy used both by the process of State reform as well as by the re-democratization process in the country, favoring the transference of power, resources and assignments to the local governments.
The municipalities, with the Federal Constitution of 1988, gained greater political and administrative autonomy and assumed new assignments in the social area and in the promotion of the economic development within their areas and also assumed the challenge of establishing new forms of relationship with civil society with the objective of strengthening democracy.
Local governments had been the main beneficiaries of the fiscal decentralization that was initiated in the second half of the seventies and strengthened by the Constitution (Constituição da República Federativa do Brasil, 1988), over all with the magnifying of the federal and state transfers to these federal agencies. The federal, Municipalities Participation Fund and the state [MPF], Product and Service Circulation Tax Quota [ICMS] were the main transfers made to the municipalities.
For a great many of them, these two constitutional transfers represent the most significant source of funding of their expenditures. Bovo (2001, p. 114) affirms that for more than 3,000 of approximately 5,550 Brazilian municipalities, 90 percent of their resources come from the constitutional transfers, especially from the MPF.
It should also be pointed out that the main municipal taxes – Service Tax [ISS] and Tax on the Urban Land Property [IPTU] – have a better potential in the medium size and large municipalities. Moreover, in the transfer criteria of the Product and Service Circulation Tax Quota to the municipalities (25 percent of the total collected by the state), the intensity of the economic production exerts great influence, i.e., the transferred amounts are related to the capacity for generating wealth in the municipal scope. “the preponderant logic of this tax is to reward the municipalities that are more successful economically” (Abrucio & Couto, 1996, p. 44).
The analysis of the reality of the local governments of the state of São Paulo, as seen in the São Paulo Index of Social Responsibility [IPRS], indicates the existence of groups of municipalities with different combinations of wealth levels and longevity and educational indicators (Fundação Sistema Estadual de Análise de Dados [SEADE], 2005a, p. 10). One of the hypotheses raised is that the MPF distribution influences the classification of the different groups of municipalities when serving as an income redistribution mechanism.
Taking as a basic assumption that the largest municipalities possess greater economic production and, consequently, collect more tributary income and receive larger transfers from the ICMS, the MPF transfer must favor the small municipalities. Considering this, the following guiding question was set for this study: Do the variables (I) per capita tributary income, (II) per capita ICMS participation
quota and (III) per capita MPF differentiate São Paulo’s municipalities groups established by the IPRS?
The objective of this work is to verify whether some groups of São Paulo’s municipalities, established by the IPRS, possess different averages of MPF transfers, ICMS participation quotas and collected tributary income in per capita terms. Moreover, the verification of the existing relation between the set of these variables and the classification of municipalities according to the IPRS is studied.
A contribution is expected to be made to the debate on the adequacy of the distribution criteria of the Municipalities Participation Fund [MPF] and for the deepening of the knowledge of the reality of São Paulo’s municipalities. In particular, the intention is to indicate the most relevant public income variables to sort the five groups of municipalities and to indicate whether the per capita MPF transfer makes the conditions of social investments among them more equitable since the groups of municipalities studied possess different levels of wealth and, consequently, different fiscal capacities and participation in the ICMS participation quota in per capita terms.
M
M
M
M
UNICIPALITIES UNICIPALITIES UNICIPALITIES UNICIPALITIESP
P
P
P
ARTICIPATION ARTICIPATION ARTICIPATION ARTICIPATIONF
F
F
F
UND UND UND UND[MPF]
[MPF]
[MPF]
[MPF]
The central characteristic of the Brazilian experience regarding the decentralization process was incongruence, with consequences such as the increase of inter and intra-regional socio-economic inequalities and non adequacy of the distribution of assignments to the three federative spheres by the Federal Constitution of 1988, implying the coexistence of omissions or functional overlapping (Affonso, 1996, p. 9). It was like that because the decentralization process that began in the late seventies was commanded by the states and, mainly, by the municipalities, in the re-democratization context, and not by the federal government (Affonso, 1996, p. 5).
Notwithstanding the non definition by the Constitution regarding the split of competences, states and municipalities ended up assuming new responsibilities due to the biggest volume of available resources introduced by the fiscal decentralization, by the reduction of federal expenditures and by the pressures of civil society (Affonso, 1996, p. 9).
As in Abrucio and Couto (1996, p. 40), the municipalities started to face a double challenge: to assure minimum social welfare conditions for its populations (Welfare Function) and to promote economic development based on local actions in partnership with civil society (Development Function).
The fiscal decentralization process that began in the seventies and which gained volition in the early eighties was carefully examined by the Federal Constitution of 1988. Its main consequences were the increase of the sub-national units’ power to tax in its own jurisdiction and the increase of available resources not entailed to the municipalities as a result of the constitutional transfers, including the Municipalities Participation Fund [MPF] and the participation in the income of the Product and Service Circulation Tax Quota [ICMS] (Abrucio & Couto, 1996, p. 42).
Although the local governments have increased their fiscal capacity, this process did not occur homogeneously among the diverse Brazilian municipalities. Bovo (2001, p. 114) emphasizes the fact that the sources of taxation for the main municipalities are based on the Service Tax [ISS], the Tax on the Urban Land Property [IPTU] and in the Tax on the Real State Property Transference [ITBI], taxes that present a greater potential of collection in the medium and large municipalities, since in the small ones, with a largely agricultural base, the urban property is of little significance and the services sector is not expressive.
“An aggravating to this fact is the insufficiency of existing reallocation mechanisms, especially at the municipal level” (Abrucio & Couto, 1996, p. 43). The resources transferred by the Exchequer and by the states to the municipalities should serve as mechanisms to provide equitable conditions to Brazilian municipalities to face the new social assignments. However, this does not always happen, as in the case of the ICMS participation quota that rewards the more economically successful municipalities (Abrucio & Couto, 1996, p. 44).
In this case, the reallocating effectiveness or inefficacy of the Municipalities Participation Fund [MPF] has a heavy influence on the municipal performance in the social area. The MPF is a constitutional transfer made by the Exchequer to the municipalities, with this fund being composed of 22.5% of Income Tax [IR] and Tax on Industrialized Products [IPI] collection.
The transfer of the resources that compose the MPF is divided into three parts:
1. 10% of the total MPF is distributed to the state capitals in accordance with coefficients that take into consideration the size of the population and the inverse of the per capita income of the respective state.
2. 86.4% of the total MPF is distributed to the municipalities of the countryside, in accordance with coefficients defined by population range as in Decree n. 1,881/81 (Decreto-Lei nº 1,881, 1981).
3. 3.6 percent of the total MPF is earmarked for the Reserve of the Municipalities Participation Fund that is distributed among the countryside municipalities with a coefficient of 4.0 up to 1998 and 3.8 since the fiscal year of 1999. The resources that belong to the reserve are a complement to the amount received as in the previous item and the distribution occurs in accordance with the coefficients that take into consideration the size of the population and the inverse of the per capita
income of the respective state.
In the three cases, the participation of each municipality is given by the ratio of its coefficient by the sum of the coefficients of the Brazilian municipalities that integrate each specific group.
According to paragraph 4 of Article 91 of Decree n. 1,881/81 (Decreto-Lei nº 1,881, 1981), the limits of the ranges of number of inhabitants will be readjusted whenever, by means of a general demographic census, the total population of the country is officially known, establishing the percentage increase on the basis of the immediately previous census.
population as per the IBGE’s estimates. The additional profits that result from this decision have gradually been eliminated since 1999, with complete elimination forecast for 2008.
Abrucio and Couto (1996, p. 43) evaluate the MPF distribution criteria as being of little efficiency. Therefore, they consider the income criterion only for the large municipalities and state capitals.
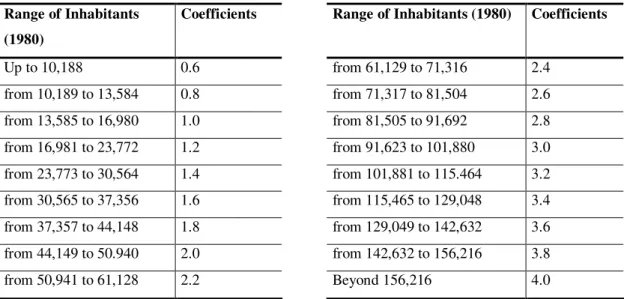
In the other municipalities, the main criterion for the distribution of the resources that compose the MPF is the size of the population. Indeed, the coefficients of municipality participations are established by population ranges and not by a specific number, as seen in Table 1.
Table 1: MPF Individual Participation Coefficients
Range of Inhabitants (1980)
Coefficients Range of Inhabitants (1980) Coefficients
Up to 10,188 0.6 from 61,129 to 71,316 2.4 from 10,189 to 13,584 0.8 from 71,317 to 81,504 2.6 from 13,585 to 16,980 1.0 from 81,505 to 91,692 2.8 from 16,981 to 23,772 1.2 from 91,623 to 101,880 3.0 from 23,773 to 30,564 1.4 from 101,881 to 115.464 3.2 from 30,565 to 37,356 1.6 from 115,465 to 129,048 3.4 from 37,357 to 44,148 1.8 from 129,049 to 142,632 3.6 from 44,149 to 50.940 2.0 from 142,632 to 156,216 3.8 from 50,941 to 61,128 2.2 Beyond 156,216 4.0
Source: adapted from Decree n. 1,881, Article 1 (Decreto-Lei nº 1,881, 1981)
The amplitude of the ranges and the fact that the coefficients do not increase in the same ratio as the increase of the population ranges leads to great differences among the municipalities, if the per capita
MPF is considered, favoring the smaller municipalities.
For example, according to data of the National Treasure System (Sistema do Tesouro Nacional [STN], 2007), 86 of the 516 São Paulo municipalities received R$ 2,176,261.73 of MPF transfer in 2004. Considering these 86 municipalities, the smallest municipality of this group (Nova Castilho) had a population of 1,020 inhabitants; therefore, it received an annual per capita MPF of R$ 2,133.59, while the biggest city of the group (Valentim Gentil), with a population of 9,990 inhabitants received an annual per capita MPF of R$ 217.84. The difference is due to the attribution criterion of a same MPF amount to municipalities with very different population sizes, but pertaining to the same population range with great amplitude of number of inhabitants. These inequalities happen for all the amounts of MPF income referring to diverse ranges.
Excluding the municipality of São Paulo since it is the capital, Osasco received the highest MPF total amount, R$ 28,212,304.42; on the other hand, considering the per capita distribution, this municipality received one of the lowest amounts, R$ 40.54; this is because the MPF amount does not increase in the same ratio as the size of the population.
S
S
S
S
ÃO ÃO ÃO ÃOP
P
P
P
AULO AULO AULO AULOIIII
NDEX OF NDEX OF NDEX OF NDEX OFS
S
S
S
OCIAL OCIAL OCIAL OCIALR
R
R
R
ESPONSIBILITYESPONSIBILITYESPONSIBILITYESPONSIBILITYIn the public sector, there have been several initiatives and experiences of the use of social indicators. The best known of these is that of the United Nations [UN], which in the nineties created the Index of Human Development [IHD], which was innovative when introducing, at its conception, the longevity and education variables, in addition to income, to compare the degree of development for countries.
Other experiences resulted from the IHD, as it is the case of the São Paulo Index of Social Responsibility [IPRS]. This index was developed by the Fundação SEADE (SEADE Foundation), an agency of the São Paulo government, in reply to the request of the leaders and council members of the São Paulo Forum – Century XXI for the development of indexes that enabled them to continuously monitor the progress or lack thereof of the development São Paulo’s municipalities in the direction desired by society and widely discussed within the Forum.
One of the purposes of the IPRS is to classify the municipalities of São Paulo State according to the quality of life of its inhabitants. In order to achieve this, the three dimensions enclosed by the IHD were considered (income, longevity and education), but using other variables more suitable to municipal reality. The initial idea was to use indicators that not only permitted the evaluation of the results and efforts undertaken by the public authorities in favor of local development, but also allowed the measurement of the degree of participation and control of civil society in such actions.
For the attainment of this index, the municipalities of the State of São Paulo were classified into groups with similar characteristics of wealth, longevity and education through cluster analysis, groups with the following denominations: (1) pole municipalities, (2) economically dynamic, but of low social development, (3) healthy municipalities, but of low economic development, (4) of low economic development and in social transition and (5) of low economic and social development.
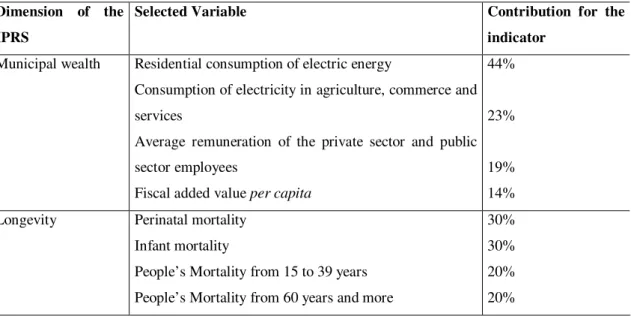
The variables considered in each one of the dimensions of the IPRS and the corresponding weighting structure are synthesized in Table 2.
Table 2: Synthesis of the Selected Variables and Weighting Structure Adopted, according to the Dimensions of the IPRS
Dimension of the IPRS
Selected Variable Contribution for the indicator
Municipal wealth Residential consumption of electric energy
Consumption of electricity in agriculture, commerce and services
Average remuneration of the private sector and public sector employees
Fiscal added value per capita
44%
23%
19% 14% Longevity Perinatal mortality
Infant mortality
People’s Mortality from 15 to 39 years People’s Mortality from 60 years and more
(conclusion)
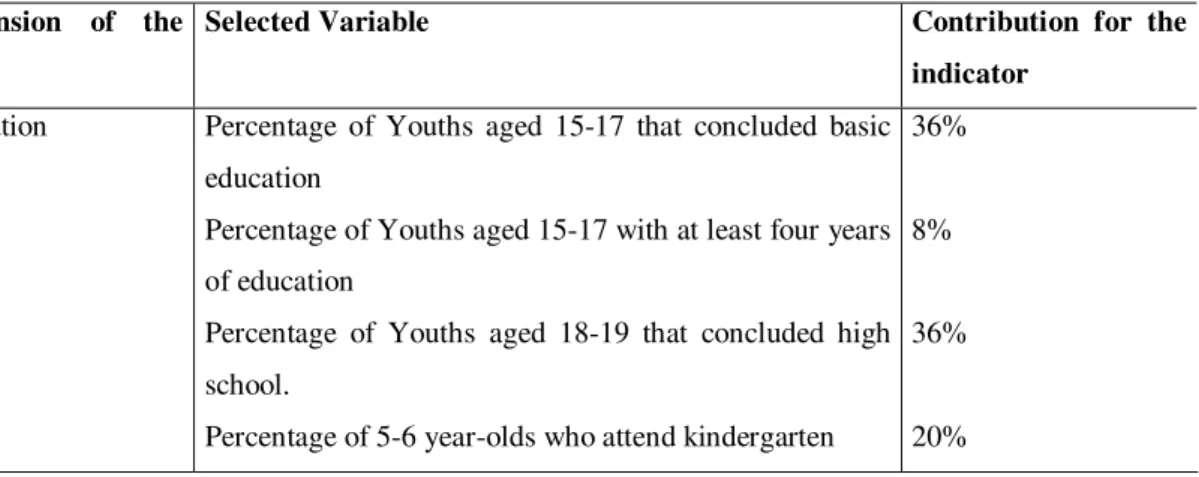
Table 2: Synthesis of the Selected Variables and Weighting Structure Adopted, according to the Dimensions of the IPRS
Dimension of the IPRS
Selected Variable Contribution for the indicator
Education Percentage of Youths aged 15-17 that concluded basic education
Percentage of Youths aged 15-17 with at least four years of education
Percentage of Youths aged 18-19 that concluded high school.
Percentage of 5-6 year-olds who attend kindergarten
36%
8%
36%
20% Source: SEADE (2005b, p. 5).
The synthetic indicator of each dimension is the result of the combination of the variables, being that each one’s weight in the related combination was obtained through Factor Analysis.
The SEADE Foundation synthesized the indicators of municipal wealth, longevity and education in categorical scales, which express the general standard of the groups created. The synthesis of the
criteria adopted for the formation of the groups of municipalities by the IPRS is described in Table 3.
Table 3: Criteria of Group Formation by the IPRS
Groups Criteria of Group Formation by the IPRS Description
Group 1 High wealth, high longevity and average education High wealth, high longevity and high education High wealth and average longevity and education High wealth, average longevity and high education
Municipalities with a high level of wealth and good levels of social indicators
Group 2 High wealth, low longevity and low education High wealth, low longevity and average education High wealth, low longevity and high education High wealth, average longevity and low education High wealth, high longevity and low education
Municipalities that, even with high levels of wealth, are not capable of reaching good social indicators
Group 3 Low wealth, high longevity and average education Low wealth, high longevity and high education Low wealth and average longevity and education Low wealth, average longevity and high education
Municipalities with low level of wealth, but with good social indicators
Group 4 Low wealth, low longevity and average education Low wealth, low longevity and high education Low wealth, average longevity and low education Low wealth, high longevity and low education
(conclusion)
Table 3: Criteria of Group Formation by the IPRS
Groups Criteria of Group Formation by the IPRS Description
Group 5 Low wealth, low longevity and low education
The most disfavored municipalities in wealth and in social indicators
Source: SEADE (2005b, p. 10).
Through Table 3, it is possible to notice the different combinations among levels of municipal wealth and social indicators. Therefore, it provides answers as to whether the governmental transfers, especially the MPF, are helping to make investment conditions more equitable for these groups of municipalities.
M
M
M
M
ETHODOLOGICAL ETHODOLOGICAL ETHODOLOGICAL ETHODOLOGICALA
A
A
A
SPECTSSPECTSSPECTSSPECTSThe methodological procedures are presented in the following sections.
Popu
Popu
Popu
Population
lation
lation
lation
The population studied corresponds to those from the capital and from the countryside municipalities of the state of São Paulo belonging to the five groups that are of analysis interest. The specificity of the five groups of the IPRS demonstrate the possibility of a differentiated distribution of the MPF, the ICMS participation quota and tributary income. For this reason, the analysis of these groups is of great importance and interest.
Data Collection
Data Collection
Data Collection
Data Collection
Data were collected for the four variables: MPF, ICMS participation quota, Tributary income and IPRS Groups of Municipalities.
The IPRS data were collected from the SEADE (2005b) and refers to 2002 and to all the municipalities of the state of São Paulo, i.e., to all 648 São Paulo municipalities. The data of the three sources of public income, collected in the fiscal year of 2004 were retrieved from the website of the STN (2007) and are relative to 518 São Paulo municipalities.
Previous Treatment of Data
Previous Treatment of Data
Previous Treatment of Data
Previous Treatment of Data
With the intention of checking the significance of the difference of the per capita values of this public income in the five focused groups, as well as identifying the variable with greater discrimination ability among these groups, the statistical technique of the multivariate analysis of variance was applied.
In this context, the independent variable is named IPRS, which identifies the set of municipalities of groups 1, 2, 3, 4 and 5 of IPRS, and the dependent variables are the per capita MPF, the per capita
ICMS participation quota and the per capita tributary income values.
items: (1) absence of outliers (atypical observations), (2) normality of the dependent variables, (3) absence of multicollinearity among the dependent variables and (4) equality in the dispersion matrices.
Before verifying all of these conditions, the analysis of the missing data was conducted. The following sections present the analysis of missing data and the verification of these premises.
Treatment of the Missing Data
In relation to the missing data, the researcher must concentrate on the causes that generated them (Hair, Black, Babin, Anderson, & Tatham, 2006, p. 49). In the case of the STN, information for all of the 648 municipalities of São Paulo simply did not exist. There was information on only 518 of them. According to Hair et al. (2006, p. 59) the simplest and direct treatment to deal with missing data is to include in the study only the observations with complete data, and this was the decision taken for this study.
Treatment of the Outliers (Atypical Observations)
Among the 518 municipalities, two of them indicated errors in the data entry, with highly discordant values of total MPF (Bento de Abreu and Ouroeste). As a result, the treatment of the atypical observations was given to a total of 516 municipalities.
The method for detection of outliers used was the Mahalanobis measure, which is recommended in multivariate contexts (Hair et al., 2006, p. 77). In the simultaneous treatment of the three per capita
public income variables, a mean center of all observations was calculated. Then the distance between each municipality and the mean center was obtained. Each distance was compared with a critical t -distribution value. The municipalities Paulínia, Águas de São Pedro and São Paulo were considered outliers because their distances exceeded this critical value.
After the analysis of the missing data and outliers, the total sample resulted in 513 municipalities: 61 in group 1, 70 in group 2, 154 in group 3, 153 in group 4 and 75 in group 5.
The three public income variables were standardized using the Z-scores method.
Normal Distribution
Adherence tests to the normal Kolmogorov-Smirnov curve were done for the dependent variables
per capita that had been transformed through the Z-scores standardization method and natural logarithms. The transformation through natural logarithms was necessary in order to find a better fitting to normal distribution.
The variables per capita MPF, the per capita ICMS participation quota and the per capita tributary income reached the following significant levels: .051, .324 and .099, which confirm the adherence to normal distribution. The notations MPF, ICMS and income used in the following sections refer to these variables per capita, standardized and with natural logarithm transformation.
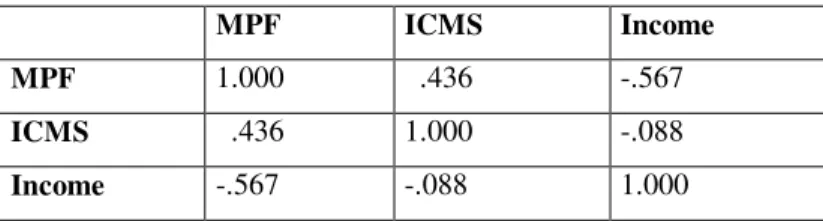
Multicollinearity
Table 4: Correlations
MPF ICMS Income MPF 1.000 .436 -.567 ICMS .436 1.000 -.088 Income -.567 -.088 1.000
The correlations that can be considered high, in absolute value, are: ICMS with MPF (.436) and Income with MPF (-.567). The correlation between ICMSand income can be considered low (-.088). The results show that the resources coming from the Exchequer (MPF) and from the State (ICMS) present an expressive and positive correlation, i.e., municipalities with higher resources from the Exchequer also have higher resources from the State and vice versa. The MPF resource correlates negatively with the Income, i.e., the greater the municipality’s own resources, the fewer the number of resources that come from the Exchequer.
Concerning to the assumption that the ICMS rewards the more economically successful municipalities, the per capita data indicate the opposite; such variable and the income correlate negatively, although the value is considered low.
The use of multivariate analysis of variance (MANOVA) is based on the fact that the dependent variables are supposed to be correlated. Therefore, a certain degree of multicollinearity is desired. The tests of Bartlett and Roy-Bargman Stepdown will be used to evaluate the intensity of the multicollinearity.
According to Bartlett´s test, the chi-square value is 276.585, with a significant level equal to .000, indicating the rejection of the hypothesis that the correlation matrix in Table 4 is equal to the identity matrix. This result is adequate for the use of MANOVA. Table 5 presents the results of the Roy-Bargman Stepdown test.
Table 5: Roy-Bargman Stepdown Test
Variables
Mean square between groups
Mean square
within groups F stepdown
D. F. between
D. F. within
F stepdown significance
MPF 38.564 .659 58.494 4 508 .000
ICMS 19.949 .610 32.723 4 507 .000 Income 12.785 .529 24.185 4 506 .000
Table 5 shows that for each variable the hypothesis of equality of means along the five groups is rejected when the other variables are included. Thus, each one of the dependent variables has incremental discriminatory power and contributes toward distinguishing the five groups. Therefore, the intercorrelation among the three variables does not characterize a high degree of multicollinearity. The result of this test is favorable to the use of MANOVA.
Test of Equality of Variances
makes it a very liberal test and the analysis can continue when the hypothesis is confirmed for lower significant levels, under 2.4%, in this case (Hair et al., 2006, p. 409).
To test the homogeneity of variance assumption for each variable in the five groups, Levene’s statistics were used. It was found that the variances can be considered equal, for a significance level of 0.05, with the exception of the variances of groups in the income variable. It should be noted that if a more conservative significance level, under 3.7%, is used, even for the income variable, the variances could be considered equal in the five groups.
Thus, in a general way, all the premises have been confirmed for the use of MANOVA.
A
A
A
A
NALYSIS OF NALYSIS OF NALYSIS OF NALYSIS OFR
R
R
R
ESULTS ESULTS ESULTS ESULTSThe central question inherent to MANOVA can be synthesized as follows: do the variables MPF, ICMS and Income discriminate groups 1, 2, 3, 4 and 5? In other words, are the means of each one of these variables different in these five groups?
In this section, some univariate statistics will be presented first, followed later by the statistics in the multivariate context.
Descrip
Descrip
Descrip
Descriptive Statistics
tive Statistics
tive Statistics
tive Statistics
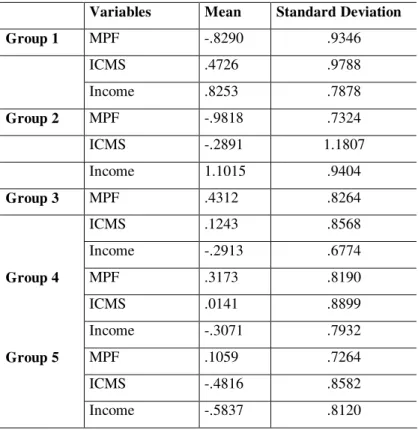
Table 6 shows some descriptive statistics in each group.
Table 6: Descriptive Statistics
Variables Mean Standard Deviation Group 1 MPF -.8290 .9346
ICMS .4726 .9788
Income .8253 .7878
Group 2 MPF -.9818 .7324
ICMS -.2891 1.1807 Income 1.1015 .9404
Group 3 MPF .4312 .8264
ICMS .1243 .8568
Income -.2913 .6774
Group 4 MPF .3173 .8190
ICMS .0141 .8899
Income -.3071 .7932
Group 5 MPF .1059 .7264
ICMS -.4816 .8582
Income -.5837 .8120
The negative mean MPF indicates less transfer of this income to the municipalities that are considered richer. The wealth is proven by the positive means of income. The opposing reasoning occurs with the analysis of the means of groups 3, 4 and 5 which are classified as being of low wealth, i.e., have positive MPF means and negative income means.
Although the variable means demonstrate differences among groups 1, 2, 3, 4 and 5, it can be seen that the standard deviations have very high values, demonstrating great heterogeneity within each group. For a correct comparison of the group’s means for each variable, the test of means equality was conducted. Section Equality of Means Multivariate Test will exhibit the results of the means equality test.
Multivariate
Multivariate
Multivariate
Multivariate Analysis
Analysis
Analysis
Analysis
Mapping of Variables
Two ranges have been defined for each variable. The multiple correspondence analysis was processed in order to have an idea of the relationship among the variables. The range transformation of the variables turned them into a non metric scale, which is a characteristic of the variables in multiple correspondence analysis. Figure 1 provides the relationship among the ranges of the variables and the five groups.
Figure 1: IPRS and Public Incomes
mfp1
mfp2 icms1
icms2
income1
income2
iprs1 iprs2
iprs3 iprs4 iprs5
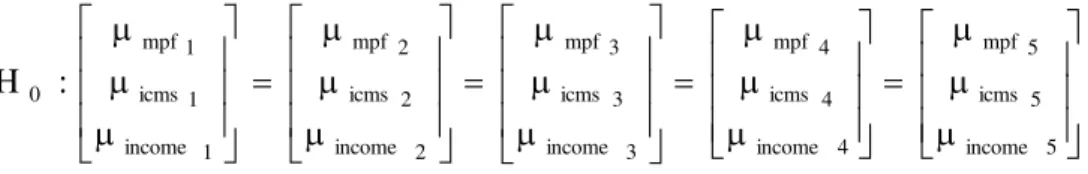
Equality of Means Multivariate Test
The statistical hypothesis (H0) corresponds to the equality of the means vector of the three variables throughout the five groups.
: H
5 income
5 icms
5 mpf
4 income
4 icms
4 mpf
3 income
3 icms
3 mpf
2 income
2 icms
2 mpf
1 income
1 icms
1 mpf
0
versus H1: at least one group has different mean.
Table 7 presents the results of the multivariate test of means equality.
Table 7: Multivariate Test
Effect Value F Sig.
Eta
squared Power
Pillai´s Trace .600 31.724 .000 .200 1.00 Wilks´s Lambda .457 38.455 .000 .230 1.00 Hotelling´s Trace 1.068 44.931 .000 .263 1.00 Roy´s Largest Root .947 120.320 .000 .486 1.00
Table 7 contains the four multivariate tests that are more used in MANOVA. The results of each one of them indicate the rejection of H0, i.e., the set of public incomes have a highly significant difference among the five groups of municipalities.
The statistical power obtained in these tests is equal to 1.00. Therefore, the group sizes and the effect sizes of these groups on the dependent variables (the public incomes) are sufficient to ensure that the significant differences would be detected if they existed beyond the differences due to a sampling error.
Although it was shown that the set of public income outcomes differs across the five groups, it is also necessary to examine each public income outcome separately for differences across the five groups. Table 8 contains the univariate tests for each individual public income outcome. According to Table 8, the means can be considered different across the groups, using significance level of .05.
Table 8: Mean Equality Test
F Sig.
MPF 58.494 .000
ICMS 11.294 .000
Income 72.817 .000
Table 9 presents the relationship among the groups for each dependent variable, according to post hoc Scheffé’s multiple comparisons tests. These tests were carried out due to the rejection of the hypothesis of equality of the means of the variables across the five groups.
Table 9: Scheffé´s Test
Equal Groups MPF 1 and 2; 3, 4 and 5 ICMS 1 and 3; 2 and 5 Income 1 and 2; 3, 4 and 5
C
C
C
C
ONCLUSIONSONCLUSIONSONCLUSIONSONCLUSIONSThe aim of this article was to show whether the groups of São Paulo’s municipalities, established by the São Paulo Index of Social Responsibility, are distinguished by the per capita transfers amounts of the MPF, ICMS participation quota and Tributary Income collected.
The interest in comparing municipal income was raised after the verification of different economic and social levels across the groups, the objective of the study being to question whether the governmental transfers, over all the MPF, would be contributing to make the investment conditions more equitable across the groups.
The volume of available resources locally for application in the social and economic areas depends on the fiscal capacity of each municipality and on the existing mechanisms for redistribution of resources. Given the biggest capacity of the larger municipalities to collect their own incomes due to the characteristics of the municipal taxes, one expects the participation criteria of municipalities in the Exchequer’s and the state’s income to be efficient when it comes to redistribution. However, in accordance with the literature review, this is not always the case.
The average of three public incomes analyzed, per capita, is different among the groups. The groups 1 and 2 present higher per capita Tributary Income and lower value of per capita MPF when compared to the other groups.
The analysis of the relationship among the variables indicates that the higher the fiscal capacity of the municipalities, the lower their per capita share of the MPF will be and their share of Tributary Income per capita will be higher.
The MANOVA shows that the variable per capita Tributary Income is the one that best discriminates the groups of municipalities.
It can also be said that the MPF distribution criteria may be helping to make the available income equitable to certain municipal governments to face the challenge to assure minimum social welfare conditions and to promote economic development locally.
The big cities receive fewer resources through transferences because the gap between capacity of collection and need of expenses is smaller.
However, neither can it be affirmed that this fact repeats itself among other groups of Brazilian municipalities. Thus, a repetition of the analysis in other selections of municipalities groups is recommended.
Another suggestion is related to the classification of the municipalities made by the SEADE Foundation. Perhaps it would be interesting to include as a criterion for grouping the municipalities not only their capacity for generating wealth but also the availability of resources to carry out their public policies.
R
R
R
R
EFERENCES EFERENCES EFERENCES EFERENCESAbrucio, F. L., & Couto, C. G. (1996). A redefinição do papel do estado no âmbito local. São Paulo em Perspectiva,10(3), 40-47.
Affonso, R. (1996). Os municípios e os desafios da federação no Brasil. São Paulo em Perspectiva, 10(3), 3-10.
Arvate, P., & Mattos, E. (2007). Efficiency in tax collection: evidence from Brazilian municipalities.
Recuperado em 26 agosto, 2008, de http://eespfgvspbr.tempsite.ws/_upload/publicacao/110.pdf
Bovo, J. M. (2001). Gastos sociais dos municípios e desequilíbrio financeiro. Revista de Administração Pública, 35(1), 93-117.
Campello, C. A. G. B. (2003). Eficiência municipal: um estudo no Estado de São Paulo. Tese de doutorado. Universidade de São Paulo, São Paulo, SP, Brasil.
Constituição da República Federativa do Brasil de 1988. (2001). [Coleção Saraiva de Legislação]. (21a ed.). São Paulo: Saraiva.
Decreto-Lei n. 1.881, de 27 de agosto de 1981. (1981). Altera a Lei n. 5.172, de 25 de outubro de 1966, cria a Reserva do Fundo de Participação dos Municípios - FPM e dá outras providências.
Brasília, DF. Recuperado em 20 de janeiro, 2005, de
http://www.planalto.gov.br/ccivil_03/decreto-lei/1965-1988/Del1881.htm
Fundação Sistema Estadual de Análise de Dados. (2005a). Índice paulista de responsabilidade social:
metodologia. Recuperado em 20 janeiro, 2005, de http://www.seade.gov.br/produtos/iprs/pdf/metodologia.pdf
Fundação Sistema Estadual de Análise de Dados. (2005b). Índice paulista de responsabilidade social:
consulta. Recuperado em 20 janeiro, 2005, de
http://www.al.sp.gov.br/web/forum/iprs03/index_iprs.htm
Gasparini, C. E., & Melo, C. S. L. (2003). Eqüidade e eficiência municipal: uma avaliação do fundo de participação dos municípios (FPM). Brasília, DF: Editora Universidade de Brasília. [1º lugar no VIII Prêmio Tesouro Nacional - Tópicos Especiais de Finanças Públicas].
Hair, J. F., Jr., Black, W. C., Babin, B. J., Anderson, R. E., & Tatham, R. L (2006). Multivariate data analysis(6a ed.). New Jersey: Prentice Hall.
Lopes, M. F. M., & Arvate, P. R. (2006, novembro). Vertical fiscalimbalance e eficiência técnica do gasto público municipal: um estudo para os municípios do estado de São Paulo. Encontro de Administração Pública e Governança, São Paulo, SP, Brasil, 2.
Oszlak, O. (1998). Estado e sociedade: novas regras de jogo? In J. R. Felicíssimo, M. I. Barreto, S. MacDowell, L. F. Betiol, & P. L. Pimenta (Coords.). Sociedade e estado: superando fronteiras.
São Paulo: FUNDAP.