BAR, Curitiba, v. 6, n. 3, art. 1, p. 173-186, July/Sept. 2009
A Five-Year Hedonic Price Breakdown for Desktop
Personal Computer Attributes in Brazil
Nuno Manoel Martins Dias Fouto *
E-mail address: [email protected]Faculdade de Economia, Administração e Contabilidade/Universidade de São Paulo São Paulo, SP, Brazil.
Claudio Felisoni De Angelo
E-mail address: [email protected]Faculdade de Economia, Administração e Contabilidade/Universidade de São Paulo São Paulo, SP, Brazil.
Marcos Roberto Luppe
E-mail address: [email protected]Faculdade de Economia, Administração e Contabilidade/Universidade de São Paulo São Paulo, SP, Brazil.
A
BSTRACTThe purpose of this article is to identify the attributes that discriminate the prices of personal desktop computers. We employ the hedonic price method in evaluating such characteristics. This approach allows market prices to be expressed as a function, a set of attributes present in the products and services offered. Prices and characteristics of up to 3,779 desktop personal computers offered in the IT pages of one of the main Brazilian newspapers were collected from January 2003 to December 2007. Several specifications for the hedonic (multivariate) linear regression were tested. In this particular study, the main attributes were found to be hard drive capacity, screen technology, main board brand, random memory size, microprocessor brand, video board memory, digital video and compact disk recording devices, screen size and microprocessor speed. These results highlight the novel contribution of this study: the manner and means in which hedonic price indexes may be estimated in Brazil.
Key words: personal computers; hedonic pricing; hedonic attributes and regression; price indexes.
Received 29 March 2008; received in revised form 20 February 2009.
Copyright © 2009 Brazilian Administration Review. All rights reserved, including rights for
translation. Parts of this work may be quoted without prior knowledge on the condition that
the source is identified.
* Corresponding author: Nuno Manoel Martins Dias Fouto
I
NTRODUCTIONThe aim of this article is to study the value of the different attributes that compose the market price of desktop personal computers. We employed hedonic regression to obtain the specific weight of each main pricing characteristic. The relevant attributes associated to a certain product may be related to its physical characteristics, complementary services or products, the manner and conditions under which is sold, subjective image aspects, etc. Determining the relative importance of these characteristics allows companies to define their strategic position more adequately, bearing in mind the possibilities of meeting demand. In this analytical approach, products are seen from several dimensions, transcending the traditional approach strictly tied to price and quantity variables.
Hedonic pricing methods are reasonably well known to econometric studies, although they receive little mention in marketing research textbooks. Hedonic analysis uses the prices practiced in product transactions as a dependent variable, and corresponding attributes as independent variables.
The desktop personal computer market is supplied by companies that offer heterogeneous, vertically-differentiated products. Personal computers first reached the market in the mid-1970s. The industry grew quickly and became dominated by a small number of large-scale companies. In the 1990s, however, a large number of smaller companies entered the market, making the industry highly competitive.
A desktop personal computer may be identified according to characteristics such as: processing performance; processor brand, hard drive and random memory capacity and access interface, whether it has CD and DVD drives, screen size and technology and display adapter technology, expansion devices, communication devices, the number of input/output ports, main dimensions, sound devices, security features, BIOS, operating system and additional software, warranty and environmental specifications.
This article has been organized into five sections. The first presents a review of the literature regarding the evolution of the hedonic pricing concept and its applications. The second section describes the analytical model employed in evaluating the attributes of personal computers. Sections three and four, respectively, present the data and the study’s results. The final part, section five, presents general conclusions, an outline of the study’s limitations and possible extensions.
R
EVIEW OF THEL
ITERATUREMicroeconomic theory bases its analysis of individuals’ choice processes on the fact that the consumption of goods and services provides varying levels of satisfaction. The expression hedonic analysis comes from this perspective. Etymologically, the word hedonic is derived from the Greek hedonikos, meaning pleasure. Such a designation therefore calls to mind the idea of usefulness or satisfaction inherent to the attributes that compose the offer of a good or service.
The method known as hedonic pricing was introduced in the mid-20th century to handle product quality issues. Only more recently, however – in the 1960s – did it gain notoriety, when it was used in the United States Consumer Price Index [CPI] (Hulten, 2002).Schultze and Mackie (2002) considered hedonics to be “the most promising technique for explicitly adjusting observed prices to account for changing product quality” (p. 122). In price indexes, hedonic regressions are used to estimate the value of specific bundles of individual characteristics that, when considered as a single set, form goods or services.
coefficients of characteristic or attribute variables in hedonic equations represent average marginal implicit prices for each relevant attribute/characteristic (Bartik, 1987; Epple, 1987; Rosen, 1974). One may say that properly valuated attributes denote the consumers’ structure of preferences by associating price variations to the type and intensity of the main characteristics (Freeman, 1993).
Several studies have employed this analysis method. The first of these studies was that on the vegetables market conducted by Frederick V. Waugh and mentioned by Berndt (1991). Court (1939) later pioneered the use of the adjective hedonic, suggesting the use of the coefficients of regressing automobile prices on their characteristics in the construction of price indexes. Houthakker (1952), in turn, introduced the concept of quality as a set of distinct variables to be considered concomitantly with the quantities consumed. He defines a quality price considering the price differential according to different attribute combinations. Lancaster (1966, 1971) and Gorman (1980) then adapted the concept of a utility map from a new analytical perspective. In these studies, alternatively to the traditional view of consumer theory, where individuals choose between quantities of products, choices are based on attributes and their respective intensities. Griliches, however, was the first to point out that interesting studies could be accomplished with hedonic pricing models. Building from the ideas put forth by Court (1939), Griliches (1961) proposed the use of hedonic pricing as a way to attenuate the issue of new product launches when constructing price indexes. As new products frequently offer more characteristics desired by consumers, the difference between their prices and the prices of their older counterparts cannot be attributed solely to inflation for the periods before and after the entry of the new products into the market. Another of Griliches’ lines of research concerned the use of production and input indexes to measure technological change. Economic models of the time showed most production growth to be a result of technological evolution, measured by the residues of their equations. The relative importance of these residues led him once more towards hedonic regression, in a study of the problem of measuring change in quality, carried out for the National Board of Economic Research [NBER] in 1961 (Griliches, 1971). Court and Griliches suggested the estimation of a surface that would relate prices to characteristics. This estimated surface would be employed in obtaining estimates of product prices adjusted, according to their quantities, to a set of characteristics. This would allow estimates of price changes in differentiated products, adjusted to quality, to be obtained.
Hedonic price functions may therefore be seen as empirical representations of the relationship between prices and characteristics of goods sold in markets whose products are relatively differentiated. The term hedonic method means that a hedonic function is applied to economic measurement,
P = h(c) (1)
where P represents, in a cross section of prices of goods and services, one price pijt for each model or
variety ‘j’ of the good or service ‘i’ available at a time ‘t’. The matrix c has one characteristics row for each model (Triplett, 1990).
A reasonable number of papers on hedonic pricing followed Griliches’ work, with a theoretical focus on examining the relationships between price and characteristics: from the demand point of view (Muellbauer, 1974); from the supply point of view (Ohta, 1975); or generated by equilibrium in differentiated product markets (Anderson, Palma, & Thisse, 1989; Berry, Levinsohn, & Pakes, 1995; Feenstra, 1995; Rosen, 1974).
The model published by Rosen (1974) is considered to have been the first to theoretically relate the hedonic function to the utility function and the production function. Rosen’s paper elicited several others, which advanced theoretical discussion of important issues, such as the identification problem (Bajari & Benkard, 2001; Bartik, 1987; Brown & Rosen, 1982; Epple, 1987; Kahn & Lang, 1988).
According to Rosen (1974), characteristics are the real arguments of the utility function. Therefore:
where Q is the utility (or scalar production) and Z is a vector of other homogeneous goods (or productive inputs). For the sake of simplicity, Triplett (1990) uses only one heterogeneous good in the system, with (c) characteristics. It is assumed that the above equation may be written as
Q = Q[q(c), Z] (3)
where q(.) is an aggregator of the characteristics (c) which are embedded in the heterogeneous good. A similar development of the theory, from the producer side, considers the production of a heterogeneous good to be the simultaneous production of the set of characteristics that comprise it.
The economic behavior of buyers and sellers of heterogeneous goods may be described by systems of supply and demand functions of these goods’ characteristics. These supply and demand functions are derived from the optimization of buyers’ and sellers’ objective functions regarding these characteristics. On the demand side, for instance, q(.) contains information on preferences (or technologies used), and the hedonic function h(.) of Equation 1 provides information on the characteristics’ price surface. Optimal location on the characteristics plane occurs when both surfaces, h(c) and q(c), are tangent to each other.
Rosen (1974) showed that, there being n buyers with varied tastes (or technologies), the hedonic function h(.) will identify an envelope in the set of preferences (or technologies) described by n aggregating functions q1(.),...qn(.). As in any envelope, the shape of h(.) is independent of the shape of q(.), except in special cases, and is determined on the demand side by the distribution or positioning of buyers/consumers over the characteristics space. The condition on the supply side is parallel to that on the demand side. A consequence of this is that the form of the hedonic function h(.) generally becomes a purely empirical question, requiring determination through regular econometric procedures.
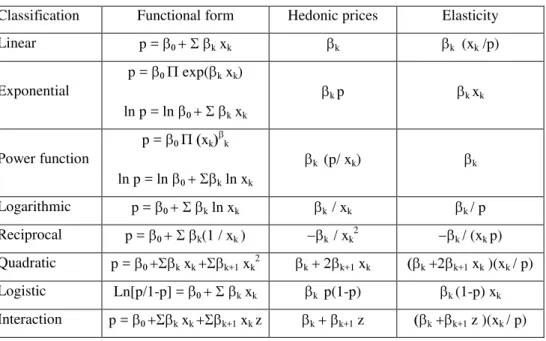
Triplett (1990) concludes that, representing a price surface in the characteristics space, hedonic functions may, empirically, take on a number of different forms, including the semi-log form, which frequently arises as the most appropriate in specification tests in the hedonic pricing literature (Griliches, 1971). Table 1 shows, in simplified notation, the four functional forms most frequently used in applying the hedonic pricing method to price indexes (Brachinger, 2002).
Table 1: Most Frequent Functional Forms
Classification Functional form Hedonic prices Elasticity
Linear p = β0 + Σ βkxk βk βk (xk /p)
Exponential
p = β0 Π exp(βkxk)
ln p = ln β0 + Σ βkxk
βk p βk xk
Power function
p = β0 Π (xk)βk
ln p = ln β0 + Σβkln xk
βk (p/ xk) βk
Logarithmic p = β0 + Σ βkln xk βk / xk βk / p
Reciprocal p = β0 + Σ βk(1 / xk ) −βk / xk2 −βk / (xk p)
Quadratic p = β0 +Σβk xk +Σβk+1 xk2 βk+ 2βk+1 xk (βk+2βk+1 xk )(xk / p)
Logistic Ln[p/1-p] = β0 + Σ βkxk βk p(1-p) βk (1-p) xk
Interaction p = β0 +Σβk xk +Σβk+1 xkz βk+ βk+1 z (βk+βk+1 z )(xk / p)
The selection of representative characteristics for differentiated products is fundamental if one is to obtain precise estimates of implicit prices, because the goods’ component characteristics will frequently vary collinearly due to subjective and objective (technological) considerations (Arguea & Hsiao, 1993). A common procedure for reducing the number of attributes in a statistical study is the use of a principal components analysis (a multivariate analysis technique). These components provide a new set of linearly combined measurements. However, if the goal is to estimate structural supply and demand for the characteristics, temporal cross-section data should be used. If principal components analysis is applied separately to each year, the principal component loading will become heavily dependent upon product choices for each year and will not be the same over time, due to variations in the technology matrix.
If principal component analysis is applied to several years’ pooled data, time trends in product specifications will frequently be found. When the supply and demand of characteristics is estimated, the aggregate measure, and not the unit quantity, of a product is relevant. Therefore, to reduce dimensionality, one may apply a procedure based on the conditional index measure together with the variance decomposition method originally suggested by Besley, Kuh and Welsh (1980) to detect the degree of multicollinearity.
Arguea and Hsiao (1993) proposed the sequential use of this procedure to identify a group of linearly independent attributes. Once the group had been identified, they performed verification by regressing excluded characteristics to included ones, verifying whether the bulk of variation in the excluded variables could be explained by variation in the included variables. It is important to note that such a procedure will only select linearly independent characteristics contained in a product. Whether or not consumers are interested in them will depend on their respective coefficients, in a hedonic price function, being statistically different from zero.
In practice, strong inter-variable dependencies are commonly found. The matter of selecting a group of independent characteristics is therefore empirical, and there is no way to determine beforehand which characteristics should be included or excluded. Even if one assumes that published characteristics are those more interesting to consumers, it is only reasonable that several of them should contain similar information.
Most studies of hedonic regression in the computer market focus on the construction of adjusted price indexes (Berndt & Griliches, 1993; Berndt, Griliches, & Rappaport, 1995; Gordon, 1990). Luzio and Greenstein (1995) used the hedonic method to measure the performance of the Brazilian personal computer industry as protected by the Information Technology Act. Stavins (1995) uses hedonic regression to analyze model entry and exit in a differentiated product market. Hedonic price regression methods employed in adjusting quality for personal computer prices are generally based on cross-sectional or time series data, and presuppose parameter stability in different models, as well as relative parameter stability over time.
We may summarize by saying that, as Arguea and Hsiao (1993) point out, empirical investigations of hedonic models have two main, distinct focuses of interest: one, to determine how unit prices of a certain good vary according to the good’s set of constituent characteristics or attributes, and two: to estimate underlying supply and demand functions of their characteristics. This study will focus on the former.
THE MODEL
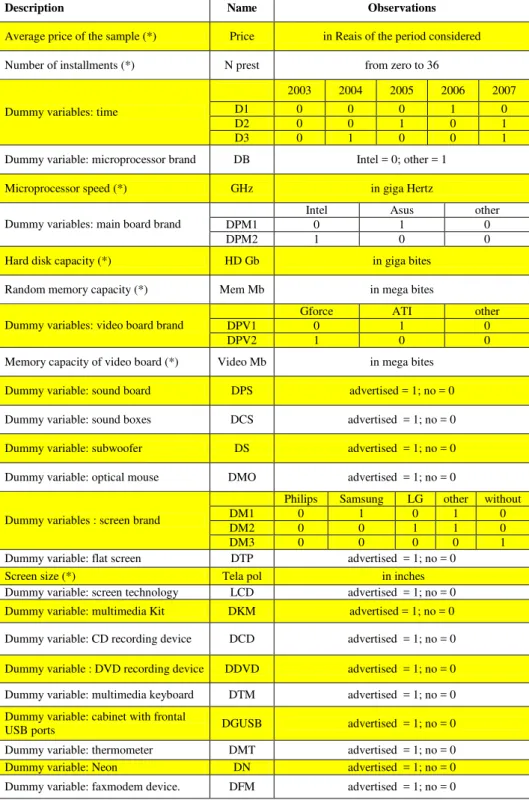
Based on the review of the literature, we formulated the following hedonic expression:
where pit is the price of model i for period t; Dt is a dummy time variable, and xijt s the level of
characteristic j of model i for period t; and uit is an error component. Table 2 presents all variables
used in the study. Four different specifications combining the linear (lin) and logarithmic (log) functions of dependent (first) and independent variables (second) were tested: lin-lin; log-lin; log-log, and lin-log. For each specification, two regression procedures proved to be interesting regarding the treatment of missing values: the stepwise and meansub procedures were used in all regressions. Special attention was paid to the significance of estimators, individually and as a group, as well as to usual aspects of collinearity.
Table 2: Variables Included in the Model
(*) Figures in level or logarithm, according to the specification tested.
Description Name Observations
Average price of the sample (*) Price in Reais of the period considered
Number of installments (*) N prest from zero to 36
2003 2004 2005 2006 2007
D1 0 0 0 1 0
D2 0 0 1 0 1
Dummy variables: time
D3 0 1 0 0 1
Dummy variable: microprocessor brand DB Intel = 0; other = 1
Microprocessor speed (*) GHz in giga Hertz
Intel Asus other
DPM1 0 1 0
Dummy variables: main board brand
DPM2 1 0 0
Hard disk capacity (*) HD Gb in giga bites
Random memory capacity (*) Mem Mb in mega bites
Gforce ATI other
DPV1 0 1 0
Dummy variables: video board brand
DPV2 1 0 0
Memory capacity of video board (*) Video Mb in mega bites
Dummy variable: sound board DPS advertised = 1; no = 0
Dummy variable: sound boxes DCS advertised = 1; no = 0
Dummy variable: subwoofer DS advertised = 1; no = 0
Dummy variable: optical mouse DMO advertised = 1; no = 0
Philips Samsung LG other without
DM1 0 1 0 1 0
DM2 0 0 1 1 0
Dummy variables : screen brand
DM3 0 0 0 0 1
Dummy variable: flat screen DTP advertised = 1; no = 0 Screen size (*) Tela pol in inches Dummy variable: screen technology LCD advertised = 1; no = 0 Dummy variable: multimedia Kit DKM advertised = 1; no = 0
Dummy variable: CD recording device DCD advertised = 1; no = 0
Dummy variable : DVD recording device DDVD advertised = 1; no = 0
Dummy variable: multimedia keyboard DTM advertised = 1; no = 0
Dummy variable: cabinet with frontal
Hypothesis testing of the stability and equality of parameters employs the Chow test, with a parameter covariance matrix based on ordinary least squares analysis and heteroscedastic robustness. A p-value below 0.05 is taken to be indicative of statistical significance.
Pakes (2002) do not recommend that much attention should be paid to the signs of the coefficients as distinct measurements of consumer marginal evaluations or producers’ marginal cost. However, as this work uses a five-year cross section, it is reasonable to consider signs, as it is hoped that market variation can be better captured by yearly dummy variables. These coefficients are considered to be a representation of the results of consumer and producer optimization in differentiated product markets at a given moment. We chose not to correct price values to the dollar. As the regressions will employ time dummy variables, we expect the dollar’s effect to be captured by the coefficients of these variables. We also used dichotomous effect variables for other characteristics advertised in the computers offered in the researched media. Regarding the chosen approach, we must consider that, as technology advances over time, the marginal costs of computer attributes will fall.
DATA
We obtained the data from ads published weekly in the IT supplement of the Estado de S. Paulo newspaper, from January 2003 through December 2007.
The data set could be considered an unbalanced year panel, as there is no information on each observed model’s sales volume and repetition of models on sale from one week to the next is to be expected.
The sample includes, for each observation, a set of technical specifications shown in Table 2. All the attribute baskets collected in the newspaper belong to companies that assemble their products in Brazil. They are, in general, medium size and small formal companies. Big brands that are known worldwide, such as HP, Compaq, Lenovo and Dell also sell their desktop personal computers in Brazil, but they do not advertise on a regular basis in the newspaper used in this study, and these brands were not included. We did include the number of payment installments in the model, as this seems to be an important aspect of commercial culture in the Brazilian market. Time control variables range from 2003 to 2007. In order to attenuate difficulties in comparing results, as this study involved the simultaneous use of many variables and transformations, we chose to establish a single base, from which several data sets could be generated without altering variable names. All regressions were performed with SPSS for Windows release 15.0.0.
RESULTS
usually present in cross-section regressions, the linear-linear specifications could be selected as the more appropriated equation among the results. All different equations showed signal coherence except the result for DMO (presence of optical mouse) in the meansub method of the log-log specification. The small coefficient value and the respective p-value obtained may lead us not to consider this signal relevant for this analysis.
By the modeling strategy used in this study, the time base specification, when all time dummy variables are zero, refers to prices for 2003. The negative signals of the coefficients for those variables showed a decreasing price in the following years analyzed. These results may be capturing the increasing power of the Brazilian real in comparison to the dollar during the period considered. The superiority of the Intel brand was confirmed by the signal results of the coefficients of variables DB – microprocessor brand, and DPM1/2 – main board brand. The negative signal of variable DFM – faxmodem – may be associated with older models when that feature used to be heavily advertised. Similar phenomena may be taking place in the case of advertised sound boxes and boards, represented herein by the variables DCS and DPS, respectively. Presence of quite obvious devices with no differentiated feature may be associated with low cost offers. The positive signal observed on the presence of subwoofer coefficient – DS – supports this conjecture. Table 4 completes Table 3 with the standardized coefficients – δt and βj from Equation 4. The standardized coefficients allow the
Specification Lin-Lin Log-Lin Log-Log Lin-Log
Method listwise meansub listwise meansub listwise meansub listwise meansub
Price 2416.34 2202.89 7.74 7.63 7.76 7.63 2459.74 2202.89
Intercept 898.914 844.014 7.099 7.101 4.988 5.494 -3876.689 -2998.164
N prest. (0.001) -3.036 (0.028) -1.701 (0.027) -0.001 -0.045 -0.030 -98.986 -62.529
D1 -209.015 -213.828 -0.110 -0.121 -0.115 -0.131 -258.023 -259.598
D2 -562.169 -519.770 -0.256 -0.254 -0.253 -0.263 -637.349 -569.741
D3 -1193.384 -1040.602 -0.516 -0.469 -0.446 -0.490 -1210.637 -1085.787
DB -277.985 -219.135 -0.139 -0.118 -0.086 -0.105 -176.943 -191.934
GHz 48.013 0.020 0.144 0.087 326.248 201.990
DPM1 164.880 155.066 0.094 0.089 0.065 0.068 111.071 100.151
DPM2 551.661 552.838 0.195 0.195 0.148 0.156 427.713 453.723
HD Gb 5.189 4.112 0.002 0.001 0.110 0.128 302.883 360.493
Mem Mb 0.536 0.629 0.101 0.131 217.805 257.174
DPV1 186.227 308.312 0.092 0.149 (0.024) 0.049 0.116 259.436
DPV2 (0.002) 72.457 151.345 0.051 0.087 (0.006) 0.029 0.050 71.567
Vídeo Mb (0.001) 0.444 (0.011) 0.250 0.070 0.062 226.575 128.946
DPS -47.312 (0.028)
DCS -110.678 -143.323 -0.040 -0.072 -0.036 -0.064 -87.684 -136.811
DS (0.001) 96.252 159.435 0.045 0.066 0.065 145.896
DMO 122.883 0.056 (0.001) 0.048 (0.027) -0.022 156.159
DM1 111.556 154.880 (0.004) 0.030 (0.004) 0.030 139.575
DM3 -208.450 -164.180 -0.089 -0.093 -0.094 -0.092 -210.716 -156.522
DTP 181.197 197.214 0.056 0.075 0.041 0.073 131.948 191.891
Tela pol 66.264 57.677 0.029 0.024 0.527 0.280 1067.513 739.783
LCD 692.687 632.418 0.227 0.225 0.307 0.249 851.327 711.905
DKM 86.104 (0.039) 39.363 0.036 (0.005) 0.030 83.754
DCD 214.677 181.062 0.106 0.090 0.054 0.047 98.694 80.075
DDVD 115.668 117.500 0.053 0.054 0.050 0.054 147.279 109.964
DTM (0.016) 67.788 112.171 (0.009) 0.028 0.061 (0.017) 0.029 0.062 (0.008) 69.747 92.642
DGUSB 164.838 143.863 (0.006) 0.048 0.062 (0.002) 0.050 139.174 (0.040) 161.894
DMT 291.123 302.671 0.107 0.114 0.076 0.122 183.387 332.231
DN 272.759 (0.002) 0.143 541.802
DFM -143.695 -83.846 -0.052 -0.041 -0.030 -58.525 (0.002)
F 252.456 367.752 298.263 458.67 218.676 418.568 309.345 396.41 R2 0.719 0.740 0.744 0.753 0.749 0.758 0.802 0.740
R2adjusted 0.716 0.738 0.742 0.752 0.746 0.756 0.799 0.739
DW 1.716 1.588 1.508 1.437 1.384 1.431 1.334 1.574
N 2693 3779 2693 3779 1784 3779 1784 3779
p-values inside brackets. otherwise less than 0.001.
Table 4: Regression Results: Standardized Coefficients
Specification Lin-Lin Log-Lin Log-Log Lin-Log
Method listwise meansub listwise meansub listwise meansub listwise meansub
N prest. -0.037 -0.020 -0.024 -0.120 -0.054 -0.108 -0.049
D1 -0.116 -0.117 -0.153 -0.153 -0.178 -0.165 -0.164 -0.142
D2 -0.322 -0.307 -0.369 -0.347 -0.368 -0.358 -0.380 -0.337
D3 -0.595 -0.544 -0.647 -0.566 -0.463 -0.591 -0.515 -0.568
DB -0.163 -0.131 -0.205 -0.162 -0.134 -0.144 -0.112 -0.114
GHz 0.044 0.041 0.115 0.062 0.107 0.063
DPM1 0.096 0.093 0.138 0.124 0.101 0.094 0.070 0.060
DPM2 0.231 0.214 0.206 0.174 0.166 0.139 0.196 0.175
HD Gb 0.274 0.215 0.206 0.169 0.182 0.191 0.204 0.234
Mem Mb 0.166 0.187 0.172 0.191 0.181 0.209 0.160 0.178
DPV1 0.042 0.062 0.053 0.069 0.032 0.054 0.052
DPV2 0.043 0.091 0.077 0.121 0.046 0.069 0.043
Vídeo Mb 0.065 0.034 0.133 0.062 0.165 0.125 0.217 0.114
DPS -0.021
DCS -0.067 -0.087 -0.061 -0.101 -0.057 -0.090 -0.057 -0.083
DS 0.044 0.064 0.051 0.061 0.060 0.058
DMO 0.069 0.079 0.069 -0.029 0.091
DM1 0.042 0.056 0.025 0.025 0.050
DM3 -0.092 -0.088 -0.098 -0.115 -0.118 -0.114 -0.108 -0.084
DTP 0.104 0.109 0.080 0.095 0.061 0.092 0.082 0.106
Tela pol 0.081 0.067 0.088 0.064 0.106 0.047 0.088 0.054
LCD 0.221 0.196 0.182 0.161 0.235 0.178 0.267 0.221
DKM 0.048 0.022 0.050 0.041 0.048
DCD 0.100 0.089 0.124 0.102 0.070 0.053 0.052 0.039
DDVD 0.069 0.070 0.079 0.074 0.076 0.074 0.092 0.065
DTM 0.040 0.064 0.041 0.080 0.045 0.081 0.044 0.053
DGUSB 0.042 0.035 0.031 0.035 0.028 0.025 0.039
DMT 0.072 0.064 0.067 0.056 0.056 0.060 0.055 0.071
DN 0.030 0.036 0.059
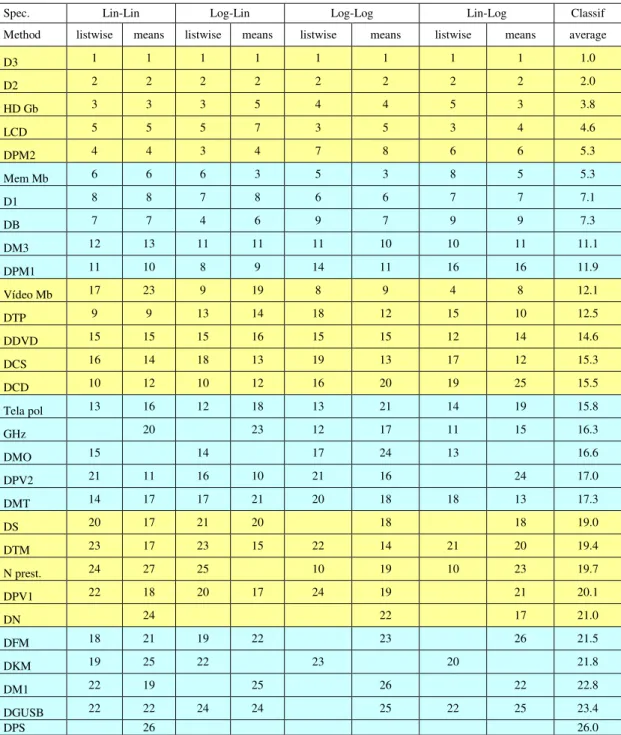
Table 5: Regression Results: Standardized Coefficients Ranking
Spec. Lin-Lin Log-Lin Log-Log Lin-Log Classif
Method listwise means listwise means listwise means listwise means average
D3 1 1 1 1 1 1 1 1 1.0
D2 2 2 2 2 2 2 2 2 2.0
HD Gb 3 3 3 5 4 4 5 3 3.8
LCD 5 5 5 7 3 5 3 4 4.6
DPM2 4 4 3 4 7 8 6 6 5.3
Mem Mb 6 6 6 3 5 3 8 5 5.3
D1 8 8 7 8 6 6 7 7 7.1
DB 7 7 4 6 9 7 9 9 7.3
DM3 12 13 11 11 11 10 10 11 11.1
DPM1 11 10 8 9 14 11 16 16 11.9
Vídeo Mb 17 23 9 19 8 9 4 8 12.1
DTP 9 9 13 14 18 12 15 10 12.5
DDVD 15 15 15 16 15 15 12 14 14.6
DCS 16 14 18 13 19 13 17 12 15.3
DCD 10 12 10 12 16 20 19 25 15.5
Tela pol 13 16 12 18 13 21 14 19 15.8
GHz 20 23 12 17 11 15 16.3
DMO 15 14 17 24 13 16.6
DPV2 21 11 16 10 21 16 24 17.0
DMT 14 17 17 21 20 18 18 13 17.3
DS 20 17 21 20 18 18 19.0
DTM 23 17 23 15 22 14 21 20 19.4
N prest. 24 27 25 10 19 10 23 19.7
DPV1 22 18 20 17 24 19 21 20.1
DN 24 22 17 21.0
DFM 18 21 19 22 23 26 21.5
DKM 19 25 22 23 20 21.8
DM1 22 19 25 26 22 22.8
DGUSB 22 22 24 24 25 22 25 23.4
CONCLUSIONS
This study employed the hedonic multivariate linear regression to determine the weight of a set of attributes in the composition of desktop personal computer prices. Based on a review of the literature, we devised some statistically significant specifications for determining the weights of the advertised characteristics. Among those specifications, the linear-linear and the stepwise method showed the best fitted result considering the collinearity problem. The explanation power obtained for the five years can be considered relevant.
The use of dichotomous variables introduced with the purpose of capturing time effect were important to provide significance to the linear regressions and confirmed the generic decreasing price of desktop personal computers throughout the analyzed years.
The first, and most important, extension of this work is a result of the aforementioned point. At present, there is no hedonic price index of consumer goods in Brazil. Our results encourage the creation of such indexes, as other countries have already done. One common strategy, not applied here but highly recommended for following studies, is to perform yearly regressions and compare the time evolution of the standardized coefficients of the same variables. That may result in interesting analyses and indexes. It is also relevant to seek new alternative transformations or specifications that would allow for correction of the historical index as new observations become available to be included in the model. A comparison of the results of computer hedonic regression studies using similar or different specifications with data from Brazil and from other countries is also recommended.
The main limitations of this study have to do with the sample. Here the prices and the characteristics of the desktop computers were collected basically from one source. All the information was gathered not from price lists or actual transactions, but from newspaper advertisements. In order to control for promotion bias, all fliers and specials offers were discarded. This also led to the exclusion of the international brands like Lenovo and Dell, but given the relatively high number of small and medium size Brazilian assemblers and the appeal of the international brands, one may expect this brand characteristic to be relevant if included in the model.
Another point to be considered is that once the information is advertised, it is difficult to check whether the product is exactly the same as the one that was announced. There may be some characteristics not mentioned or wrongly stated. But one may argue that the announcer will mainly advertise the characteristics considered relevant.
REFERENCES
Anderson, S. P., Palma, A., & Thisse, J. F. (1989). Demand for differentiated products, discrete choice models, and the characteristics approach. Review of Economic Studies, 56(1), 21-35.
Arguea, N. M., & Hsiao, C. (1993). Econometric issues of estimating hedonic price functions. Journal of Econometrics, 56(1-2), 243-267.
Bajari, P., & Benkard, C. L. (2001). Demand estimation with heterogeneous consumers and unobserved product characteristics: an hedonic approach (Research Papers Nº1691), Graduate School of Business, Stanford University, Palo Alto, California USA.
Berndt, E. R. (1991). The practice of econometrics: classic and contemporary. Reading, Mass.: Addison-Wesley Publishing Company.
Berndt, E. R., & Griliches, Z. (1993). Prices indexes for microcomputers: an exploratory study. In M. F. Foss, M. E. Manser, & A. H. Young (Eds.). Price measurements and their uses (pp. 63-93). Chicago: University of Chicago Press.
Berndt, E. R., Griliches, Z., & Rappaport, N. J. (1995). Econometric estimates of price indexes for personal computers in the 1990’s. Journal of Econometrics, 68, 243-268.
Berry, S., Levinsohn, J., & Pakes, A. (1995). Automobile prices in market equilibrium. Econometrica, 63(4), 841-890.
Besley, D. A., Kuh, E., & Welsh, R. E. (1980). Regression diagnostics: identifying influential data and source of collinearity. New York: John Wiley and Sons.
Brachinger, H. W. (2002). Statistical theory of hedonic price indexes [DQE Working Paper Nº 1]. University of Friburg, Friburg, Switzerland.
Brown, J. N., & Rosen, H. S. (1982). On the estimation of structural hedonic price models. Econometrica, 50(3), 765-768.
Court, A. T. (1939). Hedonic price indexes: with automotive examples. In American Statistical Association (Ed.). The dynamics of automobile demand (pp. 99-117). New York: The General Motors Corporation.
Epple, D. (1987). Hedonic Prices and implicit markets: estimating demand and supply functions for differentiated products. Journal of Political Economy, 95(1), 59-80.
Feenstra, R. C. (1995). Exact hedonic price indexes. The Review of Economics and Statistics, 77(4), 634-653.
Freeman, A. M. III. (1993). The measurement of environmental and resource values: theory and practice. Washington, DC: Resources for the Future.
Gordon, R. J. (1990). The measurement of durable goods prices. Chicago: University of Chicago Press.
Gorman, W. M. (1980). A possible procedure for analyzing quality differentials in the egg market. Review of Economic Studies, 47(5), 843-856.
Griliches, Z. (1961). Hedonic price indexes for automobiles: an econometric analysis of quality change. In National Bureau of Economic Research (Ed.). The Price Statistics of the Federal Government (Vol. 73, pp. 137-196). New York: Columbia University Press.
Griliches, Z. (1971). Price indexes quality change: studies in new methods of measurements (Vol. 15, pp. 3-15). Cambridge: Harvard University Press.
Houthakker, H. S. (1952). Compensated changes in quantities and qualities consumed. The Review of Economic Studies, 19(3), 155-164.
Hulten, C. R. (2002). Price hedonics: a critical review [Paper prepared for the conference: economic statistics: new needs for the 21st century]. New York: The Federal Reserve Bank of New York.
Kahn, S., & Lang, K. (1988). Efficient estimation of structural hedonic systems. International Economic Review, 29(1), 157-165.
Lancaster, K. (1971). Consumer demand: a new approach. New York: Columbia University Press.
Luzio, E., & Greenstein, S. (1995). Measuring the performance of a protected infant industry: the case of brazilian microcomputers. The Review of Economics and Statistics, 77(4), 622-633.
Muellbauer, J. (1974). Household production theory, quality, and the hedonic technique. The American Economic Review, 64(6), 977-994.
Ohta, M. (1975). Production technologies for the US boiler and turbo generator industries and hedonic prices indexes for their products: a cost-function approach. The Journal of Political Economy, 83(1), 1-26.
Pakes, A. (2002). A reconsideration of hedonic price indexes with an application to PC’s [Working Paper Nº 8715]. National Bureau of Economic Research, Cambridge, MA.
Rosen, S. (1974). Hedonic prices and implicit markets: product differentiation in pure competition. Journal of Political Economy, 82(1), 34-55.
Schultze, C. L., & Mackie, C. (Eds.). (2002). At what price? Conceptualizing and measuring cost-of-living and price indexes (pp. 122-154). Washington, DC: National Academy Press.
Stavins, J. (1995). Model entry and exit in a differentiated-product industry: the personal computer market. The Review of Economics and Statistics, 77(4), 571-584.