PSEUDOMONAS ISOLATED FROM CHICKPEA RHIZOSPHERE
Neelam Tank1, Narayanan Rajendran2, Baldev Patel 1, Meenu Saraf1*
1
Department of Microbiology, University School of Sciences, Gujarat University of Sciences, Gujarat University, Ahmedabad
380 009, Gujarat, India; 2 Microbiology, Department of Biology, MASC, Kentucky State University, Frankfort, Kentucky, 4060, USA.
Submitted: April 05, 2011; Returned to authors for corrections: July 27, 2011; Approved: January 16, 2012.
ABSTRACT
Microbial siderophores confiscate the available ferric ions around the roots and trigger a reaction resulting
in plant growth promotion. In our study, a high level of siderophore production was observed from a newly
isolated Pseudomonas sp. from the rhizosphere of Chickpea plants. Under an iron depleted condition in
Standard Succinic acid medium a 1000 µgmL-1 of siderophore production was achieved. Increasing the concentration of iron showed an inverse relationship between growth and siderophore production. Fourier
Transform Infrared Spectroscopy (FTIR) analysis of the purified crystals, its UV spectral analysis and High
Pressure Liquid Chromatography (HPLC) revealed the identity of the siderophore as similar to that of
pyoverdin with distinctive characters. Electron spray ionization mass spectroscopy (ESIMS) shows presence
of abundance of A1 ions (419 m/z) and branching of amino acids from B1-B5. This pyoverdin contains a
cyclic tetra peptide but Serine and Arginine are missing. Based on our analysis and deviations from the
reported structure of pyoverdin it is suggested that this pseudomonas produces distinctly characterized
pyoverdin siderophore.
Key words: Fluorescense, hydroxamates, collision activation, pyoverdin, Pseudomonas
INTRODUCTION
Iron is essential for processes such as respiration,
photosynthesis and nitrogen fixation but microbes have
difficulty obtaining enough iron to support their growth
because iron is in immobilized form of insoluble ferric
hydroxide in soil and cannot be transported in the cells (1).
Ability to produce siderophores by an organism under iron
limiting conditions can promote plant growth by directly
supplying iron for plant utilization and by removing iron from
the environment for the growth of phytopathogens thereby
reducing their competitiveness (2). It has been studied that
yellow green siderophore producing Pseudomonas species
exert biocontrol effect on phytopathogens there by enhancing
plant growth. Pseudomonas fluorescens and P. putida produce
siderophores of two general types, Pyochelin and Pyoverdin.
Tank, N. et al. Pyoverdin from a Pseudomonas
Each siderophore has a specific role in metal acquisition.
Pyochelins are phenolate siderophores derived from salicylic
acid and cysteine. Pyoverdins are water soluble pigments that
fluoresce yellow-green under ultraviolet light. All pyoverdins
are structurally similar containing of a chromophore moiety,
which gives bacteria its fluorescent nature, and a dicarboxylic
acid (4). More than 40 pyoverdin peptide chain compositions
have been identified in the group containing arginine
dehydrolase positive, saprophytic or opportunistic animal
pathogenic fluorescent Pseudomonas species. The chemistry
and biology of different siderophores have been discussed by
Hider and Kong (3).
Pyoverdins are now used as a major tool in identification,
systematics, and characterization of closely related
pseudomonad species. There are different siderovars, regroup
strains that produce pyoverdins with same peptide chain, in
certain species. P. fluorescens has 19 siderovars where as P.
putida has 13 siderovars (5).Each siderophore has a specific
role in metal acquisition. Puesdomonas PAO1 secretes both
types of siderophores, Pyoverdin , which exhibit binding
affinity for iron and Pyochelin which shows affinity for other
metals and has a biocontrol potential. Siderophores from
different bacteria are designated and named on the basis of
name of organism for eg. Enterobactin, Agrobactin ,
Rhizobactin etc. In this study, we isolated a distinctively
characterized siderophore produced by a Pseudomonas sp.
isolated earlier from rhizosphere of Cicer arietinum and
biochemically characterized its type and variety in order to
reveal the identity of the type of siderophore.
MATERIALS AND METHODS
Bacterial strain, culture conditions and growth study
Bacterial strain of P. fluorescens was isolated and
identified by 16sRNA from the rhizosphere of chickpea crop.
This isolate was screened for Plant Growth Promoting potential
after studying its various PGP (Plant Growth Promoting ) traits
as reported by us earlier (6). The isolate was maintained on
nutrient agar at 5 oC until used. The sequence is deposited in Gene Bank Accession No. MSC2 HQ179576.
Induction and estimation of siderophores in MM9 medium
Actively growing inoculum of Pseudomonas culture was
added to MM9 medium (8) and incubated on rotary shaker
(200 rpm) and generation time calculated. Simultaneous
induction of siderophore production was also checked by
taking 1 mL of cell free supernatant was added with 1 mL of
Chromeazurol S (CAS) shuttle solution. Amount of
siderophore units was calculated as Percentage of Siderophore
Unit = (Ar-As)/Ar x 100 (where Ar = absorption of Reference
and As = Absorption of Sample) as reported earlier(7).
Induction was also confirmed by Agar Well method where the
culture supernatant was added into bored-wells in agar plates
of MM9 medium supplemented with Casamino acids and CAS
dye . Presence of siderophore can be checked as zone of
discoloration of CAS dye around the well after 24 h of
incubation at 300C.
Deferrated Standard Succinic Medium (SSM) was
inoculated with 24 h old culture and incubated at 30 oC. Siderophore production was checked after 24 h and 30 h when
culture attained its stationary phase. Detection was done using
CAS shuttle solution as described by (8). A simultaneous
change in pH was also checked. Type of siderophore was
checked by performing various methods like Arnows (9) for
detecting catecholate type of siderophore and Csaky's (10)
method for detecting hydroxamate type of siderophore.
Effect of different FeCl3 concentration on siderophore production and Fluorescence
In order to determine the threshold level of ferrous at
which siderophore biosynthesis is repressed in fluorescent
Pseudomonas, the deferrated liquid succinic acid medium and
then externally added with different ferrous concentration
incubated for 30 hours at 30oC and checked for production of siderophores. Fluorescence produced by isolates at different
FeCl3 concentrations was estimated by using Quinine
Bisulphate method (11) using Spectrofluorimeter (Hitachi,
Model F-2000) at an excitation of 295 nm and emission at 485
nm.
Crystallization and FTIR studies of siderophores
The produced siderophore was crystallized to study the
chemical structure. The 30h old culture was centrifuged and
cell-free supernatant was added with saturated FeSO4 solution
to get maximum ferreted siderophores. The pH was adjusted to
3.0 with H2SO4 and 50 % ammonium sulphate solution was
added to deproteinize. The aqueous phase was concentrated in
a rotary vacuum evaporator and set aside in cold to crystallize.
The filtrate was neutralized, reduced to dryness and extracted
in dry hot methanol. The crystals were then separated out on
Whatman filter paper no. 44. Crystals obtained were then used
for their FTIR analysis and compared with the FTIR of
standard hydroxamic acid crystals(12).
Partial purification of siderophore for spectral analysis
Culture was grown in deferrated SSM , the cell free
supernatant was collected and its pH was adjusted to 6.0 with 6
M HCL. This supernatant was then passed through XAD-4
column (25x2.5 cm) with a flow rate of 60 mL in 1 h. After
complete removal of the fluorescence from the supernatant, the
column turns green proving the adsorption of fluorescence
pigment on the resin. (13). Six different fractions of 1.5 mL
each were collected and studied for the presence of
fluorescence under U.V. light. The peak of absorbance was
checked using UV visual spectrophotometer. Influence of pH
on the shift of absorption peak was checked on partially
purified pyoverdins at various pH (3.0, 5.0, 7.0 and 10.0) and
compared with standard P. fluorescens at pH 7.0 and 3.0
according to Bultreys et al,(13) who has linked the siderophore
production to pH.
Detection and Comparison of Pyoverdins by HPLC and MS
After incubation for 30h, the culture was centrifuged for
20 min. This was then filtered through 0.2 µm membrane filter
and pH adjusted to 5.0 - 5.5. Pyoverdin production was
estimated by measuring the absorbance at 403 nm. By using
HPLC, the retention times (RT) of peaks with comparable
heights were analyzed. The HPLC analyses were performed
with Nucleosyl C18 columns and a Waters 2190 system.
The molecular mass of the pyoverdin was determined by
mass spectrometry using Electron spray Ionization Solvent
H20, CH3OH, CF3COOH 50:50:1 capillary temperature 230oC
spray voltage 3.4 - 3.6 kV (15).
RESULTS AND DISCUSSION
Induction and Estimation of siderophore in the medium
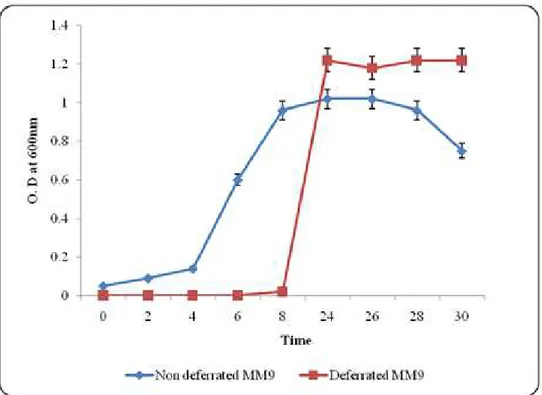
The isolate entered into log phase after 8h of incubation
on shaker in deferrated MM9 medium which was 4 h later than
that in nutrient medium and achieved its stationary phase after
30h (Figure 1). Here glucose served as sole C source and
glutamic acid served as sole N source. Similar results were also
obtained by Carson et al. (13) when S. meliloti was grown in
MSM-YE medium, which showed an increase MGT in absence
of iron in the medium. The result shows that siderophore
production was induced along with the growth of the isolate
(Figure 2), and was observed just after 8h when the culture
entered into logarithmic phase and continued to increase until
the culture attained stationary phase i.e. 30h. Results show that
hydroxamate types of siderophores, with high ferrous affinity,
are present in the supernatant. Siderophore units (%) in the
culture broth were found to be 85 % (Table 1). Sayyed et al.
(6) also found presence of 87 % of siderophore units in the
medium.
Siderophore production by the isolate carried out on solid
CAS blue agar showed a 22 mm clear zone of orange colour
representing iron chelation. Supernatent from culture was
Tank, N. et al. Pyoverdin from a Pseudomonas
(Catecholate). The supernatant turned pink upon addition of ferric
perchlorate indicating the hydroxmate group of siderophore.
Quantitative estimation showed that the organism produced a
maximum of about 1000 µg mL-1 of hydroxamate type of
siderophore in culture medium (Table 1) after 24h of incubation
which remained constant even after 30 h of incubation. The pH of
the media changes as the culture ages and uses up the available
nutrients. Siderophore production also increases as iron is depleted
from the media. Therefore increase in pH may be coincidental to
increase in siderophore concentration. The pH increased from 6.8
to a maximum of 10 along with siderophore production. It is
reported that alkaluine pH helps in solubilization of iron which
results into more iron content in medium and hence a decline in
siderophore production (7). This change in pH of the medium
during siderophore production was also reported by Budzikiewicz
(16) mentioning that alkalinity is important to avoid siderophore
destruction. On the contrary Sharma and Johri (17) showed that
higher pH is rather destructive to siderophores.
Figure 1. Growth rate of P. fluorescence under deferreted and non deferrated MM9 medium. The growth was measured in terms
of optical density at 600 nm.
Table 1. Detection characterization and quantification of Pyoverdins in SSM. Quantitative estimation showed that the organism produced a maximum of about 1000 μg mL-1 of hydroxamate type of siderophore in culture medium after 24 hours of incubation which remained constant even after 30 hours incubation.
Time Sid. Unit Hydroxamates Zones around agar cup (mm) pH
24 h 85% 1000 μg mL-1 22 8.0
Growth and siderophore production in MM9 medium 0 0.1 0.2 0.3 0.4 0.5 0.6 0.7 0.8 0.9
0 2 4 6 8 10 24 26 28 30 time (h) G row th a t 6 0 0 nm ( O D ) 0 200 400 600 800 1000 1200 S ide rop hor e pr od uc ti o n (µ g m l -1)
OD Siderophore produced
Figure 2. Growth Phase and siderophore induction study of P.
fluoresence in MM9 Medium.
The growth of the isolate was expressed in optical density (■)
at 600 nm and its siderophore production (♦) was given
concurrently.
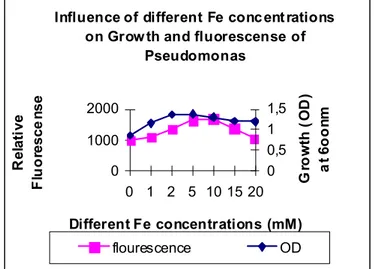
Effect of different FeCl3 concentration on siderophore production
Pseudomonas showed increase in growth with increase in
FeCl3 concentration revealing that presence of FeCl3 is vital for
its growth (Figure 3) .This was also reported by De Villegas
(17) who stated that concentration of FeCl3 above 10 µM has a
negative effect on siderophore production whereas Manninen
and Sandholm (19) reports that highest siderophore production
occurs only at iron concentration at and above 50 µgmL-1. Our results show maximum siderophore production occurs at 2 µM
FeCl3 which declines thereafter up to 20 µM of Fe. An increase
in fluorescence was reported along with increase in FeCl3
concentration up to 2 mM FeCl3 concentration. It can be
reported that production of fluorescence is a response to
presence or absence of FeCl3 in the medium. Amount of
fluorescence produced by the isolate Pseudomonas increased
along with the concentration of FeCl3 but up to just 2 mM
concentration after which a continuous decrease was reported
(Figure 3). This increase was parallel to growth of the isolate,
which shows that pyoverdin biosynthetic genes and thereby
fluorescence are under the control of iron regulated promoters.
Influence of different Fe conc ent rations on Grow th and fluorescense of
Pseudomonas
0 1000 2000
0 1 2 5 10 15 20
Different Fe concentrations (mM)
R e la ti ve F lu o resce n se 0 0,5 1 1,5 Gr o w th (O D ) a t 6 oon m flourescence OD
Figure 3. Influence of different concentrations of FeCl3 on
growth and Fluorescence of P.fluorescence.
Extraction and purification of siderophore crystals from
the supernatant
Extraction of ferrichrome type of hydroxamates by Benzyl
alcohol method yielded fine needle shaped crystals after entire
process. These crystals were then collected and studied for
FTIR analysis on KBr pellets range between the ranges of 2.5
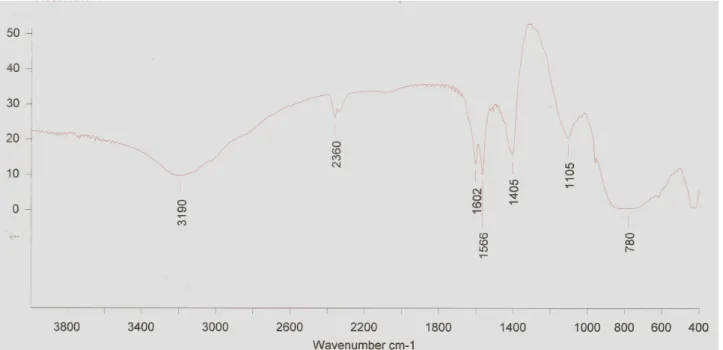
to 14 (4000-400 cm-1). This scale was selected according to PBHA crystals used as standard. FTIR results (Figure 4) show
that the crystals obtained had hydroxamate functional group,
which correlated with the peaks obtained from the FTIR
analysis of PBHA crystals. Peaks were observed at 3189, 2360,
1602, 1566, 780 and 530 wave number, which are same as
those obtained from PBHA crystals FTIR analysis. But along
with these peaks two more peaks were also observed at 1495
and 1105 wave number revealing the presence of one -C-H
bending with functional group -CH2 and one -N-O structure
due to functional group N-O bonding, which shows that
although these are hydroxamate crystals they still contain other
Tank, N. et al. Pyoverdin from a Pseudomonas
of standard hydroxamic acid crystals. There are reports that
hydroxamate crystals of fungal siderophore contained
functional groups like methyle, amide, secondary amine,
methylene, N-O bond and a ring structure (M-O) where M=Fe
(12). As observed in the present study, the certain functional
chemical group resembled ferrichrome siderophores.
Figure 4. FTIR analysis of siderophore crystals. FTIR analysis of the crystals obtained after extraction and purification of the siderophore showing peaks similar to that of standard PBHA crystals alongwith two more peaks at 1105 and 1495.
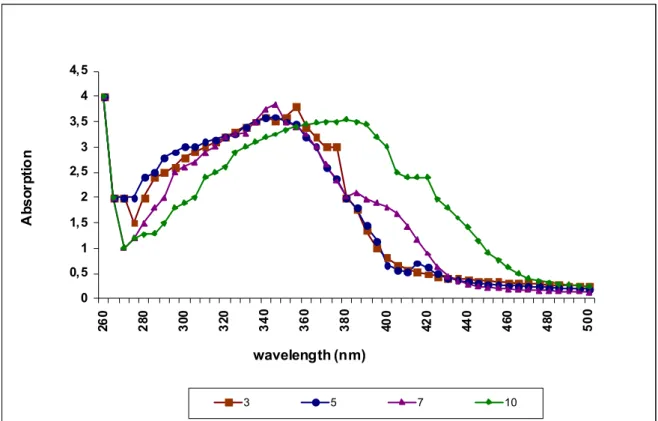
Spectral Analysis
The absorption spectra of the pyoverdin extracted were found
to be pH sensitive. At lower pH (3.0-5.0) the peaks were found at
385 nm where as at pH 7.0, the major peak was found to be at 410
nm (Figure 5). Similar results were also quoted by Xiao (18) who
reported that atypical pyoverdins had double peaks at low pH
values (i.e. 366 & 384 nm for Pf-A, 368 & 384 for Pf-B and 369
and 385 nm for Pf-C). However at higher pH values (pH 7), the
pyoverdin spectra had single peaks (407 nm for Pf-A and Pf-B
where as Pf-C has a peak at 408 nm on UV spectra. Bultreys et al
(5) report that as the pH of the supernatant containing pyoverdin is
reduced, the absorption maxima moves towards the lower
ultra-violet range. According to him, P. asplenii shows absorption
maxima at pH 7.0 at about 407 nm, which became 406 nm at pH
4.0 and 405 nm at pH 3.5. Thus it behaves as putative pyoverdin at
lower pH (3.0) and as distinctive pyoverdin as the pH increased
from 3.0 to 7.0 and above. All pyoverdins have a common feature
in its molecular structure i.e. a constant quinoline chromophore
group bound to a peptide chain and to a dicarboxylic acid or a
dicarboxylic amide (21). and the presence of three iron-binding
ligands. One ligand is located in a catechol chain and one on
hydroxamic acid chain derived from ornithin or b-hydroxyaspartic
acid. The atypical feature of the pyoverdin of P. syringae and P.
viridflavia is the presence of two OH-Asp residues of Ornithin in
the chelation of iron. This feature influences the spectral
characteristics of Fe(III) chelated atypical pyoverdin (14). The
main difference observed between siderophores produced by
different Pseudomonas is the arrangement of L and D amino acids.
Pyoverdins can be further segregated as typical and atypical
0 0,5 1 1,5 2 2,5 3 3,5 4 4,5
26
0
28
0
30
0
32
0
340 360 380 40
0
42
0
44
0
46
0
48
0
500
wavelength (nm)
Ab
s
o
rp
ti
on
3 5 7 10
Figure 5. Influence of changes of pH on absorption spectra of pyoverdin. UV-absorption spectra of siderophore at different pH. (3.0, 5.0, 7.0, 10.0).
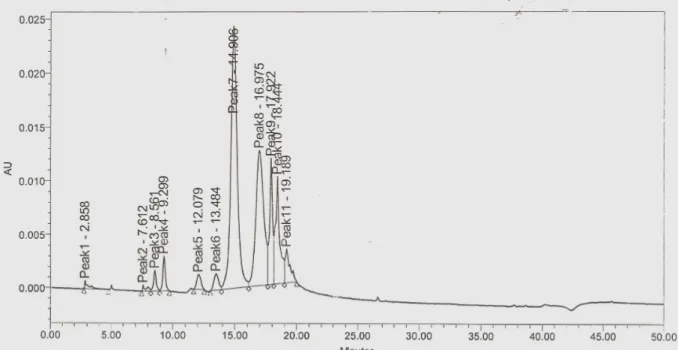
Detection and Comparision of Pyoverdins by HPLC and
ESIMS
Dominant peak for this pyoverdin appeared at 14.906 min,
16.975 min and 18.444 min (Fig: 6). RT data allowed
discrimination between pyoverdin with different peptide chains
produced by different species of Pseudomonas (5). In visual
tests a change in color of production medium that accompanied
in the pH 7.0 to 4.0 indicated atypical pyoverdin
production(14). Reference strain P. syringae B301D RT of
18.783 min and P. chicorii LMG 2162 RT of 19.075 min, P.
syringae pv. syringae PSP1 with RT of 18.758 min. Two
smaller peaks at 17.922 min and 18.444 min were obtained in
our sample. These other peaks could be correlated to minor
peaks found in P. fuscovaginae (14.906 and 16.975 min). The
result obtained with HPLC chromatogram reveals the ∆RT of
0.070 with distinguished HPLC of P.syringae LMG13190 and
∆RT of 0.341 with standard HPLC of P. cichorii LMG
showing presence of Pa A type of atypical pyoverdine.
As the pyoverdin profiles obtained were complex, the
dominant pyoverdins of the reference strains as reported by
Fuch and Budzekiewicz (22) were used for comparisons.
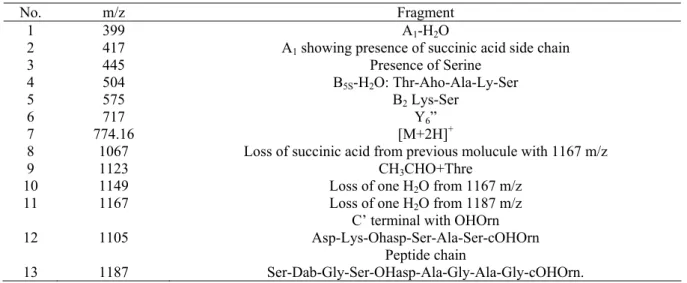
ESIMS when performed using purified supernatant of the
culture, yielded several peaks as mentioned in the Table 2. The
peaks were obtained in a wide range of m/z starting from 399
m/z to1239 m/z. The peak at 399 m/z represents presence of A1
fragment with a loss of one H2O molecule. Next visible peak
was at 417 m/z which represent A1 fragment showing presence
of succinic acid side chain. Peak 445 m/z shows presence of
serine where as 504 shows B5S-H2O fragment representing
Thr-AhO-Ala-Ly-Ser side chain. Peak at 575 m/z shows present of
Lys-Ser fragment. The highest peak observed was at 717 m/z
showing presence of Y6” fragment of pyoverdin. This side
chain contains amino acids like Ala-Thre-Oho-Ala-Ly-Ser in
Tank, N. et al. Pyoverdin from a Pseudomonas
pyoverdin of P. fluorescens showing molecular mass of 1167
m/z as reported (23). The result also shows that the siderophore
contains C terminal with OHOrn side chain. Peaks at 1105 m/z
represent side chain with
Asp-Lys-OHasp-Ser-Ala-Ser-cOHOrn. Peak at 1123 m/z shows presence of CH3CHO+Thr
and a peak at 1187 m/z represents a side chain of
Ser-Dab-Gly-Ser_OHasp-Ala-Gly-Ala_Gly-cOHOrn. Peak at 1149 m/z
reperesents a loss of H2O molecule from the previous peak
1167 m/z visible in the spectra. Certain peaks i.e 1149 m/z
and1167 m/z showed a gradual loss of H2O molecule from the
actual molecule 1187 which resembles the presence of amino
acid side chain
Ser-Dab-Gly-Ser-OHasp-Ala-Gly-Ala-Gly-cOHOrn (Table 2). Siderophores like pyoverdins produced by
the fluorescent members of the bacterial genus are very
complex in structures. Their peptidic part- linear or partially
cyclic-comprises unusual and partially modified amino acids
which makes their interpretation difficult. Free pyoverdins as
well as the ferri pyoverdins generally give abundant [M+H]+ ions occasionally accompanied by [M+2H]+2 with lower intensity as is observed over here at 774 m/z peak where as
peak at 557 m/z represent [M+2H] with a loss of CO and H2O
molecules(22). Most important is the formation of fragment A1
which has been observed in all pyoverdins showing presence of
succinic acid side chain with Ser as first amino acid. Present
report also show a peak at 417 m/z which represent the
presence of fragment A1 containing Ser as first amino acid in
the side chain which supports that the siderophore extract
contains pyoverdin type of siderophores. The obtained ESIMS
spectrum resembles the ESI spectrum of P. fluorescens P19
pyoverdin obtained by Fuch and Budzekiewicz, (22) where
they mention that ESI of [M+H]+ of pyoverdin shows a peak at 1169 m/z reporting that OH transfer is possible from other
amino acids (Asp, Fho, Ser etc). The present pyoverdin
contains cOHOrn C-terminal resembling the peptide chain of
Py 2798. Here cyclic chain is if Ser/Dab which refers to the
condensation product of the γ- NH2 group of Dab with the
amide carbonyl group of the preceding amino acid giving a
tetrahydro pyrimide ring as mentioned by Fuchs and
Budzekiewicz (22).
Table 2. ESIMS analysis of the siderophore produced by the isolate.
No. m/z Fragment
1 399 A1-H2O
2 417 A1 showing presence of succinic acid side chain
3 445 Presence of Serine
4 504 B5S-H2O: Thr-Aho-Ala-Ly-Ser
5 575 B2 Lys-Ser
6 717 Y6”
7 774.16 [M+2H]+
8 1067 Loss of succinic acid from previous molucule with 1167 m/z
9 1123 CH3CHO+Thre
10 1149 Loss of one H2O from 1167 m/z
11 1167 Loss of one H2O from 1187 m/z
C’ terminal with OHOrn
12 1105 Asp-Lys-Ohasp-Ser-Ala-Ser-cOHOrn
Peptide chain
13 1187 Ser-Dab-Gly-Ser-OHasp-Ala-Gly-Ala-Gly-cOHOrn.
CONCLUSION
Pseudomonas have been studied widely as siderophore
producers and siderotyping is an important step in
identification of Pseudomonas as it is species specific. The
novel isolate Pseudomonas fluorescens shows some distinct
features which have not been observed so far in and suggests a
new type of Pyoverdin.
ACKNOWLEDGEMENTS
We sincerely acknowledge the funding facilities from the
University Grant Commission (UGC) India to conduct these
studies. Thanks are due to Prof..S K Menon, Department of
Chemistry for helping us in sample analysis and interpretation
of results.
REFERENCES
1. Arnows, L.E. (1937). Colorimetric determination of the components of 3,4-hydroxyphenylalanine-tyrosine mixtures. Annu. Rev. Biochem.
50:715-731.
2. Bakker, P.A.H.M.; Ran, L.X.; Pieterse, C.M.J.; Van Loon, L.C. (2003). Understanding the involvement of rhizobacteria-mediated induction of systemic resistance in biocontrol of plant diseases. Can. J. Plant. Pathol.
25:5–9.
3. Barelmann, I.; Taraz, K.; Budzikiewicz, H.;Geoffroy, V. (2002). The structures of the pyoverdins from Pseudomonas fluorescens strains accepted mutually by their respective producers. Naturforsch. 57c: 9-16. 4. Budzikiewicz, H.; (1993) Secondary metabolites from fluorescent
Pseudomonas. FEMS. Microbiol. Rev. 104: 209-228.
5. Bultreys, A.; Gheysen, I.; Wathelet, B.; Maraite, H.; Hoffman, E. (2003). HPLC Analysis of pyoverdin siderophores diffrenciate among phytopathogenic fluorescent Pseudomonas. Appl Environ Microbiol 69 (2) 1143-1153.
6. Bultreys, A.; Gheysen, I. (2000). Production and Comparison of peptide siderophores from strains of distantly related pathovars of Pseudomonas
syringae and Pseudomonas viridiflava LMG 2352. Appl. Environ. Microbiol. 66: 325-331.
7. Bultreys, A.; Gheysen, I.; Maraite, H.; Hoffman, E. (2001). Characterization of fluorescent and nonfluorescent peptide siderophores produced by Pseudomonassyringae strains and their potential use in strain identification. Appl. Environ. Microbiol. 67: 1718-1727.
8. Carson, K.C.; Meyer, J.; Dilworth, M.J. (2000). Hydroxamate siderophores of root nodule bacteria. Soil. Biol. Biochem. 52: 11-21. 9. Csaky, T.Z. (1948). On estimation of hydroxylamine in biological
materials. Acta. Chem. Scand. 2: 450-454.
10. Dave, B.P.; Dube, H.C. (1999). Chemical Structure and properties of certain fungal siderophores. Ind. J. Microbiol. 39: 221-226.
11. De Villegas, M.E.D.; Villa. P.; Frias, A. (2002). Evaluation of siderophores production by Pseudomonas aeruginosa PSS. Rev. Latinoam. Microbiol. 44:112-117.
12. Fuchs, R.; Budzikiewz, H. (2001). Structural studies of pyoverdins by mass spectrometry. Curr. Org. Chem. 5: 265-288.
13. Hider, R.C.; Kong, X. (2010). Chemistry and Biology of Siderophores.
Tank, N. et al. Pyoverdin from a Pseudomonas
14. Kloepper, J.W.; Leong, J.; Teintze, M.; Schroth, M.N. (1980). Enhanced plant growth by siderophores produced by plant growth-promoting rhizobacteria Nature. 286:885–886.
15. Manninen, O.T.; Mattila-Sandholm (1993). Methods for detection of
Pseudomonas siderophores. J. Microbiol. Methods. 19: 223-234. 16. Patel, D.; Jha, C.K.; Tank, N.; Saraf, M. (2011). Growth enhancement of
chickpea in saline soils using plant growth promoting rhizobacteria. J Plant Growth Regul DOI 10.1007/ s00344-011-9219-7.
17. Sayyed, R.Z.; Badgujar, M.D.; Sonawane, H..M. (2005). Production of Microbial Iron Chelators (siderophores) by fluorescent Pseudomonas.
Ind. J. Biotechnol. 4: 484-490.
18. Schwyn, B.; Neilands, J.B. (1978). Universal chemical assay for detection and determination of siderophores. Anal Biochem 160: 40-47. 19. Sebat, J.L.; Paszczynski, A.J.; Cortese, M.S.; Crawford, R.L.; (2001)
Antimicrobial properties of pyridine-2-6-Dithiocarboxylic Acid a metal
chelators produced by Pseudomonas spp. Appl Environ Microbiol 67: 3934-3942.
20. Sharma, A.; Johri, B.N. (2003). Combat of iron-deprivation through a plant growth promoting fluorescent Pseudomonas strain GRP3A in mung bean (Vigna radiata L. Wilzeck). Microbiol. Res. 158: 77-81.
21. Tank, N.; Saraf, M.; (2010). Salinity resistant plant growth promoting rhiz obacteria ameliorates sodium chloride stress on tomato plants. J Plant Interactions .5 (1)51-58.
22. Totter, J.R.; Moseley, F.T. (1952). Influence of the concentration of Iron on the Production of Fluorescein by Pseudomonas aeruginosa. J Bacteriol. 65: 45-47.
23. Xiao, R.; Kissalita, W. (1995). Purification of pyoverdins of
Pseudomonas fluorescens 2-79 by copper-chelate chromatography. Appl. Environ. Microbiol. 61: 3769-3774.