SNP discovery and characterisation in White Rhino (
Ceratotherium simum
)
with application to parentage assignment
Christiaan Labuschagne
1,3, Desiré L. Dalton
1,2, J. Paul Grobler
1and Antoinette Kotzé
1,21
Department of Genetics, University of the Free State, Bloemfontein, Free State, South Africa.
2
National Zoological Gardens of South Africa, Pretoria, Gauteng, South Africa.
3
Inqaba Biotechnical Industries (Pty) Ltd, Pretoria, Gauteng, South Africa.
Abstract
The white rhino is one of the great success stories of modern wildlife conservation, growing from as few as 50-100 animals in the 1880s, to approximately 20,000 white rhinoceros remaining today. However, illegal trade in conservational rhinoceros horns is adding constant pressure on remaining populations. Captive management ofex situ populations of endangered species using molecular methods can contribute to improving the management of the species. Here we compare for the first time the utility of 33 Single Nucleotide Polymorphisms (SNPs) and nine microsatellites (MS) in isolation and in combination for assigning parentage in captive White Rhinoceros. We found that a combined dataset of SNPs and microsatellites was most informative with the highest confidence level. This study thus provided us with a useful set of SNP and MS markers for parentage and relatedness testing. Further as-sessment of the utility of these markers over multiple (> three) generations and the incorporation of a larger variety of relationships among individuals (e.g. half-siblings or cousins) is strongly suggested.
Keywords: Single nucleotide polymorphisms; microsatellite markers; White Rhinoceros;Ceratotherium simum..
Received: March 11, 2016; Accepted: May 17, 2016.
Introduction
Due to intensive protection and conservation efforts, the Southern white rhinoceros (Ceratotherium simum simum) have increased from a population of less than 100 at the end of the 19th century, to an estimated population of over 20,000 (Emslie, 2012). However, the illegal trade in rhinoceros horn in many parts of the world especially in Asia where the rhinoceros horns are used traditionally as material in sculptures or as drug products for medicinal purposes (Hsiehet al., 2003) is adding constant pressure on remaining populations. Currently, the remaining white rhino populations are being intensively managed as small isolated groups thus monitoring and maintaining genetic diversity is a key concern for long term survival of this spe-cies (Emslie and Brooks, 1999). Potential consequences of a reduction in genetic variability include (1) the inability of the species to adapt to changes in their environment and (2) inbreeding, whereby the expression of rare deleterious al-leles may contribute to developmental, reproductive and immunological impairments (Pertoldiet al., 2007; Väliet al., 2008). In order to maintain genetic diversity and the species’ evolutionary potential, a recovery strategy can be
employed whereby gene flow amongst populations is en-hanced (Lowe and Allendorf, 2010). Translocation can be considered as an option in in the case of the white rhino. However, an analysis of genetic structure is required in or-der to ensure that outbreeding depression due to the intro-duction of mal-adapted genes does not occur (Pertoldiet al., 2007; Väliet al., 2008).
Single nucleotide polymorphisms (SNPs) represent the most abundant type of DNA variation in the vertebrate genome and are distributed across the entire genome pro-viding broader genome coverage as compared to mitochon-drial DNA or microsatellites (MS) (Ryynänen and Prim-mer, 2006; Pertoldiet al., 2007). In addition, SNPs offer higher recovery of information from degraded DNA sam-ples since the DNA target sequence in SNP-based genotyp-ing is appreciably shorter (50-70 bp) than that in micro-satellite-based genotyping (80-300 bp) (Morinet al., 2004; Ryynänen and Primmer, 2006; Butleret al., 2007; Pertoldi
et al., 2007). In contrast to microsatellites, SNP genotyping reveals polymorphisms directly on the DNA sequence, and thus data is automatically standardized across chemistries, hardware platforms and laboratories (Smith et al., 2005; Gloveret al., 2010). Furthermore, the development of high through-put genotyping platforms permits simultaneous genotyping of thousands of loci, enabling the identifica-tions of highly diagnostic panels (Gloveret al., 2010). Send correspondence to Christiaan Labuschagne. Department of
Genetics, University of the Free State, P.O. Box 339, Bloemfontein,
9300 South Africa. E-mail:
In this study, we compare the power of parentage as-signment of 33 SNPs and 9 MS markers in isolation and in combination in a captive population of white rhinoceros. Development of a marker set that accurately determines parentage will provide information on the relationships and relatedness among individuals, contribute to the manage-ment of captive white rhinoceros worldwide, and addition-ally provide insight into mating systems in wild popula-tions.
Materials and Methods
Blood samples were collected from 32 white rhinoc-eros in South Africa. Blood aliquots were first treated by mixing 100mL of blood with 1000mL nuclease free water followed by centrifugation at 1500 x g for 2 min to reduce the number of red blood cells and improve DNA yields. Genomic DNA was extracted from the resulting pellet us-ing the ZR Genomic DNATM-Tissue Mini-Prep kit (Zymo Research) following the manufacturer’s instructions. A SNP enriched library was constructed using DNA from 5 individuals and digestion with Endonuclease V as previ-ously described (Labuschagneet al., 2015). This protocol was used without any changes. Subsequent SNP enriched amplicons were cloned into pJET vector using the CloneJET PCR Cloning Kit (Thermo Scientific) and Z-Competent JM109E. colicells (Zymo Research). Clones containing fragments ranging from 200-700 bp were se-lected and sequenced utilising a Big Dye V3.1 Terminator Kit and an ABI 3500XL genetic analyser. The potential SNP loci were amplified in the 5 isolates used for the initial DNA pool. Amplification reactions were done in a final volume of 25mL containing 30 ng DNA, 25 pM of each primer and 2X DreamTaq® Green Master Mix (Thermo Scientific). Thermal cycling consisted of initial denatur-ation at 95 °C for 5 min, 45 cycles of denaturdenatur-ation at 95°C for 30 s, annealing at 55-59 °C for 30 s, extension at 72 °C for 90 s, followed by final extension at 72 °C for 10 min. Resulting amplicons were inspected on 1% agarose gels followed by purification and sequencing as described above. Sequences were inspected and aligned in CLC Bio Genomics work bench 8.0.1 (CLC bio, Denmark). Twelve resulting SNP markers were further typed in the remaining 27 isolates. GENEPOP version 4.0.10 (Raymond and Rousset, 1995) was used to test for deviations from ex-pected Hardy-Weinberg (HW) proportions, to evaluate loci for gametic disequilibrium and to determine allelic rich-ness. Differences in mean observed heterozygosity (Ho), mean expected heterozygosity (He) and mean number of alleles was determined using Cervus v3.03 (Kalinowskiet al., 2007). All 32 samples were further typed for 21 previ-ously described SNP markers through Sanger sequencing (Labuschagneet al., 2013, 2015).
Nine microsatellite loci: BR6 (Cunningham et al., 1999), DB44, DB66, DB49, DB1 (Brown and Houlden,
1999), RHI7C, RHI32A, RHI7B (Florescuet al., 2003), SW35 (Rohreret al., 1994) were also used. Markers were selected based on previously reported polymorphism in white rhinoceros. The PCR optimization for each locus was as follows: 2 ng of template DNA, 1.5–2.5 mM MgCl2,
2 mM dNTP’s, 1mM forward and 1mM reverse primer, 0.10 UTaqDNA polymerase and ddH2O to a final volume
of 15mL. PCR cycles were as follows: initial denaturing stage at 94 ºC for 3 min, followed by 30 cycles of 94 ºC for 30 s, annealing at 50-55 °C for 30 s, extension at 72 ºC for 30 s and a final step of 72 ºC for 20 min. Products were electrophoresed on an ABI Prism 3130 DNA sequencer (Applied Biosystems). Allele sizes were estimated by com-parison with a GenescanTM500 LIZTMinternal size standard (ABI, Foster City, CA) using the ABI programs GENESCAN (version 1.2.2.1) and GENOTYPER (version 1.1). Sanger sequencing was performed in both directions and SNP calls were only made on bases with quality scores higher than Q > 20. The SNPs all fall within the central re-gion of the fragments where sequencing quality is the high-est. In order to ensure accurate genotyping, the samples were repeated if they were homozygous, aberrant stutter patterns or spurious peaks were observed or if the profiles were below the quality score. Differences in mean observed heterozygosity (Ho), mean expected heterozygosity (He) and mean number of alleles was determined as mentioned above.
Parentage assignment was evaluated using the MS and SNP data sets individually and as a combined dataset. The software program Cervus v3.03 (Kalinowski et al., 2007) was implemented for parentage assignment using likelihood. The program uses multilocus parental exclusion probabilities (Selvin, 1980) and pair-wise likelihood to as-sign parent pairs to offspring. Cervus calculates the log-likelihood of each candidate parent being the true parent relative to an arbitrary individual and then calculates the difference between the two most likely parents (Delta,D). Critical values ofDare determined by computer simulation. Using the real data for allele frequencies, simulation pa-rameters were set at 10,000 offspring, with 100% of candi-date parents sampled and a total proportion of loci typed over all individuals of 0.99, mistyping error rates = 0.01 and likelihood calculation error rates = 0.01, permitting two unscored loci. Strict confidence was set to 95% while the relaxed confidence level was 80%.
Results
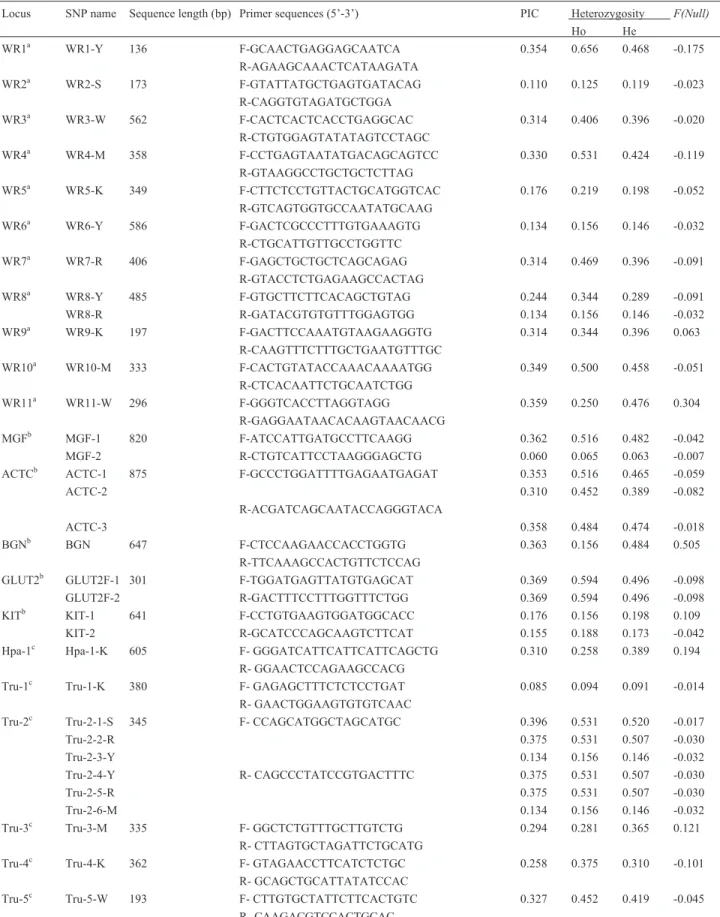
Table 1- Summary statistics for 33 SNPs in White Rhino (Ceratotherium simum). PIC Mean polymorphic information content, F forward primer, R
re-verse primer, bp base pairs, Ho observed heterozygosity, He expected heterozygosity,F(Null)theFscore for the null hypothesis that the locus is in
Hardy-Weinberg Equilibrium.
Locus SNP name Sequence length (bp) Primer sequences (5’-3’) PIC Heterozygosity F(Null)
Ho He
WR1a WR1-Y 136 F-GCAACTGAGGAGCAATCA 0.354 0.656 0.468 -0.175
R-AGAAGCAAACTCATAAGATA
WR2a WR2-S 173 F-GTATTATGCTGAGTGATACAG 0.110 0.125 0.119 -0.023
R-CAGGTGTAGATGCTGGA
WR3a WR3-W 562 F-CACTCACTCACCTGAGGCAC 0.314 0.406 0.396 -0.020
R-CTGTGGAGTATATAGTCCTAGC
WR4a WR4-M 358 F-CCTGAGTAATATGACAGCAGTCC 0.330 0.531 0.424 -0.119
R-GTAAGGCCTGCTGCTCTTAG
WR5a WR5-K 349 F-CTTCTCCTGTTACTGCATGGTCAC 0.176 0.219 0.198 -0.052
R-GTCAGTGGTGCCAATATGCAAG
WR6a WR6-Y 586 F-GACTCGCCCTTTGTGAAAGTG 0.134 0.156 0.146 -0.032
R-CTGCATTGTTGCCTGGTTC
WR7a WR7-R 406 F-GAGCTGCTGCTCAGCAGAG 0.314 0.469 0.396 -0.091
R-GTACCTCTGAGAAGCCACTAG
WR8a WR8-Y 485 F-GTGCTTCTTCACAGCTGTAG 0.244 0.344 0.289 -0.091
WR8-R R-GATACGTGTGTTTGGAGTGG 0.134 0.156 0.146 -0.032
WR9a WR9-K 197 F-GACTTCCAAATGTAAGAAGGTG 0.314 0.344 0.396 0.063
R-CAAGTTTCTTTGCTGAATGTTTGC
WR10a WR10-M 333 F-CACTGTATACCAAACAAAATGG 0.349 0.500 0.458 -0.051
R-CTCACAATTCTGCAATCTGG
WR11a WR11-W 296 F-GGGTCACCTTAGGTAGG 0.359 0.250 0.476 0.304
R-GAGGAATAACACAAGTAACAACG
MGFb MGF-1 820 F-ATCCATTGATGCCTTCAAGG 0.362 0.516 0.482 -0.042
MGF-2 R-CTGTCATTCCTAAGGGAGCTG 0.060 0.065 0.063 -0.007
ACTCb ACTC-1 875 F-GCCCTGGATTTTGAGAATGAGAT 0.353 0.516 0.465 -0.059
ACTC-2 0.310 0.452 0.389 -0.082
R-ACGATCAGCAATACCAGGGTACA
ACTC-3 0.358 0.484 0.474 -0.018
BGNb BGN 647 F-CTCCAAGAACCACCTGGTG 0.363 0.156 0.484 0.505
R-TTCAAAGCCACTGTTCTCCAG
GLUT2b GLUT2F-1 301 F-TGGATGAGTTATGTGAGCAT 0.369 0.594 0.496 -0.098
GLUT2F-2 R-GACTTTCCTTTGGTTTCTGG 0.369 0.594 0.496 -0.098
KITb KIT-1 641 F-CCTGTGAAGTGGATGGCACC 0.176 0.156 0.198 0.109
KIT-2 R-GCATCCCAGCAAGTCTTCAT 0.155 0.188 0.173 -0.042
Hpa-1c Hpa-1-K 605 F- GGGATCATTCATTCATTCAGCTG 0.310 0.258 0.389 0.194
R- GGAACTCCAGAAGCCACG
Tru-1c Tru-1-K 380 F- GAGAGCTTTCTCTCCTGAT 0.085 0.094 0.091 -0.014
R- GAACTGGAAGTGTGTCAAC
Tru-2c Tru-2-1-S 345 F- CCAGCATGGCTAGCATGC 0.396 0.531 0.520 -0.017
Tru-2-2-R 0.375 0.531 0.507 -0.030
Tru-2-3-Y 0.134 0.156 0.146 -0.032
Tru-2-4-Y R- CAGCCCTATCCGTGACTTTC 0.375 0.531 0.507 -0.030
Tru-2-5-R 0.375 0.531 0.507 -0.030
Tru-2-6-M 0.134 0.156 0.146 -0.032
Tru-3c Tru-3-M 335 F- GGCTCTGTTTGCTTGTCTG 0.294 0.281 0.365 0.121
R- CTTAGTGCTAGATTCTGCATG
Tru-4c Tru-4-K 362 F- GTAGAACCTTCATCTCTGC 0.258 0.375 0.310 -0.101
R- GCAGCTGCATTATATCCAC
Tru-5c Tru-5-W 193 F- CTTGTGCTATTCTTCACTGTC 0.327 0.452 0.419 -0.045
R- CAAGACGTCCACTGCAC
ranged from 0.065 to 0.656 and from 0.063 to 0.520, re-spectively. Marked BGN deviated from Hardy-Weinberg equilibrium. Large differences between the observed and expected heterozygosity were also observed for four mark-ers namely: WR1, WR8-Y, WR11 and Tru-3. The observed deviations may be attributed to small sample size. Linkage disequilibrium was observed between markers ACTC-2/ACTC-3, GLUT2F-1/GLUT2F-2 and Tru2-1/Tru2-2/Tru2-4/Tru2-5. Such linkage is not unexpected since these SNPs are in close proximity on the same locus. The nine MS markers, primer sequences and allele frequen-cies for the 32 individuals are listed in Table 2. The PIC ranged from 0.259 to 0.578 with a mean of 0.4282, while observed and expected heterozygosity ranged from 0.273 to 0.654 and from 0.298 to 0.655, respectively. None of the MS loci deviated significantly from Hardy-Weinberg equi-librium and no linkage disequiequi-librium was observed. Only two alleles were observed in four of the markers, while four markers exhibited three alleles and one marker, five alleles, resulting in a mean allele number (Na) of 2.7.
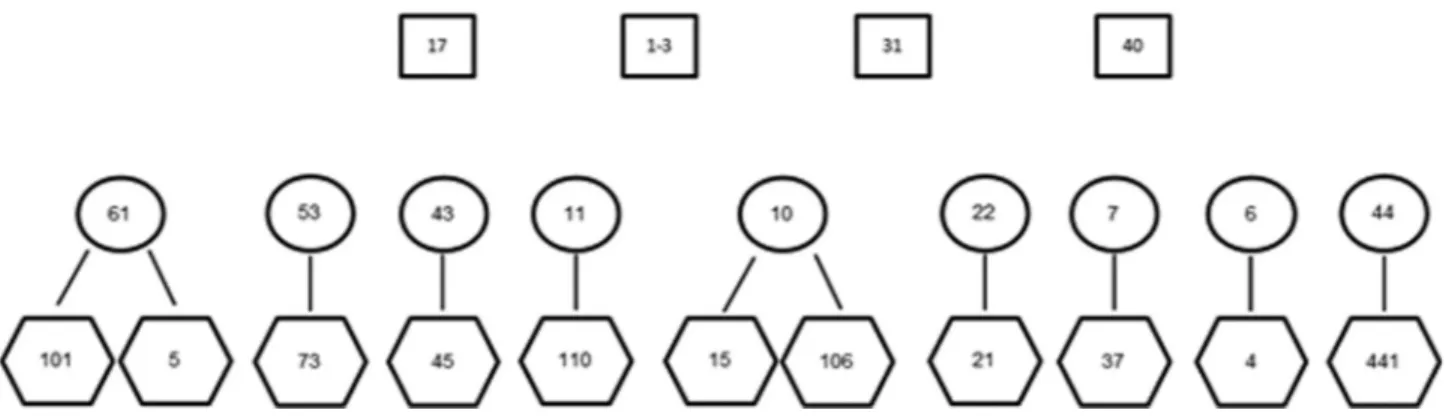
The 32 individuals consisted of 11 known mother/off-spring groups with two mothers having two offmother/off-spring as il-lustrated in Figure 1. There was a further seven juvenile samples, which did not have known mothers in the data set as well as one adult female without any offspring. The data set included four adult male samples presumed from obser-vational data to be the possible paternal candidates for all 11 juvenile samples with known mothers. Parentage analy-sis was conducted with all ten adult females as maternal candidates group, all four adult males as paternal candidate group against all 18 juveniles as offspring set. The sum-mary of parentage assignment for maternal candidates is given in Table 3 and paternal candidates in Table 4. The SNP dataset achieved a combined first parent non-exclusion probability of 0.0889, the MS data set 0.2755 and the combined data sets 0.0153. The combined second par-ent non-exclusion probabilities were 0.0072, 0.0735 and 0.0001 for SNP, MS and combined data sets respectively. Using the SNP data set, all 11 juveniles were correctly
as-signed to their mothers with no pair loci mismatching noted. The MS data set correctly assigned ten out of the 11 parent offspring pairs. No pair loci mismatching was noted in any MS assignments including the wrong assignment of maternal candidate WR-22 to juvenile WR-110. In order to assess the effect of missing MS loci on the assignment of parentage, analysis on the assignment of mothers to a sub-set of samples; WR101 and WR44.1 was conducted. In both cases a reduction of MS loci from nine to five main-tained correct assignment (positive LOD scores), however an absence of three markers resulted in a drop of the pair confidence from 95% to 80%. All 11 juveniles were cor-rectly assigned using the combined data set with ten assign-ments having confidence of 95% and one with 80%.
Using the SNP data set, six paternal allocations could be made with 95% confidence. Using the MS data set, two paternal allocations can be made with 95% confidence and six with 80% confidence. Two of the allocations with posi-tive scores correspond between the two data sets. Paternal allocations on the combined dataset were conducted in two ways; where maternal assignments were fixed and without known mothers. Using the combined data set with un-known mothers, five paternal allocations could be made with 95% confidence (Table 4). In the case of fixed mater-nal assignment, six patermater-nal allocations could be deter-mined with 95% confidence. In this analysis, all allocations determined with unknown mothers remained, however an additional assignment could be made with 95% confidence (WR-17 assigned as the father of WR-5, pair LOD score 2.63). Table 5 includes the parentage assignments when siblings WR-101/WR-5 and WR-15/WR-106 are included in the pool of maternal candidates. Using only SNP data, the correct maternal candidates are assigned to WR-5 and WR-106. WR-5 was wrongly assigned as best maternal candidate for both WR-101 and WR-15. Using only MS data the assignments are correct except for WR-101 which has a higher LOD score than the true mother for WR-106. Using the combined data sets the assignments are all cor-rect with 95% confidence. All other assignments remained as stated in Table 3.
Discussion
Together with the 12 new SNPs identified in this study, 33 SNPs are now available for white rhino (Labuschagneet al., 2013, 2015). The SNPs, were discov-ered through random selection and sequencing of cloned fragments from a SNP enriched library. Ascertainment bias is often a concern when using SNPs in population studies, with bias introduced by heterogeneity in the SNP discovery process, varying sample sizes or differences in sample composition leading to underestimation or overestimation of the frequency of SNPs (Nielsen and Signorovitch, 2003; Clarket al., 2005). Ascertainment of SNPs through discov-ery in particular populations or genomic regions does not bias the results of parentage inference in any way since the parentage analysis is not concerned with the inference of evolutionary history (Anderson and Garza, 2006). In effect, SNP ascertainment leads to an advantage in parentage in-ference, since ascertainment typically leads to an over-representation of intermediate allele frequency SNPs, the type of loci that are most powerful for parentage (Anderson and Garza, 2006). The SNP loci presented here contain ex-tra flanking data to allow for Sanger sequencing. Shorter amplicons may be designed in the future to optimise their utility in degraded DNA samples.
To our knowledge this is the first study to employ SNP and MS markers for parentage analysis in white rhino. The current SNP set outperform the MS set during maternal assignment, where all assignments were correct while the MS data set allocated one maternal sample incorrectly. In general, assignments made with the SNP data set had higher confidence than those with the MS set. Confidence levels increased when combining the two data sets. The in-creased accuracy of the SNP markers in this study over MS markers can be attributed to the greater marker numbers in the SNP data set and low allele numbers of the MS markers. It is apparent that low levels of genetic diversity character-ise white rhino populations and the results from our study (Na=2.7; PIC=0.4282) are consistent with other studies making use of MS markers. Harperet al.(2013) reported Na=2.722 and PIC=0.329 for 367 rhino samples, while Guerieret al.(2012) reported Na=2.72 and PIC=0.357 in a sample set of 31 individuals. Florescu et al. (2003) ob-served higher values, Na=2.8 and PIC=0.4812 in a sample set of 30 individuals, but selected specifically for highly polymorphic loci, which may account for the elevated netic diversity estimates in their data. The low levels of ge-netic diversity observed in white rhinos may be attributed to the small (20-40 individuals) founder population and subsequent bottleneck (Walker and Walker, 2012),
Challenges to parentage assessment can arise when family members other than the parents of the offspring are included in the pool of candidate parents (Jones and Ar-dren, 2003). Inclusion of either half- or full-siblings in the pool of candidate parents may pose the most problematic situations (Jones and Ardren, 2003). In the current study
et
al.
89
SNP MS Combined
Offspring ID Candidate mother ID
Pair loci compared
Pair loci mismatching
Pair LOD score
Candidate mother ID
Pair loci compared
Pair loci mismatching
Pair LOD score
Candidate mother ID
Pair loci compared
Pair loci mismatching
Pair LOD score
WR-5 WR-61 33 0 6.97 (*) WR-61 8 0 0.69 WR-61 41 0 7.66 (*)
WR-61 33 0 6.97 (*) WR-61 8 0 0.69 WR-61 41 0 7.66 (*)
WR-101 WR-61 33 0 4.29 (*) WR-61 9 0 5.76 (*) WR-61 42 0 10.05 (*)
WR-22 33 1 -2.12 WR-61 9 0 5.76 (*) WR-22 42 2 -5.21
WR-73 WR-53 33 0 5.08 (*) WR-53 7 0 0.32 WR-53 40 0 5.43 (*)
WR-53 33 0 5.08 (*) WR-43 7 0 1.90 WR-53 40 0 5.43 (*)
WR-45 WR-43 33 0 6.34 (*) WR-43 8 0 1.25 (+) WR-43 41 0 7.62 (*)
WR-53 33 0 3.92 WR-11 8 0 -0.58 WR-53 41 1 0.21
WR-110 WR-11 33 0 1.81 (*) WR-22 6 0 0.94 WR-11 39 0 0.06 (+)
WR-53 33 1 -1.80 WR-22 6 0 0.94 WR-53 39 1 -2.82
WR-15 WR-7 33 3 -9.02 WR-10 8 0 0.77 WR-10 41 0 4.73 (*)
WR-10 33 0 3.97 (*) WR-10 8 0 0.77 WR-10 41 0 4.73 (*)
WR-106 WR-10 33 0 3.42 (*) WR-10 8 0 1.98 (+) WR-10 41 0 5.40 (*)
WR-10 33 0 3.42 (*) WR-61 9 1 -1.07 WR-10 41 0 5.40 (*)
WR-21 WR-44 33 0 4.61 WR-22 7 0 1.31 WR-22 40 0 7.16 (*)
WR-22 33 0 5.84 (*) WR-22 7 0 1.31 WR-22 40 0 7.16 (*)
WR-37 WR-7 33 0 4.72 (*) WR-7 7 0 2.06 WR-7 40 0 6.80 (*)
WR-7 33 0 4.72 (*) WR-7 7 0 2.06 WR-7 40 0 6.80 (*)
WR-4 WR-6 33 0 4.79 (*) WR-6 7 0 1.10 WR-6 40 0 4.91(*)
WR-11 33 1 -1.48 WR-6 7 0 1.10 WR-43 40 3 -10.37
WR-44.1 WR-44 33 0 5.70 (*) WR-44 9 0 3.94 (*) WR-44 42 0 9.00 (*)
SNP
discovery
in
White
Rhino
SNP MS Combined
Offspring ID Candidate father ID
Pair loci compared
Pair loci mismatching
Pair LOD score
Candidate father ID
Pair loci compared
Pair loci mismatching
Pair LOD score
Candidate father ID
Pair loci compared
Pair loci mismatching
Pair LOD score
WR-5 WR-17 33 1 -0.38 WR-17 8 0 0.32 WR-17 41 1 -0.06
WR-1-3 33 1 -3.93 WR-1-3 8 0 0.95 (+) WR-1-3 41 1 -2.98
WR-101 WR-31 32 0 4.89 (*) WR-31 9 0 -0.67 WR-31 41 0 4.22 (*)
WR-31 32 0 4.89 (*) WR-40 9 1 -5.88 WR-31 41 0 4.22 (*)
WR-73 WR-17 33 1 -1.88 WR-17 7 0 1.08 (+) WR-17 40 1 -0.80
WR-31 32 1 -0.99 WR-31 7 0 0.86 WR-31 39 1 -0.11
WR-45 WR-17 33 0 1.86 (*) WR-17 8 0 1.70 (*) WR-17 41 0 3.57 (*)
WR-17 33 0 1.86 (*) WR-17 8 0 1.70 (*) WR-17 41 0 3.57 (*)
WR-110 WR-31 32 0 6.01 (*) WR-1-3 6 0 -0.02 WR-31 38 0 5.43(*)
WR-31 32 0 6.01 (*) WR-17 9 0 -0.64 WR-31 38 0 5.43(*)
WR-15 WR-17 33 3 -9.91 WR-17 9 0 0.07 (+) WR-17 42 3 -9.84
WR-31 32 3 -15.33 WR-1-3 9 0 -1.43 WR-1-3 42 2 -9.02
WR-106 WR-17 33 1 0.90 (*) WR-40 9 0 0.73 (+) WR-31 41 3 -13.40
WR-31 32 1 -5.71 WR-40 9 0 0.73 (+) WR-17 42 4 -10.45
WR-21 WR-17 33 0 3.63 (*) WR-31 7 0 1.52 (+) WR-17 40 1 -0.45
WR-17 33 0 3.63 (*) WR-40 7 0 0.93 WR-31 39 2 -6.23
WR-37 WR-31 32 0 1.63 WR-31 9 0 0.21 (+) WR-31 39 0 1.86 (*)
WR-1-3 33 0 2.63 (*) WR-40 7 0 -0.37 WR-1-3 40 1 -1.82
WR-4 WR-31 32 1 0.10 WR-31 7 0 1.17 WR-31 39 1 0.34(*)
WR-31 32 1 0.10 WR-40 7 0 0.48 WR-31 39 1 0.34(*)
WR-44.1 WR-17 33 1 -1.73 WR-1-3 9 0 2.36 (*) WR-17 42 1 -2.73
two pairs of siblings were available to evaluate the effect on assignment when included in the parental pool. Inclusion led to some wrong assignments when using the two marker sets separately, but not in the combined data set. It would seem that the combined data set has enough discriminating power for accurate assignment in the current population even when siblings are included in the parental pool, how-ever as relatedness levels increase so should the number of markers. In extremely inbred populations this may reach prohibitive numbers. Further assessment of the utility of these markers over multiple (> three) generations and the incorporation of a larger variety of relationships among in-dividuals (e.g. half-siblings or cousins) as well as a larger set of samples is strongly suggested.
Acknowledgments
We thank the Songimvelo Nature Reserve in South Africa for contributing biological samples.
References
Anderson EC and Garza JC (2006) The power of single nucleotide polymorphisms for large-scale parentage inference. Genet-ics 172:2567-2582.
Brown SM and Houlden BA (1999) Isolation and characterization of microsatellite markers in the black rhinoceros (Diceros bicornis). Mol Ecol 8:1559-1561.
Butler JM, Coble MD and Vollone PM (2007) STRs vs. SNPs: Thoughts on the future of forensic DNA testing. Forensic Sci Med Pathol 3:200-205.
Clark AG, Hubisz MJ, Bustamante CD, Williamson SH and Niel-sen R (2005) Ascertainment bias in studies of human ge-nome-wide polymorphism. Genome Res 15:1496-1502. Cunningham J, Harley EH and O’Ryan C (1999) Isolation and
characterization of microsatellite loci in black rhinoceros (Diceros bicornis). Electrophoresis 20:1778-1780. Emslie RH and Brooks M (1999) African rhino: Status Survey and
Conservation Action Plan. IUCN/ SSC African Rhino Spe-cialist Group, Cambridge, 92 p.
Florescu A, Davila JA, Scott C, Fernando P, Kellners K, Morales JC, Melnick D, Boag PT and van Coeverden de Groot P (2003) Polymorphic microsatellites in white rhinoceros. Mol Ecol Notes 3:344-345.
Glover KA, Hansen MM, Lien S, Als TD, Høyheim B and Skaala Øystein (2010) A comparison of SNP and STR loci for de-lineating population structure and performing individual ge-netic assignment. BMC Genet 11:e2.
Guerier AS, Bishop J, Crawford SJ, Schmidt-Kuentzel A and Stratford KJ (2012) Parentage analysis in a managed free ranging population of southern white rhinoceros: Genetic di-versity, pedigrees and management. Conserv Genet 2012:1-14.
Harper CK, Vermeulen GJ, Clarke AB and De Wet JI (2013) Ex-traction of nuclear DNA from rhinoceros horn and charac-terization of DNA profiling systems for white (Ceratotherium simum) and black (Diceros bicornis) rhi-noceros. Forensic Sci Int Genet 7:428-433.
Hsieh H, Huang L, Tsai L, Kuo Y, Meng H, Linacre A and Lee JC (2003) Special identification of rhinoceros horns using the cytochrome b gene. Forensic Sci Int 136:1-11.
Jones AG and Ardren WR (2003) Methods of parentage analysis in natural populations. Mol Ecol 12:2511-2523.
Kalinowski ST, Taper ML and Marshall TC (2007) Revising how the computer program CERVUS accommodates genotyping error increases success in paternity assignment. Mol Ecol 16:1099-1106.
Labuschagne C, Kotze A, Grobler JP and Dalton DL (2013) A tar-geted gene approach to SNP discovery in the white rhino (Ceratotherium simum). Conserv Genet Resour 5:265-266.
Labuschagne C, Kotze A, Grobler JP and Dalton DL (2015) Endonuclease V digestion for SNP discovery and marker development in South African white rhinoceros (Ceratotherium simum). Conserv Genet Res 7:53-56.
Lowe WH and Allendorf FW (2010) What can genetics tell us about population connectivity? Mol Ecol 19:3038-3051.
Morin PA, Luikart G, Wayne RK and SNP Workshop Group (2004) SNPs in ecology, evolution and conservation. Trends Ecol Evol 19:208-216.
Nielsen R and Signorovitch J (2003) Correcting for ascertainment biases when analyzing SNP data: Applications to the estima-tion of linkage disequilibrium. Theor Popul Biol 63:245-255.
Pertoldi C, Bijlsma R and Loeschcke V (2007) Conservation ge-netics in a globally changing environment: Present prob-lems, paradoxes and future challenges. Biodivers Conserv 16:4147-4163.
Raymond M and Rousset F (1995) GENEPOP (version 1.2): Pop-ulation genetics software for exact tests and ecumenisms. J Hered 86:248-249.
Rohrer GA, Alexander LJ, Keele JW, Smith TP and Beattie CW (1994) A microsatellite linkage map of the porcine genome. Genetics 136:231-244.
Ryynänen HJ and Primmer CR (2006) Single nucleotide polymor-phism (SNP) discovery in duplicated genomes: Intron-primers exon-crossing (IPEC) as a strategy for avoiding am-plification of duplicated loci in Atlantic salmon (Salmo salar) and other salmonid fishes. BMC Genomics 7:e192. Selvin S (1980) Probability of nonpaternity determined by
multi-ple allele codominant systems. Am J Hum Genet 32:276-278.
Smith CT, Baker J, Park L, Seeb LW, Elfstrom C, Abe S and Seeb JE (2005) Characterisation of 13 single nucleotide polymor-phism marker for chum salmon. Mol Ecol Notes 5:259-262. Väli U, Einarsson A, Waits L and Ellegren H (2008) To what
ex-tent do microsatellites markers reflect genome-wide genetic diversity in natural populations? Mol Ecol 17:3808-3817. Walker C and Walker A (2012) The Rhino Keepers. Jacana Media
(Pty) Ltd., Johannesburg, p 1-15.
Internet Resources
Emslie R (2012) The IUCN Red List of Threatened Species. Ver-sion 2014.3, http://www.iucnredlist.org (April 21, 2015).
Associate Editor: Fabrício Rodrigues dos Santos