Francis Molua Mwambo
Case study: The proposed Mount Cameroon National Park
HUMAN AND CLIMATIC CHANGE IMPACT MODELLING ON
THE HABITAT SUITABILITY FOR THE CHIMPANZEE
(
Pan troglodytes ellioti
)
Case study: The proposed Mount Cameroon National Park
Dissertation supervised by
Professor Pedro Cabral, Ph.D
Dissertation co-supervised by
Professor Mario Caetano, Ph.D
Professor Jorge Mateu, Ph.D
Professor Edzer Pebesma, Ph.D
DEDICATION
This thesis has been dedicated back to God Almighty.
The provider of the wisdom, knowledge, understanding and all it took to realise this publication.
ACKNOWLEDGEMENTS
I express my profound gratitude to the following personalities and institutions for their invaluable contributions without which it would have been impossible to pursue the course. These include:
The European Commission; for funding through the Erasmus Mundus Programme, M.Sc. in Geospatial Technologies, Project No. 2007 – 0064.
I remain in debt to my supervisors: Professors Pedro Cabral, Jorge Mateu, Mario Caetano and Edzer Pebesma. I express my heartfelt gratitude to: Profs Marco Painho, Werner Kuhn, Drs. Christoph Brox, Filomena Caria, Maria do Carmo Teixera, Gisela Gracia and Oliver Fernandes for their great assistance on administrative issues
I am grateful for the support I received from Mr. Lawrence Nsoyuni and Mr. Eno Nku Manasseh who provided the data I used in this study. I remain in great debt to the Limbe Botanic Garden - Cameroon and WWF Coastal Forest Progamme Office in Limbe – Cameroon; for the copyright of the land cover and species presence datasets respectively.
I appreciate the immense motivation and support I benefited from my family during the programme. I express my weighty gratitude most especially to the following persons: Anastasia Nalova Mwambo, Doris Bate Mwambo, Doris Eposi Mwambo, Sally Monjoa Mwambo, Peter Engange Mwambo, Emmanuel Njoh Mwambo, Tony-Pierre Engange Mwambo, Emmanuel Molua Mwambo and many others.
I am thankful for the companionship from friends, colleagues and coursemates I met during the programme. My regards to all who assisted me in one way or another but whose names have escaped my mind at moment.
Above all, I acknowledge God Almighty for all He has done.
HUMAN AND CLIMATIC CHANGE IMPACT MODELLING ON
THE HABITAT SUITABILITY FOR THE CHIMPANZEE
(
Pan troglodytes ellioti
)
Case study: The proposed Mount Cameroon National Park
ABSTRACT
KEYWORDS
Chimpanzee subspecies (Pan troglodytes ellioti)
Climate change
Endangered primate species
Habitat suitability
Human impact
Maximum entropy species distribution (maxent) model
Mount Cameroon National Park
ACRONYMS
AUC - Area Under the Curve
CCCMA - Canadian Centre for Climate Modelling and Analysis
CERI - Craighead Environmental Research Institute
CITES - Convention on International Trade in Endangered Species CO2 - Carbon dioxide
DEM - Digital Elevation Model ETM+ - Enhanced Thematic Mapper GHGs - Green House Gases
GIS - Geographic Information Systems GLCF - Global Land Cover Facility GPS - Global Positioning Systems Ha – Alternative hypothesis Ho – Null hypothesis
IPCC -Intergovernmental Panel on Climate Change
IUCN - International Union for the Conservation of Nature LBG - Limbe Botanic Garden; Cameroon
Maxent - Maximum Entropy Distribution Model
Maxent-T - Maximum Entropy Distribution Model-Threshold MCNP - Mount Cameroon National Park
MINEF - Ministry of Environment and Forestry; Cameroon
Mt. Cameroon - Mount Cameroon Mt. Etinde - Mount Etinde
Mt. Fako - Mount Fako
ROC - Receiver Operating Characteristic RS - Remote Sensing
TABLE OF CONTENTS
ACKNOWLEDGEMENTS ... iv
ABSTRACT... v
KEYWORDS ... vi
ACRONYMS ... vii
INDEX OF TABLES ... x
INDEX OF FIGURES ... xi
1. INTRODUCTION ... 1
1.1 Problem statement... 1
1.2 Aim and objective of the study ... 5
1.3 Research questions and hypothesis ... 6
1.4 Structure of the thesis ... 7
2. BIOGEOGRAPHY OF THE AFRICAN CHIMPANZEE ... 9
2.1 Basic terminologies ... 9
2.2 Spatial distribution of chimpanzees in Africa ... 10
2.3 The study area: the proposed Mount Cameroon National Park ... 13
2.4 Endemism of the Mount Fako area ... 15
2.5 The taxonomy of the chimpanzees on Mount Fako ... 17
3. MATERIALS and METHODS ... 19
3.1 Materials ... 19
3.1.1 Data on species occurrence ... 19
3.1.2 Data on local human activities ... 20
3.1.3 Environmental data ... 20
3.1.4 The land cover /use of the study area ... 21
3.2 Methods ... 23
3.2.1 Models for species distribution ... 23
4. RESULTS and DISSCUSSION... 29
4.1 Variable importance ... 29
4.2 Predicted habitat suitability based on current climate (1950-2000) ... 33
4.3 Predicted habitat suitability based on future climate (2001-2050) ... 35
4.3.1 Based on b2a modelled scenario ... 35
4.3.2 Based on a2a modelled scenario ... 36
4.4 Accuracy assessment of predicted result ... 46
4.5 Modelled human activities ... 46
5. CONCLUSIONS ... 49
5.1 Conclusions... 49
5.2 Limitations ... 51
5.3 Recommendations ... 51
BIBLIOGRAPHIC REFERENCES ... 53
APPENDICES ... 66
1 Response curves ... 67
INDEX OF TABLES
Table 1: Taxonomic ranking of the chimpanzee subspecies in the study area ... 18
Table 2: Environmental layers used in the model... 19
Table 3: signs depicting local human activities ... 20
Table 4: Software used in the study ... 28
Table 5: selected key variables for the model... 29
Table 6: Land cover classes with high habitat suitability ... 32
Table 7: Variables and their percentage contribution ... 33
Table 8: Variables and their percentage contribution ... 35
Table 9: Variables and their percentage contribution ... 36
Table 10: The summary statistics for the different scenarios ... 37
INDEX OF FIGURES
Figure 1: Classification for biodiversity conservation status by the IUCN (IUCN 2001) 2
Figure 2: Structure of the thesis ... 8
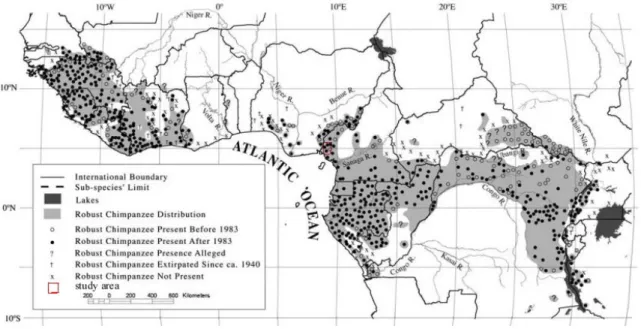
Figure 3: The spatial distribution of chimpanzees in Africa over time. ... 12
Figure 4: The biogeograhic habitats of chimpanzees in Africa ... 12
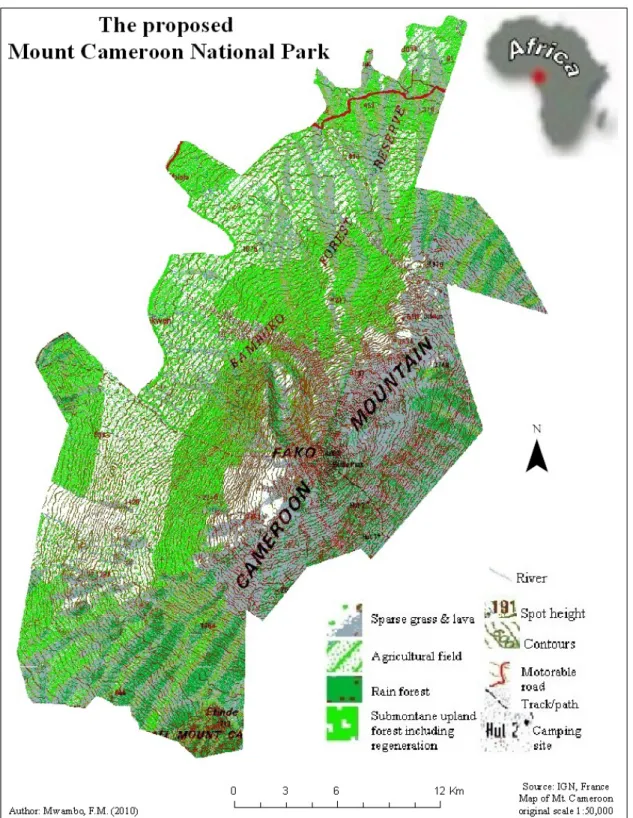
Figure 5: The study area; the proposed MCNP located on Mt. Fako ... 14
Figure 6: The endemism of the Mount Cameroon region in Africa. ... 16
Figure 7: The land cover/use map of the proposed MCNP ... 22
Figure 8: The flowchart of the methodology ... 28
Figure 9: Response curve for altitude ... 30
Figure 10: Response curve for slope... 31
Figure 11: Response curve for the land cover type ... 31
Figure 12: Jackknife of regularised training gain using all variables ... 32
Figure 13: Jackknife of the regularised training gain under the current scenario ... 33
Figure 14: The habitat suitability based on the current climate scenario ... 34
Figure 15: Jackknife of the regularised training gain under the b2a climate scenario ... 35
Figure 16: Jackknife of the regularised training gain under the a2a climate scenario ... 36
Figure 17: The habitat suitability based on the b2a climate scenario ... 38
Figure 18: The habitat suitability based on the a2a climate scenario ... 39
Figure 19: Predicted changes in suitability from current to b2a scenario ... 41
Figure 20: Predicted changes in suitability from current to a2a scenario ... 42
Figure 21: Overlay of points on predicted suitability under the current scenario ... 43
Figure 22: An illustration of shift in predicted suitability under the b2a scenario ... 44
Figure 23: An illustration of shift in predicted suitability under the a2a scenario ... 45
Figure 24: Local human activities modelled as points on the land cover ... 47
1. INTRODUCTION
1.1
Problem statement
Empirical evidence from available sources suggest that many African primate species are increasingly being threatened by anthropogenic actions which basically include deforestation, the hunt for fauna species as meat (commonly referred to as bush meat), diseases among species, habitat destruction and climate change (Chapman 2006). What used to be the nature and magnitude of threats to wildlife decades ago are likely not the same today. Even where threats seem to have remained unchanged, external anthropogenic factors from diverse sources and forms have in many cases accelerated and aggravated the threats to biodiversity and nature as a whole. It is currently estimated that not more than 5,000-10,000 Cameroon - Nigeria trans-boundary chimpanzee individuals remain in the wild and these are separated into increasingly fragmented sub-populations throughout much of their former range (Pilbrow et al., 2006). The population of the robust chimpanzee (Pan troglodytes) including other species of apes in the wild is on a rapid decline across tropical Africa; caused by diseases and human activities that adversely impact the habitats occupied by these species (Huijbregts et al., 2003, Leroy et al., 2004, Walsh et al., 2003, Morgan et al., 2006). Even though the Cameroon - Nigeria trans-boarder chimpanzees have been noted to be peculiar and
density estimates for most Central African forests (Butynski 2001, Oates 1996, Teleki 1989). And even where such estimates exist, there are criticism on the survey methods as being biased or limited in their ability to detect trends and the lack of casual interference (Oates 2006, Plumptre 2000). The salient veracity is that Pan troglodytes ellioti has both the least geographic distribution and population size relative to the other chimpanzee subspecies across the Continent (Oates et al., 2007 in IUCN 2008, Oates et al., 2008 in IUCN 2009). Population estimate for the subspecies figures about 6,500 individuals in the wild. The situation is even worsened by the declining population (Oates et al., 2008, IUCN 2009) which is under growing pressure from human activities.
Figure 1: Classification for biodiversity conservation status by the IUCN (IUCN 2001)
Local anthropogenic disturbances are diverse and take various forms: hunting –for meat; forest clearing -for agriculture leading to habitat fragmentation and destruction; logging -for commercial timber; poaching, illegal commercial trade and smuggle of the species in to zoos and laboratories -even though the convention on international trade in endangered species (CITES) has banned the trade on Pan troglodytes ellioti and other related species. The collection of wild honey (a supplement for the species’ diet) by locals also adds to the several odds faced by the species in the wild. Occasional wild bush fires also contribute to the threats. Encroaching agricultural activities turn to shrink
cartridge shells which were indicative of hunting activities, tree cuts which were indications of wood collection, and stripped bark (mostly from Prunus africana) indicating medicinal extracts for commercial purposes. Human activities are the most impacting of all the disturbances that interact with the proposed Mount Cameroon National Park (MCNP). The natural disturbances that occasionally hit the region range from volcanic eruptions, earth quakes and other seismic activities. These are less impacting and wildlife can quickly adapt or recover from their effects since they are occasional unlike the persistent activities from humans.
Following the ecological niche theory; a species depend on the existence of a specific set of environmental conditions for its long-term survival (Hutchinson 1957). These environmental conditions are composed of both biotic and abiotic components. The former may be other organisms with which the species may have relationships such as: trophic, symbiotic, parasitic or simply other forms of ecosystem services. Abiotic components include other non-living environmental conditions including climate. There are growing evidences to support the climate change phenomenon. Global warming exerts a remote threat to wildlife. There is no doubt about the considerable efforts that
have been devoted to draw the world’s attention to the rising mean global temperatures and changing climate (IPCC 1992, Lugina et al., 2004, Kattenberg et al., 1996, Jones and Moberg 2003, Gates 1993). A number of studies carried around the world have scientifically proven the reality of the phenomenon through the use of ice cores, pollen cores, coral samples and growth phases in tree ringing (Parmesan 2006, Benson et al., 2002, LaMarche 1973, Beever et al., 2005, Mayewski et al., 2004). There is a growing
essential this study may be for the conservation of chimpanzees in the proposed MCNP. This study seems timely following the strong indications for a warming climate.
According to Purves et al., (2000) who demonstrated that geographical range size is
significantly associated with high extinction risk in declining species coupled with
studies on the rarity of species by Gaston (1994); Pan troglodytes ellioti faces greater risks of becoming vulnerable to the threats of climate change. Such threats from remote sources could be difficult to identify or even to visualise except through modelling. This further underscores the importance of this study and the need for greater integration of geospatial techniques in to biodiversity conservation and wildlife management to halt the incessantly growing local and global threats whose action are gradual but persistent towards impounding on the nature around us. We may better plan for conservation needs following possible and meaningful predictions.
1.2
Aim and objective of the study
McDonald and Brown (1992) who modelled for the extinction of species following global warming using montane mammals in the Great Basin. The results of their study showed that 14 mammal species are likely to become extinct in the 21st century. However, these results have been argued by Skraggs and Boecklen (1996) for empirical reasons. Dundar (1998) carried out a study on the impact of global warming on the survival and conservation of gelada baboon (Theropithecus gelada) a medium-sized African primate species on the Ethiopian Highlands. A systems model of the gelada behavioural ecology earlier developed (Dunbar 1992a) was used. The results of the study revealed that the gelada baboons are likely to be confined to high altitude areas in the phase of a global warming condition. Under such confinement, the possibilities for
the species’ survival will be greatly narrowed.
The aim of this study is to investigate how climate change including other local anthropogenic activities carried within and around the proposed MCNP may affect the habitat suitability for Pan troglodytes ellioti. The principal objective is for biodiversity conservation and wildlife management purposes.
1.3
Research questions and hypothesis
This research shall attempt to provide answers to the following questions:
What are the environmental variables most sensitive to predictions on habitat suitability for Pan troglodytes ellioti on Mount Fako?
Where are the suitable habitats for Pan troglodytes ellioti on Mount Fako?
Do human activities overlap with the suitable habitats for the species, and if so; to what extent?
Has climate change any effect on the habitat suitability for Pan troglodytes ellioti
on Mount Fako?
Ho: All the environmental variables have the same sensitivity on the predicted habitat
suitability for P. t. ellioti on Mount Fako.
Ha: Some environmental variables have greater sensitivity on the predicted habitat
suitability for P. t. ellioti on Mount Fako.
Ho: There is no suitable habitat for P. t. ellioti in the study area.
Ha: There is a suitable habitat range for P. t. ellioti in the study area.
Ho: There is no overlap between human activities and the suitable habitat for P. t. ellioti
in the study area.
Ha: There is an overlap between human activities and the suitable habitat for P. t. ellioti
in the study area.
Ho: Climate change has no effect on the suitable habitat for P. t. ellioti on Mount Fako.
Ha: Climate change has an effect on the suitable habitat for P. t. ellioti on Mount Fako.
1.4
Structure of the thesis
This dissertation is entirely composed of five interrelated chapters which are structured as shown in Figure 2. Below is a succinct presentation of the structure:
1
The study is introduced to the reader in order to draw her/her attention to grasp all that follows. Here, the problems and threats to Pan troglodytes ellioti are identified and raised. The aim of this study including the research questions are defined and the hypotheses are formulated.
2
The study area is presented. A presentation of spatial distribution of the species in the African Continent and the taxonomy are briefly examined.
3
4
This is the core of paramount interest in this study. The key variables are selected, the model is run and predictions made. The output is analysed. An explanation of the results is given in terms of the observed trends in suitability in relation to the human induced climate change.
5
The study closes with a recap. The hypotheses earlier raised in 1 are validated based on the results obtained in 4. Limitations to the study are highlight. Suggested recommendations that might be useful to other scholars or the management of the MCNP (if deemed necessary) are made.
2. BIOGEOGRAPHY OF THE AFRICAN CHIMPANZEE
2.1 Basic terminologies
Various authors have attempted the definition of the term ―habitat‖ as applied to ecology. The habitat of a species has been recognised as a fundamental concept in ecology, wildlife management and distribution (Corsi et al., 2000). For instance, a habitat could be defined as the locality where a plant or animal naturally grows or lives no matter how briefly or as actual or potential environment where a species lives (de Leeuw et al., 2006,). Furthermore, Corsi et al., (2000) attempted to give a classification of the term as whether it relates to a species, community, land, geographic location or environmental space. Based on the above definitions, habitat is commonly considered a property of the species under consideration (de Leeuw et al., 2002). According to Corsi
et al., (2000) a habitat could be seen as a species related concept (that is, the environmental description of where a species lives) or a land related concept (that is, a description of the occurrence of a species). The latter use developed with habitat mapping wherein the term habitat refers to homogenous land units or suitable land for wildlife. In this case, the habitat suitability index model or habitat suitability map; where these maps refer to land units and not species (Corsi et al., 2000, de Leeuw et al., 2002). However, the use of the term following this approach introduces an ambiguity. Thus, all
land should be considered habitat otherwise unsuitable land could be considered ―non habitat‖. Finally, to avoid the contradictory use of the term ―habitat‖ in our study, this term is restricted to the occurrence of a specific biota and in this case the chimpanzee subspecies; Pan troglodytes ellioti, within the study area.
realised niche. In other words, sampling is limited to the realised niche. Therefore, predicted results in real terms may underestimate the actual potential distribution (Phillips et al., 2006).
2.2 Spatial distribution of chimpanzees in Africa
Throughout the dim vistas of geologic time, tropical rainforests in Africa have expanded and contracted by shifting their biogeographic boundaries. Alterations in palaeo-climates have often been responsible for these shifts. Palaeo-environments and their climatic conditions have been reconstructed through the study of pollen and spores from a deep sea cores such as the one located west of the Niger delta. This revealed that the West African rainforest from Guinea stretched uninterruptedly to Congo through Mount Fako during the last interglacial and early Holocene (Dupont and Weinelt 1996). This Guineo-Congolian rainforest became disjointed by the present day Dahomey Gap in Togo and Benin during the glacial stages of 6, 4, 3 and 2. However, the extension of the gap can not be attributed to climatic changes alone (Dupont and Weinelt 1996). This strongly suggests that the possibility of induced human activities can not be completely ruled out.
According to the ―refugia‖ theory, present day biotas in the tropics have originated from ―ecological islands‖ otherwise referred to as ―refugia‖ or ―refuges‖ which resulted from
cycles of forest fragmentation and subsequent expansion (Hamilton 1976, Livingstone 1975, Coetzee 1964, Bonnifille and Riolet 1988, van Zinderen Bakker and Coetzee 1972). According to biogeographic theory, chimpanzees were restricted to localised refugia during periods of minimal forest cover (Goldberg 1996). Subsequently, these chimpanzees dispersed outwards from these refugia when forests re-expanded during post glacial climatic conditions (Goldberg 1996).
The robust chimpanzee; scientifically referred known as Pan troglodytes (Blumenbach 1775), literally meaning ―cave dwellers‖ in Greek; are the most widely spread primate
used to be the tropical rainforest that stretched across the continent from west to east along the equatorial belt spanning from Sierra Leone to Tanzania. Taxonomic subdivisions among the species are mainly based on genetic attributes, morphological differences, behavioural aspects and geographical distribution. The western most subspecies; Pan troglodytes verus, has its biogeographic range stretching from Senegal to Nigeria (Schwarz 1934) but interrupted by the Dahomey gap in Togo; where the subspecies is presumed to be extinct (IUCN 2006, IUCN 2008). The west bank of River Niger in Nigeria demarcates the subspecies’ eastern most geographic barrier (Schwarz 1934). Pan troglodytes ellioti (Matschie 1914, Matschie 1919) which was initially confused to be Pan troglodytes vellerosus in earlier publications (Gray 1862) occupies the biogeographic range that starts from the lower east bank of River Niger in Nigeria to north west of River Sanaga in Cameroon (Oates et al., 2009). Dental studies carried out by Pilbrow et al., (2006) on the skull remains form all the subspecies distinguished Pan troglodytes ellioti as a distinct subspecies from the rest. Hu et al., (2001) also found this subspecies to be distinct and not merged with the others in the continent. While the biogeographic range of Pan troglodytes troglodytes occupies the central African region that spans from south of River Sanaga to the Congo and Ubangi Rivers in the Democratic Republic of Congo and Central African Republic respectively (Blumenbach 1799). Pan troglodytes schweinfurthii has its biogeographic range from the Congo and Ubangi Rivers in the Democratic Republic of Congo and the Central African Republic respectively to western Uganda, Rwanda and Tanzania (Giglioli 1872). This subspecies occupies two habitats; medium to high altitude forest (Goldberg 1996). Noack (1887)
Figure 3: The spatial distribution of chimpanzees in Africa over time.
Source: Adapted from Oates (2006) after Butynski (2003), who provides a full list of sources)
Figure 4: The biogeograhic habitats of chimpanzees in Africa Source: http://www.vellerosus.org/site/history.shtml
depth review of related literature has settled the score and salvaged us from the doubts and confusion on the nomenclature as the former over writes the latter. Thus, the chimpanzee subspecies on Mt. Fako is Pan troglodytes ellioti (Matschie 1914, Matschie 1919, Oates 2009). Geographic barriers have restricted subspecies in their respective biogeographic habitats and this has succeeded in preventing gene flow across these barriers. The restrictions of gene flow across such barriers have led to each subspecies developing typical genetic compositions which are responsible for the respective phenotypic characters. For instance, Pan troglodytes schweinfyrthii has longer hair compared to its counterparts and has bronze or copper facial skin. While Pan troglodytes troglodytes has a black facial skin. The western most Pan troglodytes versus has pinkish facial skin that tends to darken as the chimpanzee ages (IUCN 2008).
A proper understating of a species’ biogeography is important for addressing conservation issues. Biogeography reveals the geographical features that may act as barriers to restrict the expansion of species beyond biogeographic zones. The confinement of species within a biogeographic area limits the possibility of gene flow and this makes the species more liable to greater vulnerability of extinction risks should the species be threatened within a particular habitat. As a consequence of biogeographic barrier, many African primates face greater extinction risks (Eeley and Lawes 1999, Lawes and Eeley 2000).
2.3 The study area: the proposed Mount Cameroon National Park
The study area shown on Figure 5 is the proposed Mount Cameroon National Park (MCNP). It is located on Mount Fako and Etinde commonly referred to as Mount Cameroon. The study area is bounded by the following pairs of geographic coordinates;
longitudes 9°0.6’ and 9°18’ east of the Greenwich; latitudes 4°27’ and 4°3’ north of the
2.4 Endemism of the Mount Fako area
The studies of variation in the abundance within a species’ geographic range define the
link between the disciplines of ecology, geostatistics and biogeography. Empirical studies of various taxonomic groups show that the density of a given species is unevenly
distributed in space, with few ―hotspots‖ and many ―coldspots‖ where abundance is
order of magnitudes lower (Brown et al., 1995). An explanation for such observed pattern is the spatial variation in habitat suitability. That is, the variation in density is
developed by how closely sites correspond to a species’ niche (Brown et al., 1995). At a global scale; as early as 1983, Whites (1983) in his phytogeographic framework had identified the Mt. Fako area as part of the afromontane archipelago-like regional centre of endemism. This region which constitutes part of the Guinean Forest of West Africa biodiversity hotspot was again identified as one of the world’s 10 biodiversity hotspots (Myers 1988) and still featured the list in the revisited version in which the number increased to 18 (Myers 1990). The latter still features as one of the world’s biodiversity hotspots composed of all ecosystem types which currently number well over 25 (Myers 2003, Myers et al., 2000, Mittermeier et al., 1999). Continent wide, Cameroon is often
described as ―Africa in miniature‖. The reasons being: though the national territory
Figure 6: The endemism of the Mount Cameroon region in Africa.
Source: Adapted from Chapman (2006)
Within the national territory, the Cameroon – Nigeria trans-boarder area; other wise referred to as the ―Mount Cameroon region‖ represents an area of high biological species diversity and endemism (Forboseh et al., 2007, Cable et al., 1998, Kingdon 1989, Sayer et al., 1992). According to the ―refugia‖ theory, which postulates that present day biotas in the tropics have originated from ―ecological islands‖ or ―refugia‖ which in turn resulted from cycles of forest fragmentation and subsequent expansion (Hamilton 1976, Livingstone 1975, Coetzee 1964, Bonnifille and Riolet 1988, van Zinderen Bakker and Coetzee 1972). The area around Mt. Fako is one of such
Pleistocene biogeographic ―refugia‖ of endemism in the Central African region. It is the
The area around Mt. Fako is endoured with a fascinating array of both floral and faunal species. The exceptionally high species richness and endemism is an attribute of the wide altitudinal range which rises from sea level to a majestic height of 4100m a.s.l. This altitudinal interval provides a great variety of habitats with differing micro-climatic conditions under which different species favourably flourish. The region is biogeographically unique to both west and central Africa. New species are increasingly being discovered and identified from the area (Cheek et al., 2000, Læssøe et al., 2002, Roberts 2003). These are some proofs to highlight the ecoregion’s biological richness in terms of species diversity. The fact that new species are still being discovered even lately (Cheek et al., 2000, Læssøe et al., 2002, Roberts 2003) perhaps, one may be tempted to conclude that the region has not been fully explored for its potential floristic and faunistic checklists. Thus, the need to support conservation efforts in the region is of utmost importance.
2.5 The taxonomy of the chimpanzees on Mount Fako
Taxonomic rank
Taxonomic name Reference
Domain Eukaryota Whittaker & Margulis,1978 Kingdom Animalia Linnaeus, 1758
Subkingdom Balateria Hatschek, 1888) Cavalier-Smith, 1983 Branch Deuterostomia Grobben, 1908
Infrakingdom Chordonia Haeckel, 1874; Cavalier-Smith, 1998 Phylum Chordata Bateson, 1885
Subphylum Vertebrata Cuvier, 1812
Infraphylum Gnathostomata Auct. - Jawed Vertebrates Superclass Tetrapoda Goodrich, 1930
Class Mammalia Linnaeus, 1758 - Mammals Subclass Theriiformes Rowe, 1988; Mckenna & Bell, 1997 Infraclass Holotheria Wible et al.,1995; Mckenna & Bell, 1997 Superlegion Trechnotheria Mckenna, 1975
Legion Cladotheria Mckenna, 1975 Sublegion Zatheria Mckenna, 1975
Infralegion Tribosphenida Mckenna, 1975; Mckenna & Bell, 1997 Supercohort Theria Parker & Haswell, 1897; Mckenna & Bell, 1997 Cohort Placentalia Owen, 1837; Mckenna & Bell, 1997
Magnorder Epitheria Mckenna, 1975; Mckenna & Bell, 1997
Superorder Preptotheria Mckenna, 1975; Mckenna, in Stucky & Mckenna, in Benton (Ed.) 1993
Grandorder Archonta Gregory, 1910; Mckenna, 1975 Order Primates Linnaeus, 1758
Suborder Haplorrhini Pocock, 1918 Infraorder Simiiformes Haeckel, 1866
Parvorder Catarrhini Geoffroy Saint-Hilaire, 1812
Superfamily Hominoidea Gray, 1825; Gregory & Hellman, 1923 Family Hominidae Gray, 1825
Genus Pan Oken, 1816 Specific name troglodytes Blumenbach, 1775 Subspecies ellioti Matschie, 1914 Scientific name Pan troglodytes ellioti Matschie, 1914
Table 1: Taxonomic ranking of the chimpanzee subspecies in the study area Source: http://zipcodezoo.com/Animals/P/Pan_troglodytes/ and
3. MATERIALS and METHODS
3.1 Materials
The collection of data was closely followed by the processing phase. These included simple tasks (for instance saving the samples data in .CSV format) to complex tasks (for instance the correction of the missing elevation values and the image processing prior to the land cover /use classification). The originally downloaded digital elevation model (DEM) had some missing elevation values. The problem was rectified as follows. Firstly, the DEM was vectorised. Missing elevation values were then computed by averaging the nearest surrounding pixels values. The corrected DEM was then rasterised as a grid. The shape file of the proposed MCNP (on geographic projection) was used to clip the environmental layers and the DEM serving as the mask. The essence was to have all the data layers to be of both the same geographic projection and dimensions for acceptance and compatibility with the model. Table 2 shows the environmental layers used as input data in the model. Besides the altitude which was directly downloaded from worldclim, the slope and aspect were derived from the DEM using ArcGIS software.
Variable Unit Source Proxy
Elevation meter DEM food availability, human activity, health risks Slope degrees DEM food, nesting place
Aspect degree DEM nesting, food
Precipitation mm/year worldclim food, species activity pattern, seasonality Minimum
temperature
°C worldclim species activity, health
Maximum temperature
°C worldclim species activity, seasonality
Average temperature
°C worldclim species activity, seasonality
Land cover type Category supervised & unsupervised classification of Landsat images of study area
food quality, availability, nesting & shelter
Table 2: Environmental layers used in the model
3.1.1 Data on species occurrence
Programme Office, Limbe - Cameroon. The spatial locations of chimpanzee nests were obtained using the global positioning systems (GPS) receiver. Surveys were done along transect lines. The exercise was conducted between September 2006 and January 2007. During this period, 59 nests were recorded. The data is constituted of the following attribute fields: date, transect, species name, group size, transect length, perpendicular distance, nest type, nest height and nest age. The age was given in descriptive terms; fresh, recent and old corresponding to progressive stages in the decay process of nests respectively. During the course of collecting the data, some signs of human activities were equally recorded as shown in Table 3.
3.1.2 Data on local human activities
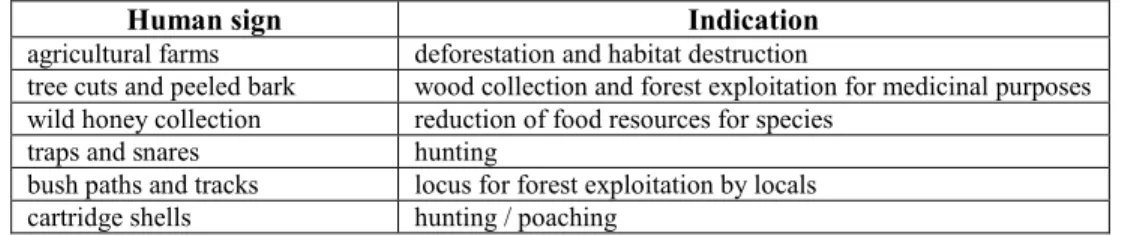
The human signs that were encountered during the course of collecting the data on the species are shown in Table 3.
Human sign Indication
agricultural farms deforestation and habitat destruction
tree cuts and peeled bark wood collection and forest exploitation for medicinal purposes wild honey collection reduction of food resources for species
traps and snares hunting
bush paths and tracks locus for forest exploitation by locals cartridge shells hunting / poaching
Table 3: signs depicting local human activities
3.1.3 Environmental data
current climatic conditions. While the data modelled by the Canadian Centre for Climate Modelling and Analysis (CCCMA) for next 50 years (2001-2050) was considered to give the likely future climatic conditions, with two scenarios under consideration. These are the a2a and the b2a. Based on the current expulsion rates of green house gases, (GHGs) chiefly Carbon Dioxide (CO2); the former scenario is a medium-high emission
rate which assumes that the CO2 concentration in the atmosphere shall be doubled by
2050 while the latter scenario assumes that the climate will remain relatively unchanged during the next half century.
3.1.4 The land cover /use of the study area
3.2 Methods
3.2.1 Models for species distribution
Presently, there exist an overwhelming plethora of methods for predicting species’ geographic distribution (Elith et al., 2006). With such a wide spectrum, choice depends on the strengths and weaknesses of one method over others or either a function of the nature of the species’ occurrence data or based on the objective for the prediction. Such objectives could be to investigate the relationship between an environmental parameter
and the species’ richness (Mac Nally and Fleishman 2004); the spatial characteristics that may allow for species to flourish in a particular geographic space (Araujo and Williams 2000, Scotts and Drielsma 2003, Ferrier et al., 2002a); the invasive potentials of alien species to colonise non-native geographical locations (Goolsby 2004, Peterson 2003); ecological and geographical differentiation of closely related species (Graham et al. 2004b); species distribution history (Hugall et al., 2002); for casting a species geographic distribution in the future based on modelled climatic conditions (Araujo et al., 2004, Skov and Svenning 2004,). The problem of errors and uncertainties are almost ubiquitous and unavoidable in all predictive models. An understanding of the source, magnitude and pattern of these errors is essential if the models are to be used transparently in decision making (Barry et al., 2006). Besides the limitations of accuracy, precision and uncertainties is also the problem of sparsely occurrence data on species (Elith et al., 2006); a commonly encountered situation in the field which reduces the practicability of using most dataset in some models. The predictive formulation of
species’ distribution is based on abundance of species in relation to an environmental
predictor. In other words, species abundance is a function of some environmental predictors. Empirical studies of various taxonomic groups show that the density of a
given species is unevenly distributed in space, with few ―hotspots‖ and many ―coldspots‖ where abundance is order of magnitudes lower (Brown et al., 1995). An explanation for such observed pattern is the spatial variation in habitat suitability. In other words, the variation in density is developed by how closely sites correspond to a
Initial methods of species predictive distribution were built on the bases of ―presence
only‖ data. They often focused on distances-based measurements (Busby 1991). Later
methods then adapted to a ―presence-absence‖ approach wherein the ―presence-only‖ data was modelled against a background that was randomly sampled. This approach was
binomial in the sense that both the ―presence-only‖ data along side a false background were modelled (Ferrier et al., 2002a, Keating and Cherry 2004). Unlike in the past, there has been an increase in the use of remotely sensed environmental layers (Turner et al.,
2003) and sophisticated interpolation of climatic data in species’ distribution modelling
nowadays (Thornton et al., 1997). Also with the passage of time, the human-computer interaction has increased and there has been improvement both in terms of computing power and spatial technology. As a result, modern methods of species predictive
distribution have appeared on the horizon. These are basically ―machine learning‖
methods that have better integrated the fundamentals of both ecology and statistics in the modelling approach (Phillips et al., 2006, Elith et al., 2006). So far, two principal
―machine learning‖ methods namely the maximum entropy distribution models
(otherwise referred to as Maxent and Maxent-T) and the boosted regression tree also referred to as stochastic gradient boosting have been developed (Phillips et al., 2006, Elith et al., 2006). To differentiate the two basically: boosted tree regression combines two algorithms; the boosting algorithm which interactively combines trees. It is often preferred because of its capability in selecting variables and is also good at modelling interactions (Elith et al., 2006). While maximum entropy employs a ―presence-only‖ data approach (Phillips et al., 2006, Elith et al., 2006). The two sub-models of the latter are Maxent and Maxent-T (that is, Maxent with threshold). However, most attention shall be directed to Maxent since it makes the pivotal model of this study.
3.2.2 The maximum entropy distribution model (MaxEnt)
In this study, the maximum entropy species distribution model; Maxent (version 3.3.1)
was used as a statistical model. Maxent is a ―machine learning‖ method and is based on
estimating the probability of maximum entropy. That is, the algorithm includes as many
―options‖ as possible into the probability distribution while there is simultaneous exclusion of all ―options‖ known to be outside the target distribution as specified by certain constraints. The modelling process in Maxent is iterative and begins with an assumption of a uniform probability (Phillips et al., 2004, Dudík et al., 2004, Phillips et al., 2004). Following studies on predictive distribution of species on terrestrial environments, Maxent is by far preferred. For instance, a comparative study of 16 models by Elith et al., (2006) ranked Maxent as the top most for predicting species distribution on a terrestrial environment. Kayijamahe (2008) used variables that were related to the land cover type, climatic and topographic data in Maxent and GARP to model for the biophysical habitat suitability for gorilla (Gorilla beringei beringei) on the Virunga volcanic peaks. His results proved that Maxent out performed GARP. Much of the strengths of Maxent lay on the ease with which results could be interpreted by humans. Models generated have a natural probabilistic interpretation which gives a smooth gradation ranging from least to most suitable conditions. In Maxent, constraints
are quantified as ―features‖ and they represent few characteristics known about the target distribution. The features and their corresponding weights get updated; the ―gain‖
equally increases exponentially at suitable locations to maximum attained value.
―Regularisation‖ helps in reducing the gain in other to avoid overfitting of the model.
The higher the regularisation the wider the corresponding predicted distribution. Maxent accepts both continuous and categorical dataset. Outputs are continuous. The jackknife gives the relative importance of each contributing variable to the model (Phillips et al., 2004, Dudík et al., 2004, Phillips et al., 2006).
3.2.3 Modelling for the habitat suitability
imported into ArcGIS (version 9.3) where the analyses were done. The prime interest of this study was not to compare the results on species predictive distribution using Maxent to results obtained from other models. Rather our interest is placed on the singular use of maxent to investigate the impact climate change may have on the suitability of the habitat, on the assumption that the maxent model ranks relatively high compared to other models in terms of predicting species distribution on terrestrial biomes. Appraisals
on the model’s strength on prediction have been cited in a number of publications which include: (Elith et al., 2006, Kayijamahe 2008) who compared prediction results from more than one model; (Kumar and Stohlgren 2009, Boubli and de Lima 2009) who uniquely used the model for predicting species distribution without a control model for comparison and concluded that predicted results were satisfactorily of high success. The choice for maxent as a statistical model in the methodology of this study was buttressed by the following facets: the relatively low sensitivity to noise, the relatively small sample size, its capability of accepting both categorical and continuous datasets, ability to model iterations and lastly supported by successes recorded in historic studies in which maxent was used for modelling (Elith et al., 2006, Hernandez et al., 2006, García Márquez, 2006, Herkt 2007, Kayijamahe 2008). These earlier success appraisals on the strengths of maxent contributed to the impetus for our singular choice of using maxent without comparison to other models.
Although the study is being carried in 2010, the climate dataset from 1950 – 2000 shall be referred to as current climate data while the dataset from 2001 – 2050 modelled by the CCCMA shall be referred to as future climate data, with two scenarios; namely a2a
Figure 8: The flowchart of the methodology
The model was complemented by other software shown on Table 4.
Software Use
Maxent 3.1 habitat suitability modelling
Arc GIS 9.3 data processing, spatial analysis & map preparation Micro Soft Word reporting
Micro Soft Excel sample data processing
Micro Soft Power point power point preparation of research results
4. RESULTS and DISSCUSSION
4.1 Variable importance
The dataset having the current climatic conditions was used to predict for the species occurrence in the study area. To begin, the model was ran several times in order to check the stability, consistency and pattern of the predicted results. All the environmental variables were used in initial runs and later selective variables were retained. The preliminary runs were used to identify and discriminate for the key variables which were later retained for comparative predictions from the different scenarios. The environmental variables used in the initial runs were: altitude, aspect, maximum temperature, minimum temperature, mean temperature, slope, vegetation type and precipitation. While the selective variables that were retained were: altitude, maximum temperature, minimum temperature, slope, vegetation type and precipitation. The spatial reasons for making the choice on the selective variables are shown in Table 5.
Variable Proxy
altitude determines the micro-climate and in turn availability of resources maximum temperature informative on the upper limit for a species’ temperature tolerance minimum temperature informative on the lower limit for a species’ temperature tolerance slope determines the possibility of nesting
precipitation relates to availability of resources (water and food) vegetation type relates to availability of resources (food, shelter and nest)
Table 5: selected key variables for the model
The same altitude, slope and land cover type were used while the climatic variables were varied based on the different climate scenarios. The altitude and slope were constant in all cases since these would hardly change. The land cover type was also maintained for the following reason. Primarily, the vegetation type was of paramount importance in
supporting dense vegetation at the summit stretches well beyond 2050. Taking advantage of the response curves generated by the model during the run, below is a succinct explanation of the relationship between the variables (altitude, slope, land cover) and the probability of species presence. It may be worth noting that, in each graph all other variables are assumed to remain constant with respect to variable in question.
Generally, lower altitudes turn to offer more suitable conditions relative to very high altitudes. The reason being that at much higher altitudes the temperatures drop drastically as temperature near freezing point may be encountered at the summit of Mt. Fako. These temperatures seem not to favour the species’ physiological processes since the species may not be well adapted for such temperatures. Also, at much higher altitudes the availability of resources becomes scarcer. Moisture may be frozen, lesser food supplies and increasing difficulties for shelter are encountered as the vegetation transitionally become mosses and lichen making nest building difficult. Figure 9 shows the altitude varying with the probability of species presence.
Figure 9: Response curve for altitude
to areas with very steep slope. Figure 10 shows the slope varying with the probability of species presence.
Figure 10: Response curve for slope
Land cover code Land cover / use class
14 Transitional vegetation 19 Forest regeneration
5 Elephant bush with tree
6 Elephant bush
20 Sub-Montane Forest
24 West Coast Forest, >65%
Table 6: Land cover classes with high habitat suitability
The altitude had the highest gain when used in isolation meaning it had the most useful information by itself. Simultaneously, the land cover decreased the gain most when omitted; implying the land cover contained the information which the other variables did not contain. In relative term, these would mean the habitat suitability was much sensitive to both the altitude and the land cover type besides the other variable. The reason for this sensitivity is that slight changes in altitude could likely bring about significant changes in the micro-climatic conditions and in turn a change in suitability which will eventually result to a change in the spatial distribution of Pan troglodytes ellioti in the study area. The importances of the variables are expressed as gain in the jackknife diagrams. Figure 12 shows the jackknife of regularised training gain using all the variables.
4.2 Predicted habitat suitability based on current climate (1950-2000)
The selected key variables from the current climate dataset were input in to the model which was ran several times. From the predictions, four habitat suitability classes namely: Most Suitable, Suitable, Less Suitable and Least Suitable were distinguished.
The ―suitable class‖ was sandwiched between a pair of ―less suitable‖ and ―least suitable‖ classes on either sides. The suitable class lays at an altitude where the climatic conditions favour the physiological process of Pan troglodytes ellioti including other requirements for survival (Hutchinson 1957). The used variables and their percentage contributions as well as the jackknife of the regularised training gain and the predicted habitat suitability are shown in Table 7, Figures 13 and 14 respectively.
Variables Percentage contribution
Minimum Temperature 54.1 Vegetation type 21.8
Altitude 11.6
Precipitation 7.5
Slope 5
Maximum temperature 0
Table 7: Variables and their percentage contribution
4.3 Predicted habitat suitability based on future climate (2001-2050)
4.3.1 Based on b2a modelled scenario
The same set of selected key variables from the b2a dataset was input in to the model. Predictions were made by running the model several times. The variables and their percentage contributions, the jackknife of regularised training gain and the predicted habitat suitability are shown on Table 8, Figures 15 and 17 respectively.
Variables Percentage contribution
Altitude 64.8
Vegetation type 26.7
Slope 6.5
Precipitation 1.6
Maximum Temperature 0.4
Minimum Temperature 0
Table 8: Variables and their percentage contribution
Figure 15: Jackknife of the regularised training gain under the b2a climate scenario
seen in Figure 14. The shift in suitability is a likely influence of a corresponding rise in the mean global temperatures. That is; in the future higher altitudes are likely to attain temperatures that can only be reached at lower altitudes under the current climate scenario. In the future, the shift in suitability may cause the Pan troglodytes ellioti in the study area to migrate towards the summit in order to re-encounter suitable habitats.
4.3.2 Based on a2a modelled scenario
The same set of selected key variables from the a2a dataset was input in to the model. The model was ran several times and the prediction under this scenario made. The variables and their percentage contributions, the jackknife of regularised training gain and the predicted habitat suitability are shown in Table 9, Figures 16 and 18 respectively.
Variables Percentage contribution Altitude 63.1
Vegetation type 20.4 Precipitation 11.4
Slope 4.8
Minimum Temperature 0.2 Maximum Temperature 0
Table 9: Variables and their percentage contribution
Figure 16: Jackknife of the regularised training gain under the a2a climate scenario
This scenario assumes the concentration of CO2 in the atmosphere will double by 2050.
much lower altitudes increasingly become least suitable. For instance, the less suitable class at the extreme north of study area in Figure 14 becomes least suitable in Figure 18. Like under the b2a climate scenario, the likely increment in mean global temperatures resulting from increased concentration of GHGs brings about a shift in suitability which in turn causes the species to migrate towards the summit in the study area.
The apparent shift in suitability is due to the likely changes in precipitation levels and increases in temperatures with the changing climate as the global climate gets warmer. In other words, there is an apparent ascend in suitability from lower altitudes to higher altitudes with respect to climatic conditions of the current and future eras respectively. A reason for this observed trend is that the suitability is strongly influenced by altitude which determines the micro-climatic conditions at any given location. This means, the climatic conditions of temperature and precipitation which currently prevail in the suitable habitat range under the current scenario will likely be attainable only at much higher altitudes in the future. Since climate affects both the physiology of the species and availability of food and water supplies; in the future, species currently occupying the suitable habitat may likely undergo a migratory ascend towards the summit in order to encounter favourable climatic conditions that will be similar to those currently prevailing in the suitable habitat range under the current scenario. Table 10 summarises the predicted results for the different scenarios.
Suitability classes Current B2A A2A
Most suitable 0.29 0.25 0.18
Suitable 67.41 67.11 67.06
Less suitable 6.06 6.34 6.37
Least suitable 26.24 26.30 26.39
4.4 Accuracy assessment of predicted result
There are different methods for assessing the accuracy of such predictions (Skidmore 1999, Corsi et al., 2000, de Leeuw et al., 2002). The receiver operating characteristic (ROC) and the area under the curves (AUC) are fundamentally important in assessing the accuracy (Hanley and McNeil 1982). The ROC which is a plot of sensitivity (also referred to as 1-omission rate) against 1-specificity (also referred to as fractional predicted area) is typical of presence-absence modelling. Analogical to the absence is the background point in maxent (Phillip et al., 2006). In this case, the AUC was developed based on the background data instead of the absence data. In our study, the achieved AUC are shown in Table 11. Following the AUC classification by Hosmer and Lemeshow (2000) and the maximum possible test AUC1 gotten from the model, the predicted results approximate to the acceptable standards.
AUC Current Max. possible value 1
B2A Max. possible value 1
A2A Max. possible value 1 Training 0.726 / 0.728 / 0.720 /
Testing 0.650 0.694 0.609 0.687 0.623 0.699
Table 11: Accuracy assessment of predicted results
4.5 Modelled human activities
The local human activities have a direct impact on the habitat suitability and the general state of the park compared to global climatic changes which act relatively remotely. Figures 24 and 25 show these activities modelled as point features, though some may be extensive and are not limited to the point locations. The use of points depict the activities were locally recorded along transect lines which cut across these locations. Figures 24 and 25 show the local human activities modelled as points on the land cover and on the current habitat suitability respectively. Figure 24, shows the human activities being concentrated within the range currently suitable for the species. This overlap between the two puts the species in to greater vulnerability risks since human activities thins the forest and making it less appreciated by the species for a suitable habitat.
5. CONCLUSIONS
5.1 Conclusions
Pan troglodytes ellioti is one of the several biological species which refuge in the proposed MCNP. Like many other species in tropical Africa, the survival of Pan troglodytes ellioti is threatened by pressure from both environmentally unsustainable human activities carried in and around the park along side the mean global climate changes which seemingly affect all of nature. Local anthropogenic activities have a direct impact compared to climate changes which act remotely on the habitat suitability for the species. However, the species’ habitat suitability is interactively impacted by both direct and indirect threats and these call for concern from both national and
international levels to ensure the species’ survival in the future. Based on the research
interest, the aim and objectives were fulfilled and satisfactory answers have been provided to the research questions earlier stated in section 1.3. Below is a validation of the hypotheses that were earlier raised in section 1.3.
The predicted results made use of all the variables used in the model. However, the altitude was found to have the most useful information by it self while the land cover appeared to contain the information that was not present in the other variables. Thus, the variables had differing sensitivities on the habitat suitability. The altitude and land cover were the most sensitive to the habitat suitability. The null hypothesis was found to be false while the alternative hypothesis was found to be true.
Four habitat suitability classes were distinguished with an approximate accuracy assessment of 0.7 and 0.6 under the current and future climate scenarios respectively. About 85% of the study area was found to be currently suitable for
The suitable habitat for Pan troglodytes ellioti and areas on which human activities are carried both overlap in the study area. This overlap makes the species more vulnerable to greater threats and risks that may accelerate extinction. The null hypothesis was found to be false while the alternative hypothesis was found to be true.
Climate change has an influence on the habitat suitability for Pan troglodytes ellioti in the study area. Climate change is likely to cause a shift in the suitability from lower altitudes to higher altitudes in the future. This shift may in turn force the species to migrate towards higher altitudes in the future. The null hypothesis was found to be false while the alternative hypothesis was found to be true.
5.2 Limitations
As a major limitation, the original DEM that was downloaded from GLCF had some elevation values missing. A greater portion of the crest of Mount Etinde and a few smaller patches were missing. Although the error was minimised during the data processing phase which has been briefly explained in section 3.1, the final results were slightly affected in the areas where these errors occurred. For instance; the crest of Mount Etinde (smaller isolated blue peak located on the south eastern part of the study area) appears to be suitable in Figure 14 but in actual terms is least suitable.
It is important to note that the predicted results are outputs from a model, in this case the maximum entropy species distribution (Maxent). The salient veracity about predictions got from models is that they all have a degree of uncertainty associated with them. In other words, the problem of uncertainty is ubiquitous with all models. As such we must be frank with the predicted results as having some uncertainties, thus, predictions would hardly have an accuracy assessment of 1 in any case. In this study, the predicted results under the future climate scenarios likely inherited a certain level of uncertainty from the modelled climate dataset that was used since the climatic conditions for the future are themselves predictions from the model developed by the CCCMA. Thus, accuracy assessments of 0.7 and 0.6 for the current conditions and future scenarios respectively can not be prodigious while bearing in mind that in maxent, the actual accuracies may exceed the stated values. Also, if the dataset on species presence could be increased that would lead to better training of the model and in turn better predictions. It is advisable to run the model as many times as possible while observing the trend in the predicted outputs in order to make meaningful predictions and conclusions.
5.3 Recommendations
indiscriminate exploitation of natural resources within the park. However, the use of law to stop the local peasant population from exploiting the local resources from the park upon which part of their livelihood depends may be hard to archive successfully due to economic hardship and level of literacy. A much sustainable option may be to adopt a participatory approach whereby individuals from the surrounding communities may be recruited as part of the labour force involved in the management of the park. It may also be worth for the State to provide the surrounding rural communities with basic social amenities. Such facilities may include primary healthcare, public capacity build institutions, improved communication network, pipe born water supply and electricity facilities (as the need may be). In this way, the local communities may cooperate with the State in managing the park since they receive some benefits in return to support their livelihood. Such measures by the government of Cameroon could better ensure sustainability both in terms of nature and biodiversity conservation while alleviating poverty from among her people.
BIBLIOGRAPHIC
REFERENCES
Anderson, R. P., Lew, D. and Peterson, A. T. (2003): Evaluating predictive models of
species’ distributions: Criteria for selecting optimal models. Ecological
Modelling, 162, 211-232.
Araujo, M. B. et al. 2004. Would climate change drive species out of reserves? An assessment of existing reserve-selection methods. Global Change Biol. 10: 1618-1626.
Araujo, M. B. and Williams, P. H. 2000. Selecting areas for species persistence using occurrence data.Biol. Conserv. 96: 331-345.
Austin, M. P. (2002): Spatial prediction of species distribution: An interface between ecological theory and statistical modelling. Ecological Modelling, 157, 101-118.
Austin, M. P. And Cunningham, R.B. (1981): Observational analysis of environmental gradients. Proc. Ecological Society of Australia 11: 109-119.
Aubréville, A., (1949): Climats, forets et déserfification de l’Afrique Tropicale. Paris
Sociéte d’Edition Géographique, Maritimes et Coloniales.
Barry, S. and Elith, J. (2006): Error and uncertainty in habitat models. Journal of Applied Ecology 43, pp 413 – 423.
Beever, E.A., Pyke, D.A.; Chambers, J.C.; et al., (2005): Monitoring temporal change in riparian vegetation of Great Basin National Park. Western North American Naturalist 65(3):382-402.
Beever, E.; Brussard, P. and Berger, J. (2003): Patterns of apparent extirpation among isolated populations of pikas (Ochotona princes) in the Great Basin. Jour. Mammology 84: 37-54.
Benson, L.; Kashgarian, M.; Rye, R.; et al., (2002): Holocene multidecadal and
multicentennial droughts affecting Northern California and Nevada. Quaternary Science Review. 21, 659-682.
Blumenbach, J. F. (1775): De Generis Humani Varietate Nativa. M D thesis, University of Göttingen, Germany.
Bonnifille, R. and Riolet, G. (1988): The Kashiru pollen sequence (Burundi)
palaeoclimatic implications for the last 40,000years B.P. in tropical Africa. Quat. Res. 30: 19-35.
Booth, A.H. (1957) The Niger, the Volta and the Dahomey gap as geographic barriers. Evolution 12: 48-62
Booth, A.H. (1954): The Dahomey gap and the mammalian fauna of West African forests. Rev. Zool. Bot. Afr.50: 3-4
Boubli, J. P. and de Lima, M. G. (2009): Modeling the geographical distribution and fundamental niches of Cacajao spp.and Chiropotes israelita in Northwestern Amazonia via a Maximum Entropy Algorithm. Int. Journal of Primatol. 30: 217– 228
Brown, J. H. and Lomolino, M. V. (1998): Biogeography. Sunderland, Massachusetts. Brown J.H., Mehlman, D.W. and Stevens, G.C. (1995): Spatial variation in abundance.
Ecology 76: 2028-2043.
Busby, J. R. 1991. BIOCLIM a bioclimate analysis and prediction system. In: Margules, C. R. and Austin, M. P. (eds), Nature conservation: cost effective biological surveys and data analysis. CSIRO, pp. 64-68.
Butynski, T. M. (2003): The robust chimpanzee (Pan troglodytes) taxonomy,
distribution, abundance and conservation status. In: West African chimpanzee status survey and conservation action plan. IUCN/SSC Primate Specialist Group, Gland, Switzerland, pp 5-12 Kormos, R., Boesch, C., Bakarr, M.I. and Butynski, T.M. (eds).
Butynski, T. M. (2001). Africa’s Great Apes. In Beck, B. B., Stoinski, T. S., Hutchins, M., Maple, T. L., Norton, B., Rowan, A., Stevens, E., and Arluke, A. (eds.), Great apes and humans: The Ethics of Coexistence, Smithsonian Institution Press, Washington, DC, pp. 3–56.
Butynski, T. and Members of the Primate Specialist Group (2000). Pan troglodytes ssp.