Allelic frequencies and statistical data obtained from 12 codis STR loci
in an admixed population of the Brazilian Amazon
Pablo Abdon da Costa Francez
1,2, Elzemar Martins Ribeiro Rodrigues
2, Gleycianne Furtado Frazão
3,
Nathalia Danielly dos Reis Borges
3and Sidney Emanuel Batista dos Santos
21
Laboratório de Genética Forense, Departamento de Laboratórios Forenses,
Polícia Técnico-Científica do Amapá, Macapá, AM, Brazil.
2
Laboratório de Genética Humana e Médica, Departamento de Patologia,
Universidade Federal do Pará, Belém, PA, Brazil.
3
Faculdade SEAMA, Macapá, AM, Brazil.
Abstract
The allelic frequencies of 12 short tandem repeat loci were obtained from a sample of 307 unrelated individuals living in Macapá, a city in the northern Amazon region, Brazil. These loci are the most commonly used in forensics and pa-ternity testing. Based on the allele frequency obtained for the population of Macapá, we estimated an interethnic ad-mixture for the three parental groups (European, Native American and African) of, respectively, 46%, 35% and 19%. Comparing these allele frequencies with those of other Brazilian populations and of the Iberian Peninsula population, no significant distances were observed. The interpopulation genetic distances (FSTcoefficients) to the present
data-base ranged from FST= 0.0016 between Macapá and Belém to FST= 0.0036 between Macapá and the Iberian
Penin-sula.
Key words:allelic frequencies; Brazilian Amazon population; interethnic admixture.
Received: May 12, 2010; Accepted: September 23, 2010.
The population of the Amazon region originated from the miscegenation of three large ethnic groups: Native American, European colonizers and Africans. Archeologi-cal studies have estimated that the first humans which reached the Amazon region were Paleoindians coming from the north and west of the American continent about 12,000 years ago (Salzano and Bortolini , 2002).
The mixture between Europeans and Native Ameri-cans from the Amazon region started soon after the arrival of the first European colonizers. After their settling in the new territory, the Europeans began using the indigenous la-bor force for the occupation and exploitation of the Ama-zon region. Along the 17th century, the indigenous slave labor force decreased and, as of the mid-18th century, Afri-cans were introduced as slave labor force, representing the third migration wave into the region (Curtin, 1969; Cunha, 1995).
In the State of Amapá, the first documented records of contact between Europeans and Native Americans go back to 1499, when Americo Vespucci, who took part in the
ex-pedition of Alonso de Hojeda, under the orders of the Cath-olic sovereigns of Spain Fernando and Isabel (Castela and Aragon), traveled along its coast, passing the Cavian, the Pigs and the Pará islands, which face the current capital of the State of Amapá. An important record of the arrival of Africans in Amapá was made in 1764, during the construc-tion of the Fortress of São José de Macapá, where Africans and Tucuju, Aruan, Aruaque and other natives living in the delta of the Amazon River and on the island of Marajó were used as labor force (Morais and Morais, 2000).
Defining from the genetic point of view what it means to be Brazilian is a difficult task, mainly if one considers that this is one of the most heterogeneous populations in the world. Countless scientific studies have attempted to pro-vide answers as to the contribution of Natives Americans, of Europeans and of Africans to the shaping of the current Brazilian population, but the only consensus is that the crossbreeding dynamics that occurred in Brazil are unique and present great complexity.
The main purpose of this work was to estimate popu-lation parameters based on the allele frequencies obtained for 12 polymorphic autosomal STR loci investigated in a sample of the population of Macapá, and to compare the re-sults with others, of different Brazilian populations and of the Iberian Peninsula. This study was approved by the www.sbg.org.br
Send correspondence to Pablo A.C. Francez. Laboratório de Ge-nética Humana e Médica, Instituto de Ciências Biológicas, Cidade Universitária Prof. José da Silveira Netto, Rua Augusto Corrêa 01, Guamá, Caixa Postal 8615, 66075-970 Belém, PA, Brazil. E-mail: [email protected].
SEAMA College Research Ethics Committee (REC Reso-lution no. 023/2007).
After obtaining informed consent, 3 mL samples of peripheral blood were collected from 307 unrelated healthy individuals (185 women, 122 men; mean age 22.3 years; range 18 to 80 years) who live in the city of Macapá (0°02’20” N; 51°03’59” W), state of Amapá, northern Brazil, and were recruited upon routine examinations at the Macapá UNILAB Clinical Analysis Laboratory. Genomic DNA was extracted using the phenol-chloroform protocol described by Sambrook at al. (1989), and DNA quantifica-tion was done with a NANODROP 1000 spectrophoto-meter (Thermo Scientific, Wilmington, DE, USA). 1-5 ng of target DNA were used to co-amplify the 12 short tandem repeats (D8S1179, D21S11, D7S820, CSF1PO, TH01, D13S317, D16539, vWA, TPOX, D1851, D5S818, FGA) investigated in this study. The PCR primer sequences and DNA amplification conditions used were previously de-scribed (Ribeiro-Rodrigueset al., 2007). Electrophoresis and genotyping were performed in an ABI 3130 Avant Au-tomated Sequencer (Applied Biosystems, Foster City, CA, USA). Data acquisition was performed with the ABI PRISM 3130 - Avant Data Collection v2.0 software (Ap-plied Biosystems) and for profile analysis we used the GeneMapper ID v3.2 software (Applied Biosystems). Genotyping quality and allele designations were assured by simultaneous electrophoretic analysis of a control sample of known size. Allele designations were made by using the ABIGS ROX 500 reference ladder (Applied Biosystems) as size standard and according to published nomenclature and in concordance with the National Institute of Standards and Technology for forensic STR analysis (NIST).
Allele frequencies, heterozygosity (H), polymor-phism information content (PIC), power of discrimination (PD), power of exclusion (PE) and deviation probability from the Hardy-Weinberg equilibrium (P) were obtained using the Arlequin Version 2.000 software (Schneideret al., 2000). Matching probability (MP) and typical paternity index (TPI) were calculated for each locus using the Powerstats V12 software (Tereba, 1999). Interethnic ad-mixture was calculated using the ADMIX 95 software. Ge-netic distance FST coefficients were determined from the
allelic frequencies using the DISPAN software (Ota, 1993) for the 12 loci analyzed. The FST matrix and UWPGMA
(Unweighted Pair Group Method of Analysis) tree analysis were performed using the GDA program (Lewis and Zaykin, 2001). The tree was displayed by means of the TreeView software (Page, 1996).
All the analyzed loci were in Hardy-Weinberg equi-librium in the studied population (p > 0.05), including D8S1179 (p = 0.036), D21S11 (p = 0.006) and FGA (p = 0.033), once, after applying the Bonferroni correction, even the differences observed for these three loci (D8S1179, p = 0.356; D21S11, p = 0.069; and FGA, p = 0.331) proved not to be statistically significant.
The forensic parameters investigated show high aver-age values: polymorphism information content (PIC) = 77%; power of discrimination (PD) = 93%; power of exclu-sion (PE) = 61%; observed heterozygosity (Ho) = 80%;
cu-mulative matching probability (MP) =
0.000000000000095 (probability of finding another person with the same genetic profile using these 12 markers), and cumulative typical paternity index (TPI) = 73,200.00 (in-dex based on Bayesian statistics that indicates the ratio be-tween the possibility of the alleged father being the true parent versus the possibility of the alleged father not being the true parent, using the 12 analyzed markers).
The FGA marker showed the highest level of hetero-zygosity (89.5%), and the TPOX marker showed the lowest (71.3%). The power of discrimination and the power of ex-clusion for the 12 STRs studied were 99.9999999999992% and 99.9991%, respectively (Table 1).
By comparing the allele frequencies obtained for the 12 STR-autosome systems investigated in the population of Macapá (Table 1) with the frequencies described in the three parental ethnic groups (Ribeiro-Rodrigues EM, 2003, Dissertação de Mestrado do Curso de Genética Molecular da Universidade Federal do Pará, Belém), using the ADMIX 95 program, we were able to estimate the Euro-pean, African and Native American contributions at 0.46±0.0261, 0.19±0.0262, and 0.35±0.0264, respec-tively.
However, when the ancestry percentages estimated for the population of Macapá are compared with the per-centages described in other Brazilian populations, it be-comes clear that there is a regional variation regarding the dynamics of crossbreeding in Brazil. Thus, by comparing the results obtained in the population of Macapá with those of populations of different geopolitical regions of Brazil (Grattapagliaet al., 2001; Ferreira da Silva et al., 2002; Dellaliberaet al., 2004; Góeset al., 2004; Ribeiro-Rodri-gueset al., 2007; São-Bentoet al, 2008; Ocampos et al., 2009 Ribeiro-Rodrigueset al., 2007; as well as Godinho NMO, 2008, Tese de Doutorado, Curso de Ciências Bio-lógicas da Universidade de Brasília, DF) and with popula-tions of the Iberian Peninsula (Ribeiro-Rodrigues EM, 2003, Dissertação de Mestrado, Curso de Genética Molecu-lar, Universidade Federal do Pará, Belém) (Table 2 and Figure 1), the population of Macapá showed to be closer, in terms of genetic distances, to the population of Belém (FST= 0.0016), in strict accordance with their geographic
location and history of colonization. The Iberian Peninsula (FST = 0.0036) is clearly the most distinct population, as
well as the one of São Paulo (FST= 0.0029). These results
agree with other population studies and historical data and are consistent with the anthropological origins (Caucasian, African and Native American) of the Brazilian populations tested.
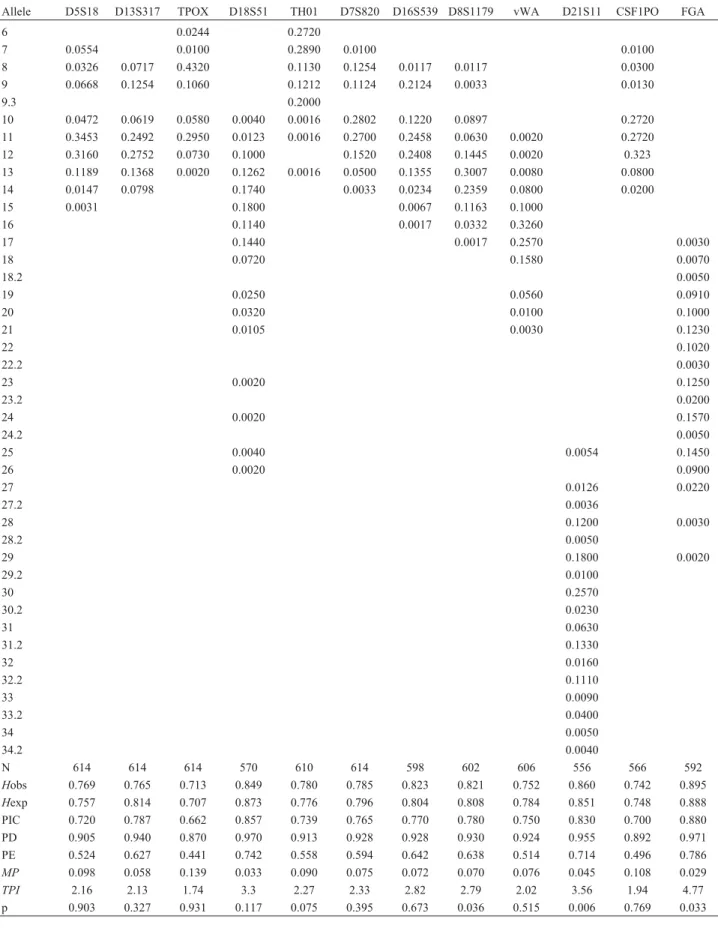
geo-Table 1- Allele frequencies distribution of 12 STR loci observed in the present study.
Allele D5S18 D13S317 TPOX D18S51 TH01 D7S820 D16S539 D8S1179 vWA D21S11 CSF1PO FGA
6 0.0244 0.2720
7 0.0554 0.0100 0.2890 0.0100 0.0100
8 0.0326 0.0717 0.4320 0.1130 0.1254 0.0117 0.0117 0.0300
9 0.0668 0.1254 0.1060 0.1212 0.1124 0.2124 0.0033 0.0130
9.3 0.2000
10 0.0472 0.0619 0.0580 0.0040 0.0016 0.2802 0.1220 0.0897 0.2720
11 0.3453 0.2492 0.2950 0.0123 0.0016 0.2700 0.2458 0.0630 0.0020 0.2720
12 0.3160 0.2752 0.0730 0.1000 0.1520 0.2408 0.1445 0.0020 0.323
13 0.1189 0.1368 0.0020 0.1262 0.0016 0.0500 0.1355 0.3007 0.0080 0.0800
14 0.0147 0.0798 0.1740 0.0033 0.0234 0.2359 0.0800 0.0200
15 0.0031 0.1800 0.0067 0.1163 0.1000
16 0.1140 0.0017 0.0332 0.3260
17 0.1440 0.0017 0.2570 0.0030
18 0.0720 0.1580 0.0070
18.2 0.0050
19 0.0250 0.0560 0.0910
20 0.0320 0.0100 0.1000
21 0.0105 0.0030 0.1230
22 0.1020
22.2 0.0030
23 0.0020 0.1250
23.2 0.0200
24 0.0020 0.1570
24.2 0.0050
25 0.0040 0.0054 0.1450
26 0.0020 0.0900
27 0.0126 0.0220
27.2 0.0036
28 0.1200 0.0030
28.2 0.0050
29 0.1800 0.0020
29.2 0.0100
30 0.2570
30.2 0.0230
31 0.0630
31.2 0.1330
32 0.0160
32.2 0.1110
33 0.0090
33.2 0.0400
34 0.0050
34.2 0.0040
N 614 614 614 570 610 614 598 602 606 556 566 592
Hobs 0.769 0.765 0.713 0.849 0.780 0.785 0.823 0.821 0.752 0.860 0.742 0.895
Hexp 0.757 0.814 0.707 0.873 0.776 0.796 0.804 0.808 0.784 0.851 0.748 0.888
PIC 0.720 0.787 0.662 0.857 0.739 0.765 0.770 0.780 0.750 0.830 0.700 0.880
PD 0.905 0.940 0.870 0.970 0.913 0.928 0.928 0.930 0.924 0.955 0.892 0.971
PE 0.524 0.627 0.441 0.742 0.558 0.594 0.642 0.638 0.514 0.714 0.496 0.786
MP 0.098 0.058 0.139 0.033 0.090 0.075 0.072 0.070 0.076 0.045 0.108 0.029
TPI 2.16 2.13 1.74 3.3 2.27 2.33 2.82 2.79 2.02 3.56 1.94 4.77
p 0.903 0.327 0.931 0.117 0.075 0.395 0.673 0.036 0.515 0.006 0.769 0.033
N: number of chromosomes;Hobs: observed heterozygosity;Hexp: expected heterozygosity; PIC: polymorphism information content; PD: power of dis-crimination; PE: power of exclusion;MP: matching probability;TPI: typical paternity index; p: probability of deviation from Hardy-Weinberg equilibrium.
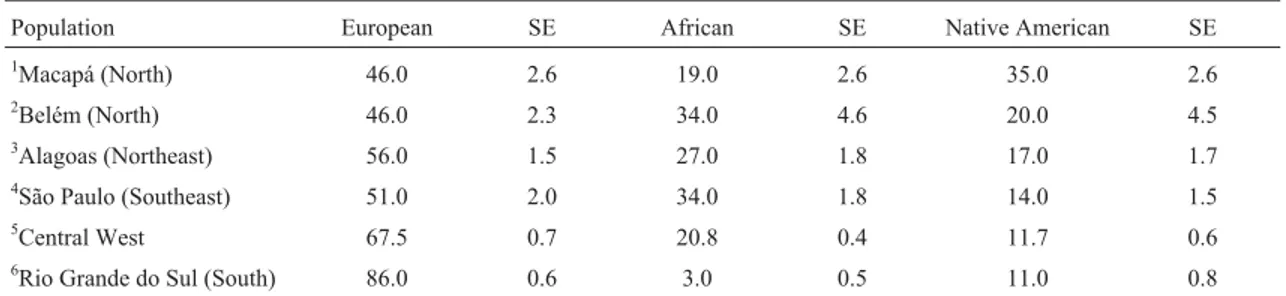
graphically closer to each other, as in the case of Macapá and Belém, Santa Catarina and São Paulo, and Pernambuco and Alagoas, respectively. These results are in agreement with other studies (Handleyet al, 2007) indicating that the gene flow among population groups is inversely propor-tional to the geographic distance between them. These re-sults also agree with the fact that, due to the special occupation policies of such a vast territory, the admixture process occurred in different ways in different geographic regions of the country. The data in Table 2 are in agreement with those of Salzano and Bortolini (2002), indicating that in northeastern Brazil the African contribution is high and the Native American component is low; in the North, the contribution of Native Americans is pronounced, whereas in the South the Native American and African influence is reduced compared to all the other geographic regions.
The absence of significant differences between the genetic distances among the population of Macapá and other Brazilian populations observed in this study is due to the fact that the markers used have low values of FST
be-tween different human ethnic groups. This characteristic was deliberately selected and is important, because these markers are used in human identification studies, including civil and criminal forensic investigations. It is therefore not desirable that they present significant differences in gene frequencies among different population groups, since this could increase the risk of statistical errors, such as overesti-mation of the paternity index arising from populational substructuring.
Acknowledgments
The authors wish to thank the persons who agreed to participate in this study and the Universidade Federal do Pará (UFPA) and POLITEC-AP for financial support.
References
Cunha MC (1995) História dos Índios no Brasil. Companhia das Letras/FAPESP/SMC-PMSP, São Paulo, 611 pp.
Curtin PD (1969) The Atlantic Slave Trade: A Census. University of Wisconsin Press, Madison, 457 pp.
Dellalibera E, Havro MLB, Souza M, Kajihara K, Mauricio-da-Silva L and Silva RS (2004) Genetic analysis of 13 STR loci in the population from the State of Pernambuco, north-east Brazil. Forensic Sci Int 146:57-59.
Ferreira da Silva LA, Pimentel BJ, Azevedo DA, Silva ENP and Santos SS (2002) Allele frequencies of 9 STR loci -D16S539, D7S820, D13S317, CSF1PO, TPOX, TH01, F13A01, FESPS and vWA, in the population from Alagoas, north-eastern Brazil. Forensic Sci Int 130:187-188. Goes ACS, Silva DA, Gil EHF, Silva MTD, Pereira RW and
Carvalho EF (2004) Allele frequencies data and statistic pa-rameters for 16 STR loci – D19S433, D2S1338, CSF1PO, D16S539, D7S820, D21S11, D18S51, D13S317, D5S818, FGA, Penta E, TH01, vWA, D8S1179, TPOX, D3S1358 - in the Rio de Janeiro population, Brazil. Forensic Sci Int 140:131-132.
Grattapaglia D, Schmidt AB, Costa e Silva C, Stringher C and Fernandes AP (2001) Brazilian population database for the
Figure 1- Phylogenetic tree obtained by the WPGMA method, based on the allele frequencies of nine STRs systems detected in Macapá (current study), Belém (Ribeiro-Rodrigueset al., 2007), Alagoas (Ferreira da Silva
et al., 2002) Pernambuco (Dellaliberaet al., 2004), São Paulo (São-Bento
et al., 2008), Santa Catarina (Ocamposet al., 2009), Rio de Janeiro (Góes et al., 2004), Brazil (Grattapagliaet al., 2001), and the Iberian Peninsula (Ribeiro-Rodrigues,2003, Masters Thesis).
Table 2- Percentage of parental interethnic admixture estimated for the Macapá population and other Brazilian populations.
Population European SE African SE Native American SE
1Macapá (North) 46.0 2.6 19.0 2.6 35.0 2.6
2Belém (North) 46.0 2.3 34.0 4.6 20.0 4.5
3Alagoas (Northeast) 56.0 1.5 27.0 1.8 17.0 1.7
4São Paulo (Southeast) 51.0 2.0 34.0 1.8 14.0 1.5
5Central West 67.5 0.7 20.8 0.4 11.7 0.6
6Rio Grande do Sul (South) 86.0 0.6 3.0 0.5 11.0 0.8
1current study;2Ribeiro-Rodrigueset al., 2007;3Ferreira da Silvaet al., 2002;4São-Bentoet al., 2008;5Godinho, Doctoral thesis, 2008 (Samples from
Mato Grosso do Sul, Goiás and Distrito Federal);6Leiteet al., 2003.
13 STR loci of the AmpFlSTR®Profile Plus and Cofiler
multiplex kits. Forensic Sci Int 118:91-94.
Handley LJL, Manica A, Goudet J and Balloux F (2007) Going the distance: Human population genetics in the clinal world. Trends Genet 23:432-439.
Leite FPN, Menegassi FJ, Schwengber SP, Raimann PE and Al-buquerque TK (2003) STR data 09 autosomal STR markers from Rio Grande do Sul (southern Brazil). Forensic Sci Int 132:223-224.
Morais PD and Morais J D (2000) O Amapá em Perspectiva: Uma abordagem Histórico-Geográfica. Editora Valcan, Macapá, 200 pp.
Ocampos M, Fernandes RC, Latorre AFS, Dornelles DS, Korndorfer FP, Giamarusti AC and Menezes ME (2009) 15 STR loci frequencies in the population from Santa Catarina, Southern Brazil. Forensic Sci Int Genet 3:367-369. Page RD (1996) TreeView: An application to display
phylogen-etic trees on personal computers. Comput Appl Biosci 12:357-358.
Ribeiro-Rodrigues EM, Palha TJBF and Santos SEB (2007) Al-lele frequencies data and statistic parameters for 13 STR loci in a population of the Brazilian Amazon Region. Forensic Sci Int 168:244-247.
Salzano FM and Bortolini MC (2002) The Evolution and Genetics of Latin American Populations. Cambridge University Press, Cambridge, 512 pp.
Sambrook J, Fritsch EF and Maniatis T (1989) Isolations of DNA from mammalian cells. In: Ford N, Nolan C and Ferguson M (eds) Molecular Cloning. Cold Spring Harbor Laboratory Press, New York, pp 916-919.
São-Bento M, Carvalho M, Andrade L, Lopes V, Serra A, Gamero JJ, Corte-Real F, Vide MC and Anjos MJ (2008) STR data for the 15 AmpFlSTR1 IdentifilerTM loci in the Brazilian population of São Paulo State. Forensic Science Interna-tional: Genetics Supplement Series 1:367-369.
Schneider S, Roessli D and Excoffier L (2000) Arlequin: A Soft-ware for Population Genetics Data Analysis, v. 2.000. Ge-netics and Biometry Laboratory, Department of Anthropol-ogy.
Internet Resources
ADMIX 95 Software, http://www.genetica.fmed.edu.uy (July 5, 2008).
Lewis PO and Zaykin D (2001) Genetic data analysis: Computer program for the analysis of allelic data,
http://www.eeb.uconn.edu/people/plewis/software.php (September 10, 2009).
National Institute of Standards and Technology for forensic STR analysis (NIST): http://www.cstl.nist.gov/div831/strbase/ (April 20, 2008).
Ota T (1993) DISPAN: Genetic Distance and Phylogenetic Analysis, http://www.bio.psu.edu/people/fac-ulty/Nei/Lab/dispan2.htm (October 7, 2009).
Tereba A (1999) Tools for analysis of population statistics. Pro-file in DNA 14-16. Free software distributed by the authors at website http://www.promega.com/geneticidtools/.
Associate Editor: Francisco Mauro Salzano