AFLP marker analysis revealing genetic structure of the tree
Parapiptadenia rigida
(Benth.) Brenan (Leguminosae-Mimosoideae)
in the southern Brazilian Tropical Rainforest
Laís Bérgamo de Souza, Eduardo A. Ruas, Luana A. Rodrigues, Claudete F. Ruas and Paulo M. Ruas
Departamento de Biologia Geral, Centro de Ciências Biológicas, Universidade Estadual de Londrina,
Londrina, PR, Brazil.
Abstract
Parapiptadenia rigida is a tropical early secondary succession tree characteristic of the Tropical Atlantic Rainforest. This species is of great ecological importance in the recovery of degraded areas. In this study we investigated the variability and population genetic structure of eight populations ofP. rigida. Five AFLP primer combinations were used in a sample of 159 individuals representing these eight populations, rendering a total of 126 polymorphic frag-ments. The averages of percentage of polymorphic loci, gene diversity, and Shannon index were 60.45%, 0.217, and 0.322, respectively. A significant correlation between the population genetic variability and the population sizes was observed. The genetic variability within populations (72.20%) was higher than between these (22.80%). No perfect correlation was observed between geographic and genetic distances, which might be explained by differences in de-forestation intensities that occurred in these areas. A dendrogram constructed by the UPGMA method revealed the formation of two clusters, these also confirmed by Bayesian analysis for the number of K cluster. These results show that it is necessary to develop urgent management strategies for the conservation of certain populations ofP. rigida, while other populations still preserve reasonably high levels of genetic variability.
Keywords: Tropical tree, genetic diversity, population genetics, conservation, AFLP.
Received: April 20, 2013; Accepted: June 20, 2013.
Introduction
The Atlantic Rainforest is considered one of the five most important biodiversity hotspots in the world (Myerset al., 2000) and one of the most threatened biomes of the
planet. For centuries the Atlantic Rainforest has been sub-jected to intense human disturbance that has intensified in the last seven decades, causing the fragmentation of large forest areas and leaving behind, in the majority of its area, only small disconnected forest fragments that are almost entirely isolated and surrounded by extensive anthro-pogenic matrices, such as pasture, monoculture and areas of urban development (Fundação SOS Mata Atlântica, 2002). Hence, the long-term survival of endemic species in this biome will depend on their ability to persist in these en-vironments and our ability to manage and conserve them in degraded landscape (Fahrig, 2002).
Forest fragmentation exposes populations to ecologi-cal and genetic problems caused by inbreeding and loss of variation due to the reduction of effective population size
that can lead to genetic drift. The loss of genetic variability that results from such events can cause a decrease in the re-productive ability, disease resistance and genetic plasticity, making it more difficult for natural populations to adapt to environmental change and turning them more susceptible to extinction (Heywood and Stuart, 1994). After habitat fragmentation, the majority of species still remains in the fragments for some time, however, the problems caused by the imbalance of the ecosystem favors the dominance of few or a single species. Nevertheless, small forest frag-ments still have significant value for biodiversity, although they are influenced by the size, shape and degree of isola-tion between them (Turner and Corlett, 1996). In this con-text, studies on animal and plant populations in forest fragments gain increasing importance to address issues like the loss of biodiversity that can cause great harm to future human generations (Wilson and Frances, 1997). In order to establish strategies for the conservation of species and eco-systems, further knowledge of the genetic variability in such populations is needed (Botrelet al., 2006).
Parapiptadenia rigida (Benth.) Brenan.
(Leguminosae-Mimosoideae), is a deciduous, heliophyte, allogamous, monoecious, early secondary tree species that grows on various soil types and is recommended for the
re-www.sbg.org.br
Send correspondence to Eduardo Augusto Ruas. Departamento de Biologia Geral, Centro de Ciências Biológicas, Universidade Esta-dual de Londrina, Rodovia Celso Garcia Cid s/n, Caixa Postal 6001, 86051-980 Londrina, Paraná, Brazil. E-mail: edu_wicca@ya-hoo.com.br.
covery of degraded forests, especially in areas of perma-nent preservation (Durigan and Nogueira, 1990; Vaccaroet al., 1999). This species is found in the Atlantic interior
for-est of several Brazilian states, including Minas Gerais, São Paulo, Paraná, Santa Catarina and Rio Grande do Sul, with widest occurrence in the latter three states. It is character-ized by a hard wood that is commonly used in construction, shipbuilding, carpentry and joinery, manufacture of coa-ches, stakes, light and telephone poles and railway sleepers (Lorenzi, 2002; Da Silvaet al., 2012). Despite of being a
monoecious plant,P. rigidapresents self-incompatibility
(,Ribas LA, 1999, PhD Thesis, Universidade Federal de Viçosa, Viçosa) and its seeds are dispersed by wind, water or barochory, and pollen is dispersed by small and medium sized bees (Kageyama, 1992).P. rigidahas a lifespan of
around 100 years and flowering occurs around 10 years of age (Da Silvaet al., 2012). This species also has medicinal
properties and is widely used in folk medicine for the treat-ment of sinusitis, cough (Franco and Fontana, 1997), vagi-nal infections (Korbes, 1995) and broncho-pulmonary diseases. Gum, resins and tannins can be extracted from its bark and fruit, (Cândido, 1974; Lorenzi, 2002). These fac-tors make this species very important for restoration pro-grams carried out in the Atlantic Rainforest.
In this study we investigated the genetic diversity within and betweenP. rigidapopulations in eight naturally occurring forest fragments of different sizes, using AFLP markers in an attempt to determine possible effects of frag-mentation on the genetic structure and to provide subsidies for management and conservation of these populations.
Material and Methods
Sampling strategy
Leaves were collected from 159 adult individuals of
P. rigida present in eight forest fragments distributed in
eight Atlantic Rainforest remnants in the southern Brazil-ian States Paraná and Santa Catarina. We sampled only in-dividuals that had reached reproductive age, and this was done during their flowering time. The minimum distance
among trees was 30 meters, and individuals were sampled throughout all areas of the fragments (Table 1, Figure 1).
DNA isolation and Amplified Fragment Length Polymorphism (AFLP) reactions
Genomic DNA was isolated from approximately 0.5 g of fresh leaves using the CTAB method, as described by Doyle and Doyle (1987). The DNA concentration was estimated using a fluorometer (DyNA Quant 200, Höfer-Pharmacia), according to manufacturer instructions. An AFLP analysis was carried out as described by Voset al.
(1995). Briefly, 0,8 to 1.0mg of each DNA samples were
submitted to restriction digestion by EcoRI/MseI endo-nucle-ases (5U each) and ligation to their respective adapt-ers. After incubation for 16 h at 37 °C, the samples were di-luted (1:10) in ultrapure water. Polymerase chain reaction (PCR) amplifications were carried out using pre-selective primers complementary to the adapters with addition of one 3’ nucleotide and diluted 1:10. For selective amplification, an initial screening was carried out with four individuals from each area using 24 primer combinations. Five primer com-binations were chosen for selective PCR. The prod-ucts of selective amplification were resolved by electropho-resis in polyacrylamide gels (polyacrylamide 7%
acryl-Figure 1- Map of Brazil highlighting the States of Paraná and Santa Catarina, with the geographic representation of the eight studied popula-tions ofParapiptadenia rigida.
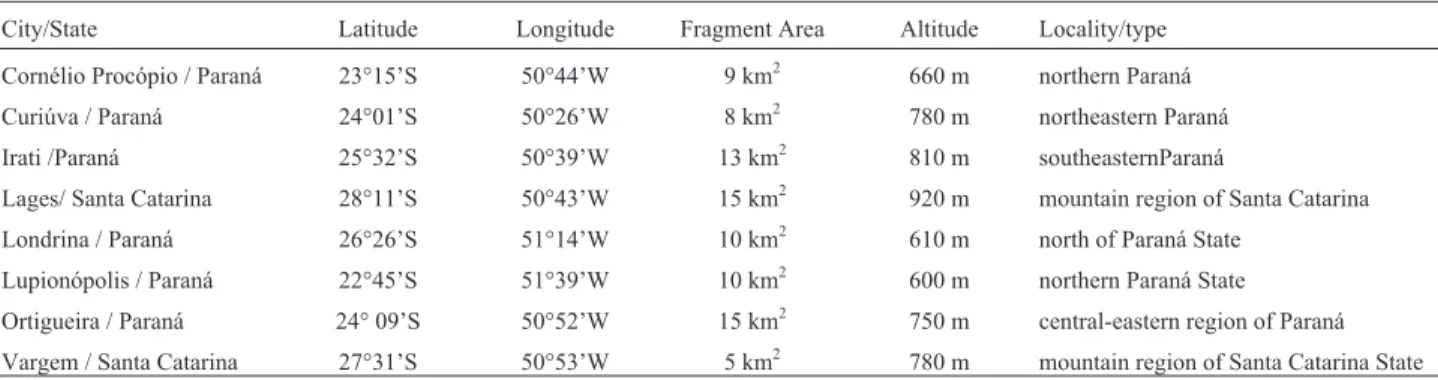
Table 1- Geographic information, fragment area, and vegetation type of the sampled populations.
City/State Latitude Longitude Fragment Area Altitude Locality/type
Cornélio Procópio / Paraná 23°15’S 50°44’W 9 km2 660 m northern Paraná
Curiúva / Paraná 24°01’S 50°26’W 8 km2 780 m northeastern Paraná
Irati /Paraná 25°32’S 50°39’W 13 km2 810 m southeasternParaná
Lages/ Santa Catarina 28°11’S 50°43’W 15 km2 920 m mountain region of Santa Catarina
Londrina / Paraná 26°26’S 51°14’W 10 km2 610 m north of Paraná State
Lupionópolis / Paraná 22°45’S 51°39’W 10 km2 600 m northern Paraná State
Ortigueira / Paraná 24° 09’S 50°52’W 15 km2 750 m central-eastern region of Paraná
amide:bis-acrylamide 29:1) for 3 h at 200 V and stained with 20% silver nitrate. A 50-bp molecular ladder (Ludwig Biotecnologia, Ltda.) was used to deter-mine the molecular weight of the fragments.
Data analysis
All individuals were scored for the presence or ab-sence of AFLP bands (1 or 0) to construct a binary matrix. Only bands with molecular sizes between 100-700 bp and only those that could unequivocally scored for presence or absence across all individuals were considered for further analysis. The software dBoot v. 1.1 (Coelho, 2001) was used to estimate the coef-ficient of variation (CV) for the number of AFLP markers, generating a parameter that is capable of determining the reliability of the results obtained with our data. The percentage of polymorphic loci (Pp), Nei’s genetic diversity (HS; Nei, 1978), the Shannon index
(H’), genetic distance (Nei, 1972), and total heterozygosity (HT) were calculated, using POPGENE v. 1.31 (Yehet al.,
2000). To test for a correlation between genetic and geo-graphic distances, as well as for a correlation between frag-ment size and genetic diversity, the Pearson’s Linear Correlation and the Mantel Test were employed using the software BioEstat version 5.0 (Ayres et al., 2007) and
TFPGA version 1.3 (Miller, 1997), respectively. Analysis of molecular variance (AMOVA) was estimated using Arlequin v. 3.11 software (Excoffieret al., 2005) to
evalu-ate the distribu-tion of genetic variation within and among samples, as well as to estimate the FSTand pairwise Fst
in-dexes. A dendrogram was constructed by means of the UPGMA method implemented in POPGENE v.1.3.1 (Yeh
et al., 2000) and a bootstrap analysis was done utilizing
dBOOT v.1.1 software (Coelho, 2001). The software STRUCTURE version 2.3.3 (Hubiszet al., 2009) was used
to identify the number of similar population clusters (K).
The analysis of the number of clusters was performed using the admixture model with a burn-in and run lengths of 10,000 and 100,000 interactions, respectively. The number of clusters was determined following the guidelines of Prit-chard and Wen (2004) and Evanoet al.(2005), in the online
software Structure Harvester (Earl and vonHodt, 2012).
Results and Discussion
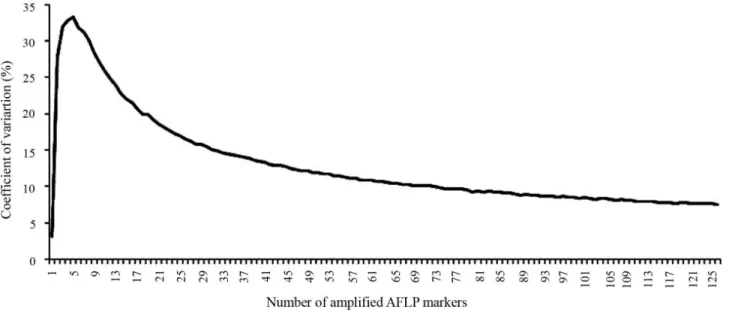
Five selective AFLP primers generated 126 polymor-phic markers with an average of 25.2 markers per pairwise combinations in 159 individuals that belonged to the eight populations ofP. rigida. TheEcoRI-ACG/MseI-CAG and EcoRI-ACG/MseI-CAT combinations generated the
high-est (28), and theEcoRI-ACG/MseI-CTA combination the
lowest numbers of well defined markers (20). The coeffi-cient of variation calculated for the total number of markers was 7.47%, indicating that the number of markers was suf-ficient to perform the analysess of genetic structure and di-versity (Figure 2).
So as to verify whether fragmentation had impacted the genetic variability of the populations ofP. rigidawe
calculated the percentage of polymorphic loci (Pp), Nei’s gene diversity (Hs) and the Shannon- Wiener index (H’), as well as the total heterozygosity (Ht; Table 2). The percent-age of polymorphic loci, Nei’s gene diversity and Shan-non-Wiener index for all populations were Pp = 60.4, Hs = 0.217, and H’ = 0.322. When comparing these with the genetic diversities found in other tropical tree species, such as Hagenia abyssinica(Hs = 0.30; Feyissa et al., 2007), Cedrela odorata(Hs = 0.17; Torreet al., 2008),Aeghilla sellowiana(Hs = 0.10; Medriet al., 2010) and four other
tropical tree species studied by Nybom et al. (2004)
(Hs = 0.22), we concluded that most populations of P. rigidastill preserve moderate levels of genetic diversity.
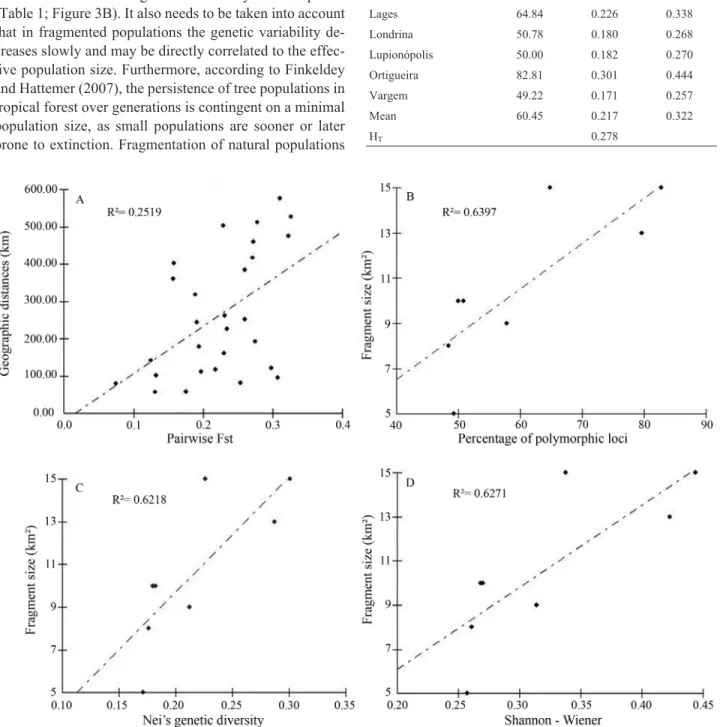
The populations of Curiúva and Vargem (Table 2) showed the lowest percentage of polymorphic loci (Pp = 48.44 and Pp = 49.22), Nei’s gene diversity (Hs = 0.176 and Hs = 0.171) and the Shannon-Wiener index (H’ = 0.261 and H’ = 0.257). On the other hand, the popula-tions of Ortigueira and Irati showed higher values for these genetic parameters (Pp = 82.81 and Pp = 79.69; Hs = 0.301 and Hs = 0.287; H’ = 0.444 and H’ = 0.423, respectively). When comparing the genetic variability of a fragment with their respective sizes a significant correlation between these factors was observed, illustrating the impact of forest cover reduction on the genetic variability of this species (Table 1; Figure 3B). It also needs to be taken into account that in fragmented populations the genetic variability de-creases slowly and may be directly correlated to the effec-tive population size. Furthermore, according to Finkeldey and Hattemer (2007), the persistence of tree populations in tropical forest over generations is contingent on a minimal population size, as small populations are sooner or later prone to extinction. Fragmentation of natural populations
can lead to evolutionary constraints due to loss of genetic variability (Frankham, 1996; Young et al., 1996). These
changes are reflected in the processes of genetic drift and
Table 2- Measures of genetic variability eight populations ofP. rigidaby AFLP markers. Pp: percentage of polymorphic loci; Hs: Nei’s gene diver-sity; H’: Shannon-Wiener index; HT: total heterozygosity.
Populations Pp HS H’
Cornélio Procópio 57.81 0.212 0.314
Curiúva 48.44 0.176 0.261
Irati 79.69 0.287 0.423
Lages 64.84 0.226 0.338
Londrina 50.78 0.180 0.268
Lupionópolis 50.00 0.182 0.270
Ortigueira 82.81 0.301 0.444
Vargem 49.22 0.171 0.257
Mean 60.45 0.217 0.322
HT 0.278
gene flow, which determine the degree of genetic diversity of the species (Couvet, 2002). Such effects can be observed in the populations ofP. rigida, where the populations
lo-cated in smaller fragments showed an accentuated loss of genetic variability (Tables 1 and 2; Figure 3B, C and D) when compared to the populations present in the larger fragments.
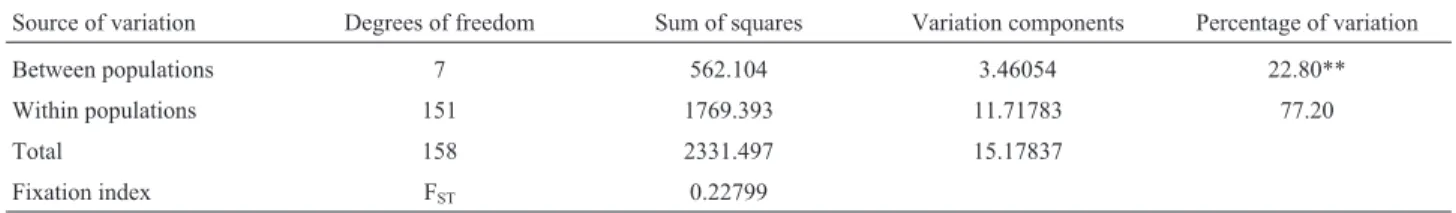
The analysis of molecular variance (AMOVA, Ta-ble 3) showed that 72.2% of the genetic variability is dis-tributed within and 22.8% between populations. The Fst value (0.228) indicates a moderate to high genetic variation among populations, which is characteristic of allogamous tree species (Wright, 1969; Hamricket al., 1992) such asP. rigida(monoecious with selfincompatibility). Such
distri-bution of the genetic variability was also observed by Ma-riot (MaMa-riot A, 2000, MSc Dissertation, Universidade Federal de Santa Catarina, Florianópolis, Brazil) when ana-lyzing four populations ofPiper cernuum(Fst = 0.29), a
species that has a similar reproductive biology asP. rigida.
In a further comparison of our results with other studies with natural tropical populations (Paiva, 1998) we ob-served that most of these species preserve high within pop-ulation genetic variability as observed inP. rigida.
In the analysis of pairwise Fst (Table 4), the popula-tions of Lages and Vargem (80 km apart) showed the low-est genetic distance (Fst = 7.43%) while the populations of Vargem and Lupionópolis (526 km apart) exhibited the greatest genetic distance (Fst = 32.62%). The populations of Cornélio Procópio and Londrina that are distant from
each other by only 58 km and the populations of Lupio-nópolis and Londrina, distant by 81 km, showed a Fst = 17.55% and 25.36%, respectively. Interenstingly however, the populations of Ortigueira and Lages, sepa-rated by a geographic distance of 403 km, showed a pairwise Fst of only 15.78%. These results show (Table 4) that there is no perfect correlation between the geographic and genetic distances (r = 0.459, Figure 3A), an explanation being the different fragmentation intensities that occurred in these areas. Historically, the drastic reduction of the At-lantic Rainforest occurred at different periods in the areas covered by this biome. In the plateau of Santa Catarina, this event began in the second half of the twentieth century (Vibranset al., 2008), whereas in Paraná, forest
fragmenta-tion started in the decade of 1910 and became intensified in the 1950s (Medeiroset al., 2005).P. rigidalives around
100 years and flowering occurs around ten years of age. In our samples we collected genetic material from individuals that were already in the reproductive age, with at least one flowering time before sampling. This procedure made it possible to collect only individual that contributed to the real effective population size, even though samples were comprised of individual from many different generations.
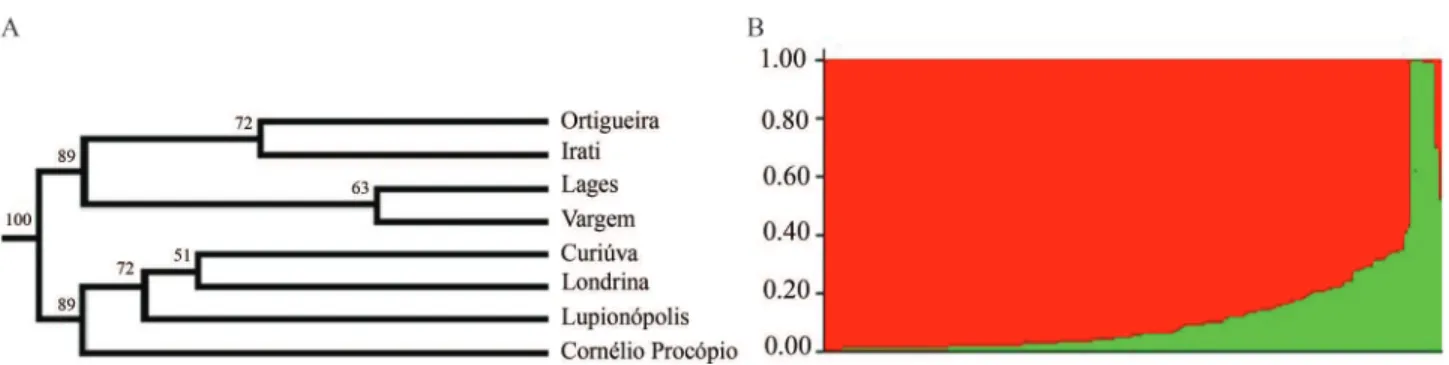
We constructed a dendrogram using Nei’s genetic distances (1978) and th UPGMA method (Figure 4A), showing the separation of two groups that were further con-firmed by a Bayesian analysis for the K number of clusters (Figure 4B). One group was formed by the populations that exhibited the lowest genetic diversity (Curiúva, Londrina,
Table 3- Analysis of molecular variance (AMOVA) using AFLP markers for eight populations ofP.rigidadistribuited in southern Brazil.
Source of variation Degrees of freedom Sum of squares Variation components Percentage of variation
Between populations 7 562.104 3.46054 22.80**
Within populations 151 1769.393 11.71783 77.20
Total 158 2331.497 15.17837
Fixation index FST 0.22799
p < 0.01 (significance test from 1023 permutations).
Table 4- Correlation matrix of geographical distances (km) between the populations studied, above the diagonal, and FSTvalues between pairs of
popula-tions ofP.rigidabelow the diagonal. All FSTvalues were significant (p < 0.05) with 1023 permutations.
Populations** CP C I LA LO LU O V
CP - 96 252 512 58 121 118 476
C 0.30743 - 160 417 111 193 57 385
I 0.25978 0.22969 - 261 244 318 142 226
LA 0.27783 0.27165 0.23089 - 504 576 403 80
LO 0.17554 0.19758 0.19122 0.22862 - 81 101 460
LU 0.29822 0.27479 0.18876 0.31035 0.25363 - 178 526
O 0.21740 0.13149 0.12501 0.15784 0.13244 0.19388 - 361
V 0.32275 0.32275 0.23457 0.07435 0.27221 0.32621 0.15740
Lupionópolis, and Cornélio Procópio), and a second group that was formed by the populations with the highest genetic diversity (Ortigueira, Irati and Lages), with the exception of the population of Vargem that was also present in this second group. The fact that a population such as Vargem, that has the lowest values for genetic diversity, clustered very closely with a population such as Lages, that presents higher levels of genetic diversity, may be explained by the fact that these populations are historically related and formed a continuous forest until very recently (around the 1950s), and even though the fragment with population of Vargen was highly degraded, it still shares much of its ge-netic diversity with the population of Lages.
It was also possible to note that the populations with the highest genetic diversity are more closely related to each other (Figure 4A), and that the populations with the lowest genetic diversity, that formed a group (with the ex-ception of Vargem), are very distant from each other even within their group. Such a within group distance might be related to the process of genetic erosion that occurred in these populations, and which is well known to increase ge-netic distances among natural populations.
From this it is possible to conclude that the size of the forest remnants is directly related to the capacity of main-taining higher level of genetic diversity, and that according to Holsinger (2000), a reduced genetic variation in small populations is likely a symptom of endangerment, and that such populations require immediate management to avoid the extinction of local populations. Though reforestation ef-forts do occur for this species, these are still few and nowhere close to these areas that are considered natural reservoir of genetic variation for this and many other tree species.
Acknowledgments
We thank the Coordenação de Aperfeiçoamento de Pessoal de Nível Superior (CAPES) for a scholarship granted to LBS and the Conselho de Desenvolvimento Científico and Tecnológico (CNPq, grant 478179/06-5) and Fundação Araucária for financial support.
References
Ayres M, Ayres Júnior M, Ayres DL and Santos AS (2007) BioEstat: Aplicações Estatísticas nas Áreas das Ciências Bio-Médicas. Sociedade Civil Mamirauá, Belém, 324 pp. Botrel MCG, Souza AM, Carvalho D, Pinto SIC, Moura COM
and Estopa RA (2006) Caracterização genética de
Calophyllum brasilienseCamb. em duas populações de ma-ta ciliar. Rev Árvore 30:821-827.
Cândido JF (1974) Angico-vermelho. Folha Florestal. Viçosa, maio-junho, pp 1-5.
Coelho ASG (2001) DBOOT: Avaliação dos erros associados a estimativas de distâncias/similaridades genéticas através do procedimento de bootstrap com número variável de mar-cadores, versão 1.1. Departamento de Biologia Geral, Ins-tituto de Ciências Biológicas, Universidade Federal de Goiás Goiânia.
Couvet D (2002) Deleterious effects of restricted gene flow in fragmented populations. Conserv Biol 16:369-376. Da Silva DCG, De Carvalho MC, Medri C, Medri ME, Ruas CF,
Ruas EA and Ruas PM (2012) Genetic structure and diver-sity of Brazilian tree species from fragments and riparian woods. In: Çaliskan M (ed) Genetic Diversity in Plants. 1st
edition. Tech Open Sci, Croacia, pp 319-412.
Doyle JJ and Doyle JL (1987) A rapid DNA isolation procedure for small quantities of fresh leaf tissue. Photochem Bull 19:11-15.
Durigan G and Nogueira JC (1990) Recomposição de Matas Ciliares. Instituto Florestal, São Paulo, 14 pp.
Earl DA and von Holdt BM (2012) STRUCTURE HARVESTER: A website and program for visualizing STRUCTURE output and implementing the Evanno method. Conserv Genet Resourc 4:359-361
Evanno G, Regnaut S and Goudet J (2005) Detecting the number of clusters of individuals using the software STRUCTURE: A simulation study. Mol Ecol 14:2611-2620.
Excoffier L, Laval G and Schneider S (2005) Arlequin ver. 3.1: An integrated software package for population genetics data analysis. Evol Bioinform 1:47-50.
Fahrig L (2002) Effects of habitat fragmentation on the extinction threshold: A synthesis. Ecol Appl 12:346-353.
Feyissa T, Nybom H, Bartish IV and Welander M (2007) Analysis of genetic diversity in the endangered tropical tree species
Hagenia abyssinica using ISSR markers. Genet Resourc
Crop Evol 54:947-958.
Finkeldey R and Hattemer HH (2007) Tropical Forest Genetics. Springer-Verlag Berlin Heidelgerg, 315 pp.
Franco IJ and Fontana VL (1997) Ervas & Plantas: A Medicina dos Simples. Imprimax, Erechim, 177 pp.
Franklam R (1996) Relationship of genetic variation to population size in wildlife. Conserv Biol 10:1500-1508.
Fundação SOS Mata Atlântica and Instituto Nacional de Pes-quisas Espaciais (2002) Atlas da Evolução dos Remanes-centes Florestais e Ecossistemas Associados no Domínio da Mata Atlântica no Período 1995-2000. SOS Mata Atlân-tica/INPE/ISA, São Paulo.
Hamrick JL, Godt MJW and Sherman-Broyles S (1992) Factors influencing levels of genetic diversity in woody plant spe-cies. New Forests 6:95-124.
Heywood VH and Stuart SN (1994) Species extinctions in tropical forests. In: Whitmore TC and Sayer JA (eds) Tropical De-forestation and Species Extintion. Chapman & Hall, New York, pp 91-114.
Holsinger KE (2000) Demography and extinction in small popu-lations. In: Young AG, Clark GM (eds) Genetics, Demogra-phy and Viability of Fragmented Populations. Cambridge University Press, Cambridge, pp 55-74.
Kageyama PY (1992) Recomposição da vegetação com espécies arbóreas nativas em reservatórios de usinas hidrelétricas da CESP. Série Técnica IPEF 8:1-43.
Korbes CV (1995) Manual de Plantas Medicinais. 48thedition.
Grafit, Francisco Beltrão, 188 pp.
Hubisz JM, Falush D, Stephens M and Pritchard JK (2009) In-ferring weak population structure with the assistance of sample group information. Mol Ecol Resourc 9:1322-1332. Lorenzi H (2002) Árvores Brasileiras: Manual de Identificação e Cultivo de Plantas Arbóreas Nativas do Brasil. Instituto Plantarum de Estudos da Flora LTDA, Nova Odessa, 384 pp.
Medeiros J de D, Savi M, De Brito BFA (2005) Seleção de áreas para criação de unidades de conservação na floresta ombró-fila mista. Biotemas 18:33-50.
Medri C, Ruas EA, Ruas CF, Medri PS, Medri ME and Ruas PM (2011) Population genetic structure of the tropical tree spe-cies Aegiphylla sellowiana (Lamiaceae) Genet Mol Res
10:3186-3198.
Myers N, Mittermeier RA, Mittermeier CG, Fonseca GAB and Kent J (2000) Biodiversity hotsposts for conservation priori-ties. Nature 403:853-858.
Nei M (1972) Genetic distance between populations Am Nat 106:283-292.
Nei M (1978) Estimation of average heterozygosity and genetic distance from a small number of individuals. Genetics 89:583-590.
Nybom H (2004) Comparison of different nuclear DNA markers for estimating intraspecific genetic diversity in plants. Mol Ecol 13:1143-1155.
Paiva JR (1998) Melhoramento Genético de Espécies Agroindus-triais na Amazônia: Estratégias e Novas Abordagens.
Em-brapa-SPI, Brasília and Embrapa-CNPAT, Fortaleza, 135 pp.
Torre A, López C, Yglesias E and Cornelius JP (2008) Genetic (AFLP) diversity of nine Cedrela odoratapopulations in
Madre de Dios, southern Peruvian Amazon. Forest Ecol Manag 255:334-339.
Turner IM and Corlett RT (1996) The conservation value of small, isolated fragments of lowland tropical rain forest. Trees 11:330-333.
Vaccaro S, Longhi SJ and Brena DA (1999) Aspectos da compo-sição florística e categorias sucessionais do estrato arbóreo de três subseres de uma floresta estacional decidual, no município de Santa Tereza - RS. Ciênc Florestal 9:1-18. Vibrans AC, Uhlmann A, Sevegnani L, Marcolin M, Nakagima
N, Grippa CR, Brogni E and Godoy MB (2008) Ordenação dos dados de estrutura da floresta ombrófila mista partindo de informações do inventário florístico-florestal de Santa Catarina: Resultados de estudo-piloto. Ciênc Florestal 18:511-523.
Vos P, Hogers R, Bleeker M, Reijans M, Van De Lee T, Hornes M, Frijters A, Pot J, Peleman J, Kuiper M, et al.(1995) AFLP: A new technique for DNA fingerprinting. Nucleic Acids Res 23:4407-4414.
Wilson EO and Frances MP (1997) Biodiversidade. 2nd edition. Editora Nova Fronteira, Rio de Janeiro, 657 pp.
Wright S (1969) Evolution and the Genetics of Populations. The Theory of Gene Frequencies. University of Chicago Press, Chicago, 520 pp.
Yeh F, Rongcal Y and Boyle T (2000) POPGENE 1.32: A free program for the analysis of genetic variation among and within populations using co-dominant and dominant mark-ers. Department of Renewable Resources at the University of Alberta, Alberta.
Young A, Boyle T and Brown T (1996) The population genetic consequences of habitat fragmentation for plants Trends Ecol Evol 11:413-418.
Internet Resources
Miller M (1997) Tools for population genetic analyses (TFPGA) 1.3: A Windows program for the analysis of allozyme and molecular population genetic data. Department of Fisheries and Wildlife. http://bioweb.usu.edu/mpmbio/index.htm. (accessed 02/07, 2013)
Pritchard JK and Wen W (2004) Documentation for the
STRUCTURE software version 2.3.3.
http://pritch.bsd.uchicago.edu/structure_software/re-lease_versions/v.2.3.4/html/structure.html (accessed 02/07, 2013).
Associate Editor: Everaldo Gonçalves de Barros