Genetic structure analysis of
Eufriesea violacea
(Hymenoptera, Apidae)
populations from southern Brazilian Atlantic rainforest remnants
Silvia H. Sofia
1, Francine M. de Paula
1, Aline M. dos Santos
2, Fernanda S. Almeida
1and Leda M.K. Sodré
11
Universidade Estadual de Londrina, Centro de Ciências Biológicas, Departamento de Biologia Geral,
Londrina, Paraná, Brazil.
2Universidade de São Paulo, Faculdade de Medicina de Ribeirão Preto, Departamento de Genética,
Ribeirão Preto, SP, Brazil.
Abstract
Random amplified polymorphic DNA (RAPD) markers were used to analyze the genetic structure ofEufriesea violaceapopulations in three fragments (85.47, 832.58 and 2800 ha) of Atlantic rainforest located in the north of the
Brazilian state of Paraná. A total of twelve primers produced 206 loci, of which 129 were polymorphic (95% criterion). The proportions of polymorphic loci in each population ranged from 57.28% to 59.2%, revealing very similar levels of genetic variability in the groups of bees from each fragment. Unbiased genetic distances between groups ranged from 0.0171 to 0.0284, the smallest genetic distance occurring between bees from the two larger fragments. These results suggest that theE. violaceapopulations from the three fragments have maintained themselves genetically
similar to native populations of this species originally present in northern Paraná.
Key words:euglossine bees, euglossina, rainforest fragments, genetic variability, RAPD.
Received: June 7, 2004; Accepted: April 18, 2005.
Euglossines are relatively long-tongued bees, com-monly showing a bright metallic blue, green or bronze in-tegument, and are found exclusively in Neotropical America (Dressler, 1982; Cameron, 2004). Male euglossines are not tied to a nest but leave it upon hatching (Dodson, 1966; Dressler, 1982) and both female and male euglossine bees often fly long distances between dispersed resources, making them especially important in cross-pollination of widely scattered plant species in tropical for-ests (Janzen, 1971). However, some studies have shown that habitat fragmentation may adversely affect populations of such pollinators and evidence suggests that in isolated Brazilian rainforest fragments there has been a decline in the number of males in some euglossine species (Powell and Powell, 1987; Beckeret al., 1991). Furthermore,
de-spite being able to fly long distances in continuous forest, deforested areas only 100 m wide have created barriers to the movement of some euglossine species (Powell and Powell, 1987).
It is known that genetic variability can be substan-tially reduced in small and isolated populations through
ge-netic drift and inbreeding, resulting in the loss of alleles and a decline in heterozygosity. Such reductions may result in decreased fitness and the eventual extinction of populations (Fergunsonet al., 1995). Thus, it is now widely appreciated
that understanding patterns of genetic variation is critically important for the conservation of threatened species (Allnutet al., 2003).
During the past thirty years, advances in molecular technology have greatly increased the number of DNA-based markers capable of revealing genetic variation in a wide range of species. Random amplified polymorphic DNA (RAPD) analysis, a simple and straightforward PCR-based technique (Williamset al., 1990), employs a
class of markers increasingly used to evaluate genetic vari-ability and structure in a variety of organisms (Kimberling
et al., 1996; Almeidaet al., 2001; Allnuttet al., 2003).
Despite the recognized importance of euglossine bees as Neotropical pollinating agents, little is yet known about the genetic variability and structure of populations of these bees inhabiting forest fragments.
A number of studies carried out in remnants of Atlan-tic rainforest in southeastern Brazil have revealed variation in the frequencies of males belonging to the euglossine bee species Eufriesea violacea (Blanchard) (Rebêlo and Garófalo, 1991; Garófaloet al., 1998; Jesus and Garófalo, www.sbg.org.br
Send correspondence to Silvia Helena Sofia. Universidade Esta-dual de Londrina, Centro de Ciências Biológicas, Departamento de Biologia Geral, Caixa Postal 6001, 86051-990 Londrina, Paraná, Brazil. E-mail: [email protected].
2000), a very seasonal species of bees mainly found in south and southeastern Brazilian Atlantic rainforest (Wittmann et al., 1989; Rebêlo and Garófalo, 1991;
Peruquetti and Campos, 1997). Sofia and Suzuki (2004) have reported that a reduction in fragment size negatively affected the frequency ofE. violaceamales.
During the research presented in this paper we studied
E. violaceain terms of its possible sensitivity to
environ-mental disturbances, because changes in the relative abun-dance of individuals could be the result of species susceptibility to environmental stress. The aim of our study was to use RAPD markers to investigate the genetic vari-ability and structure ofEufriesea violaceapopulations
oc-curring in three southern Brazilian Atlantic rainforest remnants.
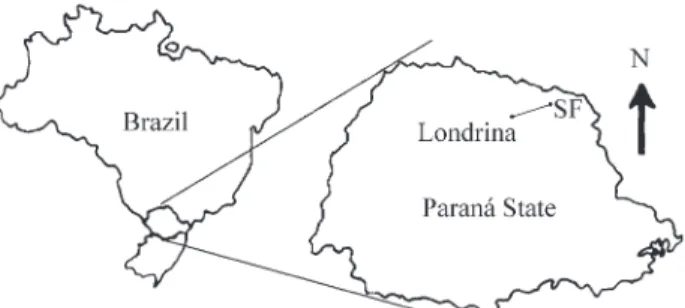
Samples were collected in three Brazilian Atlantic rainforest remnants (all public reserves) composed of sub-tropical semi-deciduous vegetation (Fernandes and Bezerra, 1990), which were located in the north of the southern Brazilian state of Paraná (Figure 1).
Godoy Forest State Park (GF fragment) lies within the Londrina municipal boundary (23°27’ S, 51°15’ W) about 15 km from the center of the city of Londrina and consists of a 580 ha area of very well-preserved native veg-etation continuous with another native forest fragment con-sisting of about 2200 ha situated outside the protected area of the Park but making an effective total fragment area of about 2800 ha of forest.
Arthur Thomas Municipal Park (AT fragment) com-prises an 85.47 ha area of secondary vegetation (produced by intense anthropogenic interference) in the urban center of Londrina 14.2 km from the GF fragment.
The São Francisco State Park (SF fragment) is an 832.58 ha rainforest fragment located between the districts of Cornélio Procópio (23°09’10” S, 50°36’10” W) and Santa Mariana (23°14’00” S, 50°31’00” W) about 60 km from the GF and AT fragments and is, like the GF fragment, well preserved.
All three fragments show signs of past and present anthropogenic disturbance, with both the GF and SF frag-ments being surrounded by agricultural crops and the AT fragment being situated inside an urban park.
Bees were sampled in November and December of 2001 and 2002, between 10:00 a.m. and 1:00 p.m., when euglossine males are most active (Ackerman, 1983; Powell and Powell, 1987; Santos and Sofia 2002). Male euglossines were collected with an insect net when they were attracted to eucalyptol and vanillin chemical baits consisting of 5 cm diameter balls of absorbent paper satu-rated with one of the fragrances and placed at the edge of forest about 4 m apart and 1.5 m above the ground, the bait chemicals being replenished every hour to prevent volatil-ity losses (Santos and Sofia 2002).
Forty-five males were collected, 15 from each forest fragment, placed in plastic tubes, transported alive to the laboratory and kept frozen (-20 °C) until needed for DNA extraction. The bees were identified by one of the authors (S.H. Sofia) and voucher specimens deposited at the Zool-ogy Museum of Londrina State University (UEL, Londrina Paraná, Brazil).
Total genomic DNA was extracted from each bee by a modification of the method of Raeder and Broda (1985). Each bee was separately ground into a fine powder using liquid nitrogen and a mortar and pestle, the powder subse-quently being homogenized in a microcentrifuge tube con-taining 700mL of extraction buffer (1% sodium dodecyl
sulfate, 200 mM Tris-HCl, 250 mM NaCl, 25mM EDTA, pH 8.0) and 5mL of proteinase K (20mg.mL-1) and then
in-cubated for 2 h at 64 °C. After incubation genomic DNA was extracted with an equal volume of phenol, followed by phenol/chloroform/isoamyl alcohol (25:24:1, v:v:v) and then chloroform/isoamyl alcohol (24:1 v:v) which was then mixed and centrifuged at 10,000 g for 10 min. After centrifugation the DNA was precipitated from the supernatant with two volumes of ice-cold ethanol and 10% by volume of 3 M NaCl and pelleted at 13,000 g for 15 min, washed with 100mL of 70% ethanol, dried at room
temper-ature and re-suspended in 100 mL of TE buffer (10 mM
Tris, 1 mM EDTA pH 8.0). The DNA concentration was determined in a 200 DyNA Quant fluorometer (Hoefer) us-ing the dye Hoechst 33258, all DNA samples beus-ing diluted to a standard concentration of 5 ngmL-1. All isolated DNA
was either used immediately or stored at -20 °C.
The RAPD profiles were generated from total genomic DNA as described by Williamset al.(1990). Final
reaction volumes were 15mL and contained 15-25 ng of
template DNA, 250 mM dNTP (Pharmacia), 0.3 mM of
ten-nucleotide primer (Operon Technologies, Alameda, CA, USA), 4.0 mM MgCl2and 1 U of DNA polymerase (Biotools) in the reaction buffer supplied. The RAPD tech-nique is sensitive to changes in reaction conditions (e.g. primer, MgCl2, dNTP concentrations etc), so exactly the same reaction conditions were used for all samples. From primer kits OPC, OPW, OPAM, a total of 40 different decamer primers were initially screened with a subset ofE. violaceaDNA samples for the production of clear RAPD
profiles. Control reactions were run containing all compo-nents except genomic DNA and none of the 12 primers used yielded detectable amplified products. DNA amplifi-cations were carried out at in a PTC-100 thermocycler (MJ Research Inc.) and the amplification protocol consisted of 4 min denaturation at 92 °C followed by 40 cycles of 40 s at 92 °C, 1.5 min at 40 °C, and 2 min at 72 °C with a final step of 5 min at 72 °C.
Samples (15mL) of the amplification products were
separated by electrophoresis on 1.4% agarose gels using TBE buffer (0.89 mM Tris, 0.89 mM boric acid, 2 mM EDTA pH 8.3) diluted 1:20 (v:v), run at 3 V.cm-1, stained with ethidium bromide and photographed under UV light using a Kodak T-Max 100 film.
The RAPD marker profiles were determined by di-rect comparison of the amplified electrophoretic DNA profiles from each individual. Samples of all individuals from each forest fragment were placed on the same agarose gel, so as to make an inter-population compara-tive analysis. Amplified DNA marker bands were scored in a binary manner as either present (1) or absent (0) and entered into a binary data matrix. Only RAPD bands that could be unequivocally scored were counted in the analy-sis. Each locus was treated as a two-allele system, with only one of the alleles per locus being amplifiable by the PCR. It was also assumed that marker alleles from differ-ent loci did not co-migrate to the same position on a gel, and that populations were under the Hardy-Weinberg equilibrium (Lynch and Milligan, 1994).
A pair-wise similarity matrix was constructed using the Jaccard (J) index (Sneath and Sokal, 1973). On the basis of theJ-values of the samples the unweighted pair group method with averages (UPGMA) clustering method was
adopted and the NTSYS-PC package (Rohlf, 1992) used to generate a similarity dendrogram.
The TFPGA 1.3 software (Miller, 1997) was used to calculate the following: genetic variability as estimated from the proportion of polymorphic loci (P) using the 95%
criterion; average heterozygosity (He), which estimates the
frequency of heterozygotes in a population and is also a measure of genetic variability; Nei’s genetic distance and identity (Nei, 1978); and Fisher’s exact test, applied to the differences in marker frequencies between pairs of popula-tions (the standard error was calculated using 100 batches of 1,000 permutations per batch and 2000 de-memorization steps).
Genotypic diversity between populations was tested by applying theG-test to allele frequencies at the loci, using
the population genetics package POPGENE 1.31 (Yehet al.,
1997). To get a clear overall picture of theG-test results we
calculated the `proportion of significance’, defined as the number of RAPD loci with significant (p = 0.05%)G-test
differences between allele frequencies in different popula-tions divided by the total number of polymorphic loci.
Twelve of the 40 primers screened produced clear RAPD patterns consisting of a total of 206 loci, 129 of which were polymorphic (95% criterion). A RAPD electro-phoretic profile is shown in Figure 2, for one of the selected primers. The number of bands per primer varied from 11 to 25. No population-specific band was observed. Very simi-lar proportions of polymorphic loci (P) were found in the three populations: 57.28% (GF), 58.74% (SF) and 59.22 (AT), with an overall mean of 58.41%. The estimated of av-erage heterozygosity (He) for bees from the three areas were also very alike: 0.1924 (SF), 0.1959 (GF) and 0.1961 (AT), indicating similar levels of genetic variability.
Research on male euglossines in the Amazon Forest suggests that forest fragments of small sizes (< 100 ha) could compromise the survival of some euglossine species, which have declined in numbers of individuals after forest fragmentation (Powell and Powell, 1987). Although the smallest rainforest fragment (AT) studied by us was only about 84 haE. violaceamales from this fragment showed a
similar proportion of polymorphic loci to the other two rainforest fragments, suggesting that the size of the rain-forest fragments did not affect the genetic variability of the
E. violacea population living in them. Reinforcing this
idea, the estimated average heterozygosity (He) indicated
similar levels of genetic variability among the three popula-tions.
Euglossine bees are considered strong fliers, able to fly considerable distances across lakes and forests (Janzen, 1971; Dressler, 1982). A study by Murren (2002) at Panamá has shown that Eulaema cingulata (Fabricius)
from a mainland site visited bait traps on an island 500 m away. Also, a number of euglossine species have been ob-served moving between Brazilian rainforest remnants (Raw, 1989; Tonhascaet al., 2003), although other studies
carried out in Brazil have shown that males from some euglossine bee species do not cross the intervening matrix between forest fragments (Powell and Powell, 1987; Peruquettiet al., 1999).
Our estimates of Nei’s (1978) unbiased genetic dis-tances ranged from 0.0171 to 0.0284 and genetic identity from 0.9720 to 0.9831 (Table 1), the highest genetic iden-tity being between bees from the larger SF and GF frag-ments 60 Km apart. The highest genetic distance (0.284), and therefore the lowest genetic identity (0.9720), occurred between bees from the SF and AT fragments.
In our study, the values of Fisher’s exact test between pairs ofE. violaceapopulations from the three rainforest
fragments (SG-GF =172.41; SF-AT = 222.54; GF-AT = 219.27) indicated the there were no significant differences between pairwise populations (p > 0.05) and hence no ge-netic differentiation among the three populations. Also, the analysis of genotypic diversity by theG-test showed little
variation between groups of individuals from different fragments, with significance proportion values ranging from 11.38% (SF-AT) to 15.90% (GF-AT).
SinceE. violaceais a very seasonal euglossine
spe-cies with just one generation per year (Wittmann et al.,
1989; Peruquetti and Campos, 1997) it is possible that the three populations ofE. violaceastudied have maintained
themselves genetically similar to native populations origi-nally present in the tropical rainforest before fragmentation took place, this conjecture being reinforced by the fact that the genetic distance lowest value occurred between bees from the GF and SF fragments (Table 1).
Since male euglossines are not tied to a nest but leave it upon hatching, the occurrence of a single panmitic
E. violacea population among the three rainforest
frag-ments studied could also be due to the fact that males are able to move between nearby fragments. Our results ap-pear to support this hypothesis because the AT fragment population was more similar to the GF fragment popula-tion than to the SF populapopula-tion (Table 1), indicating that some bees could be migrating between the AT and GF fragments. Tonhasca et al. (2003) observed that male
euglossine bees were able to move within and between forest patches and proposed that the long-established frag-ments surrounding the larger forest remnant of Atlantic
Table 1- Unbiased Nei’s (1978) genetic distances (lower-left) and genetic identity (upper-right) between pairs of three Eufriesea violacea populations from São Francisco State Park (SF), Godoy’s Forest State Park (GF) and the Arthur Thomas Municipal Park (AT).
Population SF GF AT
SF - 0.9831 0.9720
GF 0.0171 - 0.9761
AT 0.0284 0.0242
rainforest were functionally connected with regard to euglossine bee dispersal.
TheE. violaceamales from the three rainforest
frag-ments showed a mean coefficient of similarity (calculated for all pair-wise comparisons) of 0.71, ranging from 0.91 between bees AT11 and AT15 (Figure 3), which exhibited very similar RAPD banding patterns, to about 0.62 for bees from more distantly-separated forest fragments (AT13 and SF4; GF13 and SF4). These results suggest only a moderate degree of genetic diversity among males of this species in the three forest remnants studied (Figure 3), and G-test
analysis of the genotypic diversity showing little variation between groups of individuals from different fragments lends support to this idea.
Overall, our results suggest that in spite of habitat fragmentation resulting from intense anthropogenic inter-ference to this Brazilian rainforestE. violaceapopulations
are maintaining satisfactory levels of genetic variability. Such findings may influence proposed strategies for con-servation of both these Neotropical pollinators and the At-lantic rainforest remnants of southern Brazil.
Acknowledgments
The authors are grateful to the Secretaria Municipal do Ambiente-Londrina (SEMA), Instituto Ambiental do Paraná (IAP) and the Instituto Brasileiro do Meio Am-biente e dos Recursos Naturais Renováveis (IBAMA) for permission to collect bees and to the anonymous referees who contributed with valuable suggestions. This study was supported by grants from Fundação O Boticário de Pro-teção à Natureza (FBPN) - project n. 511/20012.
References
Ackerman JD (1983) Diversity and seasonality of male euglossine bees (Hymenoptera, Apidae) in Central Panama. Ecology 64:274-283.
Allnut TR, Newton AC, Premoli A and Lara A. (2003) Genetic variation in the threatened South American conifer
Pilgerodum uviferum(Cupressaceae), detected using RAPD
markers. Biol Conserv114:243-253.
Almeida FS, Fungaro MHP and Sodré LMK (2001) RAPD and isoenzyme analysis of genetic variability in three allied spe-cies of catfish (Siluriformes, Pimelodidae) from the Tibagi river, Brazil. J Zool 253:113-120.
Becker P, Moure JS and Peralta FJA (1991) More about Euglossine bees in Amazonian forest fragments. Biotropica 23:586-91.
Cameron SA (2004) Phylogeny and biology of Neotropical orchid bees (Euglossini). Ann Rev Entomol 49:377-404.
Dodson CH (1966) Ethology of some bees of the tribe Euglossini (Hymenoptera, Apidae). J Kansas Entomol Soc 39:607-629. Dressler RL (1982) Biology of orchid bees (Euglossini). Ann Rev
Ecol Sys 13:373-394.
Fergunson AJBT, Prodöhl PA, Mcmeel O, Thompson C, Stone C, Mcginnity P and Hynes RA (1995) The application of mo-lecular markers to the study and conservation of fish popula-tion, with special referenceSalmo. J Fish Biol 47:103-126.
Fernandes A and Bezerra P (1990) Estudo Fitogeográfico do Brasil. Stylus Comunicações, Fortaleza, 205 pp.
Garófalo CA, Camillo E, Augusto SC, Jesus BMV and Serrano JC (1998) Diversidade, abundância sazonal de Euglossini (Hymenoptera, Apidae) na Serra do Japi, Jundiaí, SP. Anais 3:72-79. IV Simpósio de Ecossistemas Brasileiros, Águas de Lindóia, Brazil.
Janzen DH (1971) Euglossine bees as long-distance pollinators of tropical plants. Science 171:203-205.
Jesus BMV and Garófalo CA (2000) Riqueza e abundância sazo-nal de Euglossini (Hymenoptera, Apidae) na Mata da Virgí-nia, Matão, São Paulo. Anais 4:239-245. Encontro Sobre Abelhas, Ribeirão Preto, Brazil.
Kimberling DN, Ferreira AR, Shuster SM and Keim P (1996) RAPD marker estimation of genetic structure among iso-lated northern leopard frog, populations in the south-western USA. Mol Ecol 5:519-529.
Lynch M and Milligan BG (1994) Analysis of population struc-ture with RAPD markers. Mol Ecol 3:91-99.
Maack R (2002) Geografia Física do Estado do Paraná. 3aedição.
Imprensa Oficial, Curitiba, 440 pp.
Miller MP (1997) Tools for population genetic analyses (TFPGA) 1.3: A Windows program for the analysis of allozyme and molecular population genetic data. Computer software dis-tributed by author.
Murren CJ (2002) Effects of habitat fragmentation on pollination: Pollinators, pollinia viability and reproductive success. J Ecol 90:100-107.
Nei M (1978) Estimation of average heterozygosity and genetic distance from a small number of individuals. Genetics 89:583-590.
Peruquetti RC and Campos LAO (1997) Aspectos da biologia de
Euplusia violacea (Blanchard) (Hymenoptera, Apidae,
Euglossini). Rev Bras Zool 14:91-97.
Peruquetti RC, Campos LAO, Coelho CDP, Abrantes CVM and Lisboa LCO (1999) Abelhas Euglossini (Apidae) de áreas de Mata Atlântica: Abundância, riqueza e aspectos bio-lógicos. Rev Bras Zool 16 (Supl. 2):101-118.
Powell AH and Powell GNN (1987) Population dynamics of male euglossine bees in Amazonian forest fragments. Biotropica 19:176-179.
Raeder U and Broda P (1985) Rapid preparation of DNA from fil-amentous fungi. Lett Appl Microbiol 1:17-20.
Raw A (1989) The dispersal of euglossine bees between isolated patches of eastern Brazilian wet forest (Hymenoptera, Apidae). Rev Bras Entomol 33:103-107.
Rebêlo JMM and Garófalo CA (1991) Diversidade e sazonalidade de machos de Euglossini (Hymenoptera, Apidae) e prefe-rências por iscas-odores em um fragmento de floresta no sudeste do Brasil. Rev Bras Biol 51:787-799.
Rohlf FJ (1992) NTSYS-pc Numeral taxonomy and multivariate analysis system. Exeter Software, Applier Biostatistics, NY, 225 pp.
Santos AM and Sofia SH (2002) Horário de atividade de machos de Euglossinae (Hymenoptera, Apidae) em um fragmento de floresta semidecídua no norte do estado do Paraná. Acta Scientiarum 24:375-381.
Sofia SH and Suzuki KM (2004) Comunidades de abelhas Euglossina (Hymenoptera, Apidae) em fragmentos flores-tais no sul do Brasil. Neotrop Entomol 33:693-702.
Tonhasca A, Albuquerque GS and Blackmer JL (2003) Dispersal of euglossine bees between fragments of the Brazilian At-lantic Forest. J Trop Ecol 19:99-102.
Williams JGK, Kubelik AR, Livak KL and Tingey SV (1990) DNA Polymorphism amplified by arbitrary primers are use-ful as genetic markers. Nucl Acids Res 18:6531-6535.
Wittmann D, Radtke R and Blochtein B (1989) Seasonality and seasonal changes in preferences for scent baits inEuplusia violacea in Rio Grande do Sul/Brazil. Entomol Gen
14:217-221.
Yeh FC, Yang R-C, Boyle TBJ, Ye Z-H and Mao JX (1997) POPGENE, the user-friendly shareware for population ge-netic analysis. Molecular Biology and Biotechnology Cen-tre, University of Alberta, Canada. Available at http://www.ualberta.ca/~fyeh/faq.htm