INTRODUCTION
Goats were first introduced to Brazil by the Portu-guese settlers. Today it is difficult to identify the origins of the populations, and one may ask how closely the Brazilian animals are to their origins. The nomenclature “undefined breed” (UDB) represents approximately 95% of the present total Northeast Brazilian goat population (Programa, 1979). The UDB concept is not recognized as a breed by the Min-istry of Agriculture in Brazil; however, these animals rep-resent a “criole” or mixture of breeds. As the name sug-gests, this population is not standardized.
Using genetic distances, it is possible to evaluate the degree of genetic similarity between two populations by measuring the probability of one or more characters ap-pearing in one of the populations but not in the other (Sournia, 1991). In the calculation of distances from the allelic frequencies, Nei’s genetic distance method is unique in having an evolutionary meaning. Since this dis-tance has been intensively examined at the statistical level, it is frequently chosen. The genetic distance method de-veloped by Nei (1972) is the distance among vectors of the allelic frequencies xi and yi:
D = -Log cos θ, where θ = arc cos ∑ (xiyi )1/2. In calculating the distance matrices by the unweighted pair group method of arithmetic averages, UPGMA, the most similar populations are found and grouped. Next, each new distance is obtained by dividing the mean weight by the number of populations considered. This process is re-peated until all populations are regrouped into one hypo-thetical population. It is possible to convert a distance
matrix, once elaborated, into a tree for visualizing the similarity among the organisms.
The objective of this study was to evaluate the pos-sibility of identification of the origins of the traditional goat population in Brazil. The importance of the work is historical and it involves an identification of the genetic resources available and the intrinsic characteristics of the genetic sources involved.
MATERIAL AND METHODS
Allelic frequencies of phenotypic traits were com-pared to determine the genetic distances between northeast-ern Brazilian goats and Mediterranean goat populations.
Populations or taxons compared
European Mediterranean goats had already been stud-ied at the time of the 47th French Conference Institut Na-tional de la Recherche Agronomique (INRA) (Lauvergne, 1988). Data for these goats are available at the Laboratoire of Génétique Factorielle of INRA, in Jouy-en-Josas. Ani-mals from Greece (Macedonia), Bulgaria (Sakhar), Italy (Basilicata, Calabria, Sicily, Sardinia and Malta), France (Corsica, Haute Roya and Rove) and Spain (northern re-gion) were included. Data for these goats on Portuguese goats were not available.
Macedonia: A characteristic population from the Ceres
re-gion, Greece, in which individuals with long black hair pre-dominate. The animals analyzed belong to the Experimen-tal Farm of Salonika University (Boyazoglu et al., 1988).
Genetic distances and taxonomic trees between goats of Ceará State (Brazil)
and goats of the Mediterranean region (Europe and Africa)
Théa M.M. Machado1, Mohamed Chakir2 and Jean Jacques Lauvergne2
Abstract
Goats of an undefined breed (called UDB) from the State of Ceará, northeastern Brazil (N = 447), European Mediterranean goats (N = 3,847) and African Mediterranean goats (N = 325) were compared to establish genetic distances and taxonomic trees. Allelic frequen-cies in each population for presence or absence of the following traits were used: horns, reduced ears, long hair, wattles, beard, roan color, brown eumelanin and eumelanic standard pigmentation. The genetic distance, applying the method developed by Nei (1972), was: least between goats from different meso-regions of the State of Ceará (0.0008 to 0.0120); small between all UDB of Ceará and French goats of Rove and Haute Roya (0.0236 and 0.0459); greater between all UDB of Ceará and northern Spanish goats (0.1166), and greatest between all UDB of Ceará and northern African goats (Moroccan of Drâa, Rhâali and Zagora), Balkan goats (Sakhar from Bulgaria and Macedonia from Greece) and some insular Mediterranean populations (Corsica, Sicily and Sardinia), which ranged from 0.1237 to 0.2714. Brazilian UDB goats are more closely related to Continental and Western European populations than to North African, Balkan or Insular Mediterranean populations.
1Departamento de Produção Animal da Universidade Federal de Uberlândia, Caixa Postal 593, Campus Umuarama, 38400-902 Uberlândia, MG,
Brasil. Send correspondence to T.M.M.M. at Departamento de Zootecnia, UFV, 36571-000 Viçosa, MG, Brasil. E-mail: [email protected]
Sakhar: A characteristic population from the Sakhar hills,
Bulgaria, in which individuals with long black hair predomi-nate. The animals analyzed belong to a goat herd which is maintained for preservation of the local genetic resources (Djorbineva et al., 1988).
Basilicata, Calabria and Sicily: Most of the Italian goat
population is found in the southern part of the country and is characterized by strong genetic variability (Renieri et al., 1988).
Sardinia: Characterized by phenotypic variability, in spite
of local attempts to select for long hair (Branca and Casu, 1988).
Malta: Since 1940, goats from Malta have been
cross-bred with the Saanen race (Gruppetta et al., 1988).
Corsica: Goats from Corsica were recently crossbred
with modern races such as the Alpine (Franceschi and Santusi, 1988).
Haute Roya: Goats from the Haute Roya valley, in French
Maritime Alps, are raised in migratory mixed sheep and goat herds (Martrès and Benadjaoud, 1988).
Rove: Goats from French Provence traditionally followed
migratory sheep. There have been local attempts at race standardization (Sadorge and Benadjaoud, 1988).
Northern Spain: Most goats from northern Spain present
some phenotypic variability (Dunner and Cañon, 1988). The group of African Mediterranean goats was com-posed of three Moroccan populations. This data was un-published.
Drâa: Southern Moroccan goats are of a non-defined type.
The animals analyzed were from the Center for Goat Re-search and the Sidi Fleh village, located in Skoura.
Rhâali: A black goat from Morocco, probably the Atlas
Mountains. Its kinship to Mamber goats from the Middle East is arguable (Hossaini-Hilari and Benlamlih, 1995). The animals analyzed were from Zagora.
Zagora: A crossbred local population with Drâa goats. The
animals were from Demnate, Ouarzazate, Center for Goat Research located in Tahnnaout and the Marrakech region. Four sub-populations of Brazilian goats of undefined breed were selected according to their geographic loca-tions in the State of Ceará - UDB CE. The sub-popula-tions were identified as:
UDB N CE or UDB from northeastern Ceará:The
Na-tional Center for Goat Research of the Brazilian Enter-prise in Agricultural and Livestock Research (EMBRAPA/ CNPC) is located in this meso-region. CNPC works with both native and exotic goats. Initial work was with the main native breeds and the Indian Bhuj goats; today they use the Brazilian Moxotó breed, as well as Anglo-Nubian and Al-pine breeds. These recently introduced breeds may be in-fluencing the genetics of goats in this meso-region.
UDB M-E CE or UDB from middle-eastern Ceará: The
Enterprise for Agricultural and Livestock Research of Ceará State (EPACE) is located in this meso-region. EPACE works with Alpine, Anglo-Nubian and Canindé (a Brazilian goat). The largest goat fair of the State of Ceará
is also located in this meso-region. The resulting mixture of local goats with those from outside region may influ-ence local goat genetics.
UDB S CE or UDB from southern Ceará: This
meso-re-gion is the most isolated in the State of Ceará. It is humid and characterized by commercial agriculture with salaried workers. This system of production largely excludes inter-est in goat production.
UDB Fortaleza:This population, being very small in size,
was not examined separately from the others.
The sample population (UDB) in the State of Ceará totaled 447 animals from 21 herds. Goat herds were se-lected by the local development service. This method is applied when randomized choice is impossible (Gutierrez
et al., 1981). One municipality was chosen from each
ho-mogeneous micro-region defined by the Brazilian Insti-tute of Geography and Statistics (IBGE).
The sample was composed of 0.05% of the total regis-tered goats of the micro-region (IBGE, 1988), chosen from one or more herds. The size of the sample was determined to be adequate considering that one million goats are regis-tered in the State, an area of 145,000 km2. In the case that the herd chosen had more than enough goats for sampling, animals were chosen at random. Otherwise, all animals were chosen and others, selected at random from a second herd. Data from each micro-region were grouped by meso-re-gions (UDB M-E CE, UDB N CE and UDB S CE), except for those from Fortaleza due to its small registered goat herd. Data from all meso-regions, including Fortaleza, were grouped for the total sampling of the State (UDB CE).
Consideration of traits and alleles
Presence/absence of reduced ears: Ears
approxi-mately two centimeters in length, such as in the Lamancha breed. This trait is controlled by an autosomal locus with incomplete dominance. The ear length (EL) locus has the alleles reduced “R” and wild “+” (COGNOSAC, 1986).
Presence/absence of long hair: Long hair is due to
the presence of an autosomal locus with incomplete pen-etrance. The hair length (HL) locus has the alleles long “L” and wild “+” (Lauvergne and Howell, 1978; Lauvergne, 1988).
Presence/absence of horns: The hornless character
is due to the expression of a dominant autosomal locus. The hornless (Ho) locus has the alleles polled “P” and wild “+” (COGNOSAG, 1986).
Presence/absence of wattles: Wattles are due to a
dominant autosomal locus with variable expression. The wattles (Wa) locus has the alleles wattled “W” and wild “+” (Lauvergne, 1988).
Presence/absence of a beard: The beard is due to a
Presence/absence of roan color: Roan color is the
presence of white, black and red colors in the same hair due to an autosomal locus with incomplete dominance. The roan (Rn) locus has the alleles roan “R” and wild “+” (Queinnec and Queinnec, 1974; COGNOSAG, 1986).
Presence/absence of brown eumelanin: Brown
eumelanin is a modification of black eumelanin due to an autosomal locus, which is probably recessive. Its expres-sion gives a chocolate tonality which is fixed in the Toggenbourg breed. The brown (B) locus has the alleles wild “+” and brown “b” (Berge, 1967; COGNOSAG, 1989).
Presence/absence of eumelanic standard pigmen-tation: The locus Agouti controls the appearance of both
eumelanin (black or brown) and pheomelanin (red) in mam-mal hair. In goats the total number of alleles at this locus is unknown, but it is known that the allele called non-agouti
is recessive to the alleles phaeomelanic, wild, eumelanic
and tan and badger face (Searle, 1968; Lauvergne, 1993).
The locus Agouti (A) was considered to have the allele non-agouti “a” and any other allele different from “a”.
In this study Nei’s genetic distance method (Nei, 1972) was applied and the resulting values were used to construct “trees” as phenograms, designed by the unweighted pair grouping method of arithmetic averages (UPGMA). To obtain a representation of the concordant parts from several possible trees for a set of data, it is necessary to construct a “tree of consensus”. In this process, each consensual tree was obtained by the majority consensus method (or majority rule consensus tree). Monophyletic groups were present in at least 50% of the 500 trees which were possible for the data set (PHILIP, 1993).
There were no data available on the brown eumelanin character for Rove goats and all goats from northern Spain.
Thus, two sets of analyses were elaborated, one with 16 populations and 16 alleles and the other with 18 popula-tions and 14 alleles.
RESULTS
Allelic frequencies for each population (Table I) were used to obtain their genetic distances from each other (Table II) and the taxonomic trees (Figure 1) were subse-quently constructed. The shortest genetic distances ob-served were those among the different UDB populations from Ceará. The population from the Middle-Eastern meso-region was genetically differentiated from goats from other meso-regions in the State of Ceará.
UDB goats from Ceará were more closely related to Haute Roya and Rove goats (Continental European popu-lations) than goats from Drâa, Zagora, Sardinia, Sakhar, Sicily and Macedonia (North African, Insular and Balkan populations). The consensual tree of 16 populations was more accurate than that with 18 populations (more tax-ons, fewer characters). However, the latter allowed the inclusion of the Northern Spanish and Rove goats. The proximity relations of the trees should be interpreted as relationship since the phenetic method chosen itself pre-supposes a common affiliation.
DISCUSSION
The differences observed among goats from the inte-rior of the State of Ceará are probably due to different de-grees of crossbreeding in each meso-region. The genetic distance existing between UDB goats from Ceará and goats from northern Spain is greater than that between UDB goats
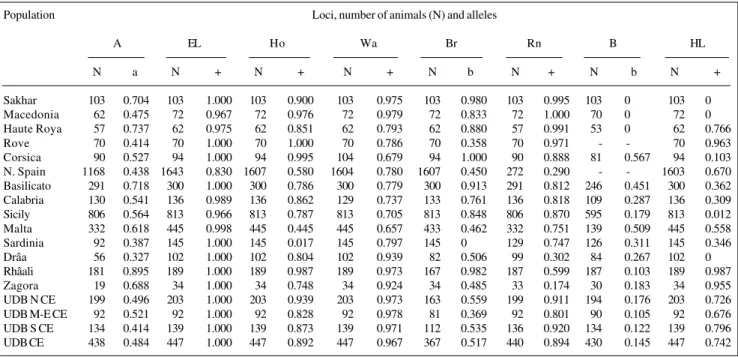
Table I - Gene frequencies used in calculating genetic distances (Nei, 1972) of the goat populations.
Population Loci, number of animals (N) and alleles
A EL Ho Wa Br Rn B HL
N a N + N + N + N b N + N b N +
Sakhar 103 0.704 103 1.000 103 0.900 103 0.975 103 0.980 103 0.995 103 0 103 0 Macedonia 62 0.475 72 0.967 72 0.976 72 0.979 72 0.833 72 1.000 70 0 72 0 Haute Roya 57 0.737 62 0.975 62 0.851 62 0.793 62 0.880 57 0.991 53 0 62 0.766
Rove 70 0.414 70 1.000 70 1.000 70 0.786 70 0.358 70 0.971 - - 70 0.963
from Ceará and goats from southern France. This is probably explained by the locus ear length. The allele which deter-mines short ears is normally rare, but it appears at a fre-quency of 0.17 in the Spanish goat population. In other words, 2.9% of all goats in northern Spain have reduced ears.
The number of times branches appeared at the same position on 500 trees, taken randomly, was occasionally superior to 80%. This happened, on the first tree, between Haute Roya goats and other populations and between Sakhar and Macedonia goats. On the second tree it hap-pened between Sardinia goats and other populations. It would be necessary to increase the number of traits ex-amined to increase reliability. It is suggested that future studies include the loci Spotting and Frosting as well as
certain quantitative traits such as facial profile (convex-ity), and biochemical and molecular markers.
In conclusion, the Brazilian UDB goats are more closely related to Continental and Western European popu-lations than to North African, Balkan or Insular Mediter-ranean populations.
ACKNOWLEDGMENTS
This work was supported by CNPq, EMBRAPA/CE-NARGEN and EMBRAPA/CNPCaprinos in Brazil and INRA, in France. Appreciation is extended to Dr. David G. Francis for assistance with the translation.
RESUMO
Foram comparadas cabras do tipo Sem Raça Definida ou UDB do Ceará (N = 447), nordeste do Brasil, cabras mediter-râneas européias (N = 3847) e meditermediter-râneas africanas (N = 325) visando o estabelecimento de distâncias genéticas e de árvores
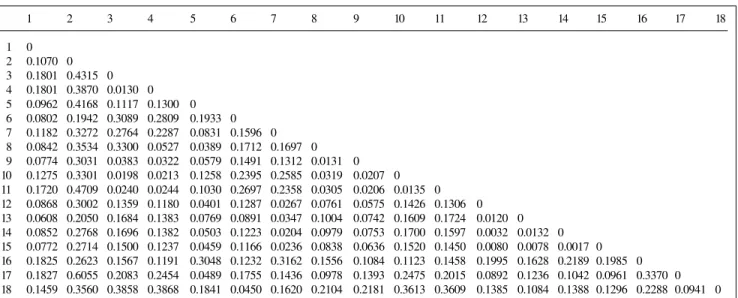
Table II - Matrix of genetic distances for the 18 goat populations, according to Nei (1972).
1 2 3 4 5 6 7 8 9 10 11 12 13 14 15 16 17 18
1 0 2 0.1070 0 3 0.1801 0.4315 0 4 0.1801 0.3870 0.0130 0 5 0.0962 0.4168 0.1117 0.1300 0 6 0.0802 0.1942 0.3089 0.2809 0.1933 0 7 0.1182 0.3272 0.2764 0.2287 0.0831 0.1596 0 8 0.0842 0.3534 0.3300 0.0527 0.0389 0.1712 0.1697 0 9 0.0774 0.3031 0.0383 0.0322 0.0579 0.1491 0.1312 0.0131 0 10 0.1275 0.3301 0.0198 0.0213 0.1258 0.2395 0.2585 0.0319 0.0207 0 11 0.1720 0.4709 0.0240 0.0244 0.1030 0.2697 0.2358 0.0305 0.0206 0.0135 0 12 0.0868 0.3002 0.1359 0.1180 0.0401 0.1287 0.0267 0.0761 0.0575 0.1426 0.1306 0 13 0.0608 0.2050 0.1684 0.1383 0.0769 0.0891 0.0347 0.1004 0.0742 0.1609 0.1724 0.0120 0 14 0.0852 0.2768 0.1696 0.1382 0.0503 0.1223 0.0204 0.0979 0.0753 0.1700 0.1597 0.0032 0.0132 0 15 0.0772 0.2714 0.1500 0.1237 0.0459 0.1166 0.0236 0.0838 0.0636 0.1520 0.1450 0.0080 0.0078 0.0017 0 16 0.1825 0.2623 0.1567 0.1191 0.3048 0.1232 0.3162 0.1556 0.1084 0.1123 0.1458 0.1995 0.1628 0.2189 0.1985 0 17 0.1827 0.6055 0.2083 0.2454 0.0489 0.1755 0.1436 0.0978 0.1393 0.2475 0.2015 0.0892 0.1236 0.1042 0.0961 0.3370 0 18 0.1459 0.3560 0.3858 0.3868 0.1841 0.0450 0.1620 0.2104 0.2181 0.3613 0.3609 0.1385 0.1084 0.1388 0.1296 0.2288 0.0941 0 1. Malta, 2. Sardinia, 3. Sakhar, 4. Macedonia, 5. Haute Roya, 6. N. Spain, 7. Rove, 8. Basilicato, 9. Calabria, 10. Sicily, 11. Corsica, 12. UDB N CE, 13. UDB M-E CE, 14. UDB S CE, 15. UDB CE, 16. Drâa, 17. Rhâali, 18. Zagora.
Figure 1 - Consensus taxonomic trees designed using Philip (1993), with 16
taxonômicas. Foram utilizadas as freqüências alélicas em cada população para a presença ou ausência dos caracteres cornos, orelhas reduzidas, pêlos longos, brincos, barba, pelagem ruão, eumelanina de coloração castanha e padrão pigmentar eumelânico. As distâncias genéticas segundo o método de Nei (1972) são: as menores entre as cabras de diferentes mesorregiões do Ceará (0,0008 a 0,0120); pequenas entre o conjunto das UDB do Ceará e as cabras francesas do Rove e do Alto Roya (0,0236 e 0,0459); grande entre o conjunto das cabras UDB do Ceará e as cabras do norte da Espanha (0,1166); as maiores entre o conjunto das cabras UDB do Ceará e as cabras norte-africanas (marroquinas do Drâa, Rhâali e Zagora), balcânicas (Sakhar da Bulgária e Macedônia da Grécia) e algumas populações insulares (Córsega, Sicília, Sardenha) mediterrâneas (0,1237 a 0,2714). As cabras brasileiras UDB estão mais aparentadas com as populações européias do oeste do continente do que com as populações caprinas norte-africanas, balcânicas ou mediterrâneas insulares.
REFERENCES
Asdell, S.A. and Buchanan-Smith, A.D. (1928). Inheritance of color, beard, tassels and horns in goats. J. Hered.19: 425-430.
Berge, S. (1967). À propos de la couleur des chèvres. Rev. Elev.22: 111-113, 117-124.
Boyazoglu, J.G., Hatziminaoglov, J. and Lauvergne, J.J. (1988). Profils
génétiques visibles de la chèvre Macédonienne. In: Populations Traditionnelles et Premières Races Standardisées d’Ovicaprinæ dans le Bassin Méditerranéen (Lauvergne, J.J., ed.). INRA, Paris, pp. 105-112 (Colloque INRA, 47).
Branca, A. and Casu, S. (1988). Profils génétiques visibles de la chèvre
Sarde. In: Populations Traditionnelles et Premières Races Standar-disées d’Ovicaprinæ dans le Bassin Méditerranéen (Lauvergne, J.J.,
ed.). INRA, Paris, pp. 135-143 (Colloque INRA, 47).
COGNOSAG (Committee on Genetic Nomenclature of Sheep and Goats)
(1986). Nomenclature génétique standardisée des ovins et des caprins. Lauvergne, J.J. (ed.). Proceedings of the Workshop, 1986, Manosque, Tec & Doc, Paris, p. 112.
COGNOSAG (Committee on Genetic Nomenclature of Sheep and Goats)
(1989). Loci pour la couleur de la robe des ovins et des caprins. Lauvergne, J.J. (ed.). Proceedings of the Workshop, 1988 et 1989, Manosque et Oregon, p. 84.
Djorbineva, M.K., Alexieva, S.A., Hinkovski, T. and Lauvergne, J.J. (1988). Profils génétiques visibles de la chèvre du Sakhar en Bulgarie. In:
Populations Traditionnelles et Premières Races Standardisées d’Ovicaprinæ dans le Bassin Méditerranéen (Lauvergne, J.J., ed.).
INRA, Paris, pp. 97-104 (Colloque INRA, 47).
Dunner, S. and Cañon, J. (1988). Profils génétiques visibles de la chèvre du Nord de l’Espagne. In: Populations Traditionnelles et Premières Races Standardisées d’Ovicaprinæ dans le Bassin Méditerranéen
(Lauvergne, J.J., ed.). INRA, Paris, pp. 159-167 (Colloque INRA, 47).
Franceschi, P. and Santusi, P. (1988). Profils génétiques visibles de la chèvre Corse. In: Populations Traditionnelles et Premières Races
Standardisées d’Ovicaprinæ dans le Bassin Méditerranéen (Lau-vergne, J.J., ed.). INRA, Paris, pp. 145-151 (Colloque INRA, 47).
Gruppetta, A., Renieri, C., Silvestre, M. and Valfré, F. (1988).Profils génétiques
visibles de la chèvre à Malte. In: Populations Traditionnelles et Premières Races Standardisées d’Ovicaprinæ dans le Bassin Méditerranéen
(Lauvergne, J.J., ed.). INRA, Paris, pp. 113-121 (Colloque INRA, 47).
Gutierrez, A.N.F., De Boer, J. and Alves, J.V. (1981). Interações de Recursos e Características Econômicas dos Criadores de Ovinos e Caprinos no Sertão do Ceará, Nordeste do Brasil: Resultados Preliminares. EMBRAPA/CNPC, Sobral, p. 49 (Boletim de Pesquisa, 2).
Hossaini-Hilari, J. and Benlamlih, S. (1995). La Chèvre Marocaine. Capacités d’Adaptation aux Conditions Arides. Animal Genetic Re-sources Information, 15. UNEP/FAO, Roma, pp. 51-56.
IBGE (1988). Efetivo e valor dos rebanhos - Região Nordeste. In: Produção da Pecuária Municipal. 1987, IBGE, 15(2): 65-68, 133-137, 171-174,
205-209, 245-249, 281-283, 305-307, 343-352.
Lauvergne, J.J. (Ed.) (1988). Populations Traditionnelles et Premières Races Standardisées d’Ovicaprinæ dans le Bassin Méditerranéen.
INRA, Paris, pp. 298 (Colloque INRA, 47).
Lauvergne, J.J. (1993). Breed development and breed differentiation. In:
Data Collection, Conservation and Use of Farm Animal Genetic Resources. Proceedings (Simon, D. and Buchenauer, D., ed.). CEC
Workshop and Training Course, 1992, Hannover. School of Veteri-nary Science, Hannover, pp. 53-64.
Lauvergne, J.J. and Howell, W.E. (1978). Un premier inventaire de la chèvre Corse (gènes à effets visibles). Ethnozootechnie22: 86-92.
Martrès, J.P. and Benadjaoud, A. (1988) Profils génétiques visibles de la
chèvre de Haute-Roya. In: Populations Traditionnelles et Premières Races Standardisées d’Ovicaprinæ dans le Bassin Méditerranéen
(Lauvergne, J.J., ed.). INRA, Paris, pp. 153-158. (Colloque INRA, 47).
Nei, M. (1972). Genetic distance between populations. Am. Nat.106 (949):
283-292.
PHILIP (1993). Philogeny Inference Package Version 3.5. Programs for Inferring and Carrying out Certain Related Tasks. University of
Washington.
Programa Nacional de Pecuária (1979). Anexo: Pesquisa de Caprino-cultura e OvinoCaprino-cultura Deslanada do Nordeste. Vol. 15. Fundação João Pinheiro, Belo Horizonte, pp. 114.
Queinnec, B. and Queinnec, G. (1974). Support génétique de la robe des
ovins et des caprins. Rev. Med. Vet.125: 1027-1030.
Renieri, C., Rubino, R., LA Tessa, D., Muscillo, F., Sarrica, G. and Zarrielo, G. (1988). Profils génétiques visibles de la chèvre du Sud de l’ Italie. In:
Populations Traditionnelles et Premières Races Standardisées d’Ovicaprinæ dans le Bassin Méditerranéen (Lauvergne, J.J., ed.). INRA, Paris, pp. 123-134 (Colloque INRA, 47).
Sadorge, A. and Benadjaoud, A. (1988). Profils génétiques visibles de la chèvre du Rove. In: Populations Traditionnelles et Premières Races Standardisées d’Ovicaprinæ dans le Bassin Méditerranéen
(Lauvergne, J.J., ed.). INRA, Paris, pp. 169-174 (Colloque INRA, 47).
Searle, A.G. (1968). Comparative genetics of coat colour in mammals.
Logos Press, Academic Press, London, New York, pp. 68-70, 195.
Sournia,J.-C. (1991). Dictionnaire de Génétique. Conseil International de la Langue Française et Fondation Postuniversitaire Interculturelle, Paris, pp. 351.