Spectroscopic Study of the
24
Mg
35
Cl and
24
Mg
37
Cl A
2
Π
-X
2
Σ
+
Band System
R. F. Gutterres, Roberto Ferreira dos Santos, and C. E. Fellows
Laborat´orio de Espectroscopia e Laser, Instituto de F´ısica,
Universidade Federal Fluminense, Campus da Boa Viagem, Niter ´oi, RJ 24210-340, Brazil
Received on 14 July, 2003
The A2
Π-X2
Σ+
emission band system of the MgCl molecule has been studied by means of high resolution Fourier Transform Spectroscopy (FTS). The MgCl species were produced by mixing Mg vapor with a gaseous flow of a He/Cl2and excited in a “heated” Sch¨uller’s type discharge tube. Rovibrational analysis of the 0-0 and
0-1 bands was performed and the values of the vibrational constantωeof the ground state and the spin-orbit
constantsA0 andAJof the A
2
Πstate were determined. For the first time transitions of the isotopic species
24
Mg37
Cl could be assigned and included in the analysis presented here.
1
Introduction
Alkaline-earth mono-halides molecules are highly ionic compounds and have nine valence electrons outside closed shells. This particular electronic configuration have at-tracted the interest of theoretical and experimental spectro-scopists. Several ionic bonding models have been developed to represent the electronic structure of these first excited states [1-3] and experimental studies of these molecules have allowed the test of these models.
The electronic transitions involving the ground and the first excited states of the MgCl molecule have been stud-ied [4-13] from different experiments. Spectroscopic data of the ground state (v= 0, 1) was also available from accurate microwave experiments [14-16] for several isotopic species of the MgCl molecule. Nevertheless, the limited resolution of the optical experiments did not permit the direct observa-tion of the spin-doubling splitting in the 0-0 band, nor as-signments for the isotopic molecule 24
Mg37
Cl transitions, of the A2Π-X2
Σ+
system.
It was only recently that the A2Π-X2Σ+
system could be studied by means of the high resolution Fourier Trans-form Spectroscopy. The emission spectra was produced in Orsay and Waterloo by using different techniques, and the strong similarity of the obtained spectra have allowed a joint analysis [17]. A complete rovibrational analysis of the A2
Π-X2Σ+
0-0 and 0-1 bands, including vibrational dependence of the ground state and spin-orbit splitting of the A2Πstate, was carried out. The obtained value of the lambda doubling constantpwas found positive, in contrast with the theoreti-cal predictions [18].
This work presents a complementary analysis of the data obtained earlier[17]. For the first time 56 transitions of the
24
Mg37
Cl A2Π-X2Σ+
0-0 band could be assigned. A set of molecular constants, which reproduce the observed
transi-tions of both24
Mg35
Cl and24
Mg37
Cl compounds, could be derived from a nonlinear least-squares fit of the optical data obtained from the Orsay group measurements.
2
The experiment
Excited MgCl species were produced in a Sch¨uller’s type tube which was heated in its middle part. More details of Sch¨uller discharge device can be found elsewhere [19]. Briefly this discharge tube consists of a quartz tube for which both electrodes are located in front of a liquid ni-trogen trap. In this way, electrodes are preventing of any contamination, resulting in a very stable discharge inten-sity. This light source is particularly convenient for emis-sion Fourier Transform Spectroscopy. TheM gClmolecules were produced in the following way:M gpellets were intro-duced in the middle part of the discharge tube which was heated up to 800oC, in order to obtainM gvapor. The DC discharge (3400 V, 100 mA) was established through flow-ingHe/Cl2gas mixture (1% ofCl2inHe), at a pressure of
30 mbar. The spectrum was recorded by means of a Bruker IFS 120 HR Fourier Transform Spectrometer. The detector was a photo-multiplier tube (HAMAMATSU 1P28) associ-ated with a long pass wavelength colored glass filter. The spectrum was obtained after the transformation of 1000 co-added interferograms recorded at an apodized resolution of 0.060 cm−1
.
3
Results
very similar potential curve of the upper and lower states. In a A2Π-X2
Σ+
electronic transition one can expect to observe twelve branches for each band [20]. In addition these elec-tronic states which have similar vibrational (and rotational) constants, result in sequences in which the separations of the bands are about 30cm−1
.
An overview of a part of the obtained spectrum is shown in the Fig. 1. The A2Π-X2Σ+
0-0 band can be clearly seen in this figure, which shows the band head of the branches P12, P11, P22, Q22. Only transitions of the 0-1 A2Π1/2
-X2Σ+
could be assigned in the sequence∆v=−1. Rotational structure of the P12 branches for both the 24
Mg35
Cl and the 24
Mg37
Cl isotopic species are shown in the Fig. 2. A total of 493 transitions was assigned, includ-ing 56 transitions of the not-predominant24Mg37Cl isotopic species. These 56 transitions were assigned in the P12, Q11
and R22branches of the 0-0 band.
26440 26490 26540 26590 26640 cm−1
−0.1 0 0.1 0.2 0.3 0.4
arbitrary units
P P
P Q
12 11
22
22(1−1)
P11
22
P P
P Q
12(1−1) 11(1−1)
22(1−1)
Figure 1. Overview of theA-Xspectrum.
26453.00 26463.00 26473.00 cm−1
−0.012 0.0075 0.028 0.048 0.068 0.088
arbitrary units
Mg(24)Cl(35)
Mg(24)Cl(37)
29.5 44.5
49.5
30.5
P
P
10.5 20.5
J 12
20.5 12
Figure 2. Part ofP12branch of the 0-0A-Xsub-band.
4
Analysis
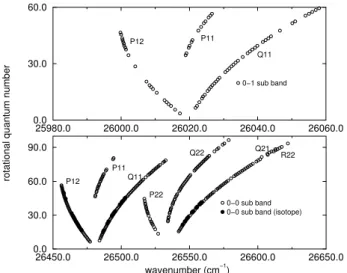
Figure 3 shows a Fortrat diagram of the assigned transitions. This data set was analyzed in two different ways. In the first approach, the molecular constants were derived by adjusting all obtained data concerning both the 0-0 and 0-1 bands. In the second approach, the assigned lines of each band sys-tem were treated separately. In both analysis procedures, it was also possible to test the quality of the assignments tak-ing into account the molecular constants of the ground state obtained from micro-wave experiments [14, 15]. It was ex-pected that the molecular constants calculated in this work should have a high coherence and complementarity with the very accurate constants derived in [14, 15].
26450.0 26500.0 26550.0 26600.0 26650.0 wavenumber (cm−1)
0.0 30.0 60.0 90.0
0−0 sub band 0−0 sub band (isotope) 25980.0 26000.0 26020.0 26040.0 26060.0 0.0
30.0 60.0
0−1 sub band
rotational quantum number P12
P11 Q11
R22 Q21 Q22
P22
Q11 P12 P11
Figure 3. Fortrat diagram of theA-Xband system. The points rep-resented by open circles (◦) are the observed energy levels and cor-respondent wavenumbers of the24
M g35
Clspecies, the full circles (•) are the observed energy levels and correspondent wavenumbers of the24
M g37
Clspecies.
4.1
The Hamiltonian representation
The spectroscopic constants for the A2Π
and X2Σ+
elec-tronic states were determined by a nonlinear least-squares fit of all observed wavenumbers. The energy term values of the X2Σ+
electronic state were described by a standard Hund’s case ”b”2Σ+
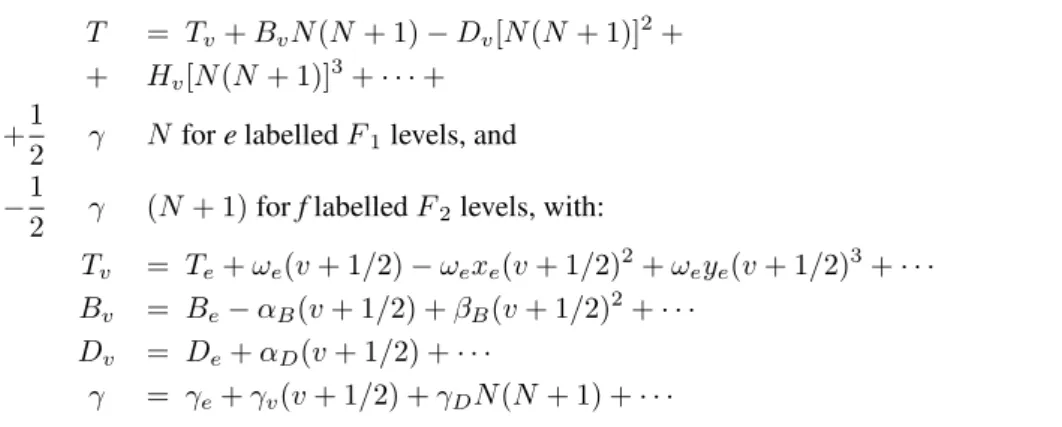
T = Tv+BvN(N+ 1)−Dv[N(N+ 1)]2+ + Hv[N(N+ 1)]3+· · ·+
+1
2 γ NforelabelledF1levels, and
−1
2 γ (N+ 1)forflabelledF2levels, with:
Tv = Te+ωe(v+ 1/2)−ωexe(v+ 1/2)2+ωeye(v+ 1/2)3+· · ·
Bv = Be−αB(v+ 1/2) +βB(v+ 1/2)2+· · ·
Dv = De+αD(v+ 1/2) +· · ·
γ = γe+γv(v+ 1/2) +γDN(N+ 1) +· · · (1)
⌈
The Hamiltonian for the isolated A2Π
electronic state is shown in Table 1. The observed transitions involve only one vibrational level (v = 0) of the A2Π
state, consequently no vibrational dependence was taken into account in the Hamiltonian representation of this state. The data from the
24
Mg37
Cl molecule were included in the fit using standard transformation formulae [21]. An additional parameter ǫ
was considered in the reductions. It was defined for the iso-topic species as a slight change in the origin of the energies
T,
Tisot =T + (1−ρ)ǫ, (2)
ρ being the square root of the ratio between the reduced masses of24
Mg35
Cl and24
Mg37
Cl species, respectively.
Table 1. Hamiltonian energy matrix for the A2Π
electronic state.
2Π
3/2 2Π1/2
T+A/2 + (B+AJ)(X−1) −BX1/2+ 2DX3/2
2Π
3/2 −D[(X−1)2+X] −HX1/2(3X2+X+ 1) +AJJX1/2 +H[(X−1)3
+X(3X−1)] + (q/2)[X1/2
[−1±(X+ 1)1/2
]] + (AJJ/2)[3(X−1)2+X] + (q/2)X −(p/4)X1/2
T−A/2 + (B+AJ)(X−1)
−D[(X+ 1)2
+X]
2
Π1/2 sym. +H[(X+ 1)3+X(3X+ 1)]
−(AJJ/2)[3(X+ 1)2+X] + (q/2)[X+ 2∓2(X+ 1)1/2]]
+ (p/2)[1∓(X+ 1)1/2]
Note.X = (J+ 1/2)2−1. The±
signs refer to the levels withe/fparity respectively.
4.2
The first approach: global reduction of
the analysis data set
It appeared that no local perturbation affects the spectrum and, consequently a merged fit involving all observed tran-sitions for the24
Mg35
Cl and24
Mg37
Cl isotopic species was performed in this work. A set of 14 molecular constants was derived, reproducing the observed transitions with a stan-dard deviation less than 1.5×10⁻² cm−1
. Tables 2(a) and 3(a) show the molecular constants issued from these calcu-lations for the X2Σ+
and A2Πstates, respectively.
As a second global analysis procedure, a new adjust of
the obtained global data set was performed, in which the ground state molecular constants Be,αB,βB, γe,γv and
γBwere held fixed in the values calculated by M. Bogeyet
al. [14]. The molecular constant values obtained by Bogey
et al. [14] were used, instead of those obtained by Ohshima and Endo [15], because these parameters were derived in a data reduction merging all vibrational observed levels (v = 0, 1 and 2), allowing, therefore, a more adequate compar-ison between the results presented in this sub-section. All adjustable parameters of the A2Π
10 parameters was determined and no significant change in the r.m.s. of the adjust could be observed.
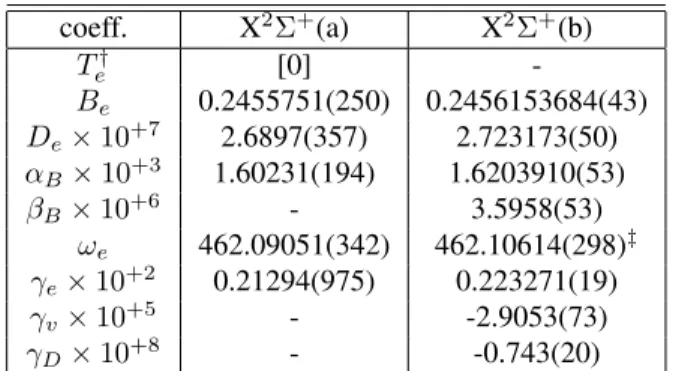
Table 2. Molecular constants in cm−1
for the X2Σ+
elec-tronic state determined in the analysis from a nonlinear least-squares fit of the global data set. Column (b) shows, for comparison, the values obtained by Bogey et al. [14]. Numbers in parentheses represent the standard deviation in units of the last figure quoted.
coeff. X2Σ+
(a) X2Σ+
(b)
T†
e [0]
-Be 0.2455751(250) 0.2456153684(43)
De×10+7 2.6897(357) 2.723173(50)
αB×10+3 1.60231(194) 1.6203910(53)
βB×10+6 - 3.5958(53)
ωe 462.09051(342) 462.10614(298)‡
γe×10+2 0.21294(975) 0.223271(19)
γv×10+5 - -2.9053(73)
γD×10+8 - -0.743(20)
†Origin of the energies at levelv=−1/2.
‡Value obtained by fixing the ground state molecular con-stants in the values obtained in [14] (see text).
N = 0of the ground state (Te= 0). (a) This work, (b) M. Bogeyet al. [14] Table 3. Molecular constants in cm−1
for the A2Π
elec-tronic state determined in the analysis from (a) the nonlinear least-squares fit of the global data set, (b) values obtained by fixing the molecular constants of the ground state in the ones obtained in [14] (see text). Numbers in parentheses repre-sent the standard deviation in units of the last figure quoted.
coeff. A2
Π(a) A2
Π(b)
T0† 26740.14163(331) 26740.15355(276)
B0 0.2507822(298) 0.25081495(147)
D0×10+7 2.5689(466) 2.64642(195)
ǫ† -242.960(242) -243.131(252)
A0 54.7850(427) 54.7978(342)
AJ×10+4 -0.4854(171) -0.5023(143)
p0×10+2 0.5159(114) 0.52860(716)
q0×10+4 -0.2331(189) -0.1994(102)
†Origin of the energies at levelv=−1/2,
N = 0of the ground state (Te= 0).
‡∆νf e=p0×(J+ 1/2).
The values of the molecular constants for the ground state obtained by M. Bogey et al. [14], as well as the
ωe value calculated in the procedure described above, are shown in Table 2 (column b). A strong coherence between the values listed in both Table 2 (column a) and Table 2 (col-umn b) can be observed. The calculated molecular constants of the A2Π
excited state, obtained in the second analysis procedure described above, are shown in Table 3 (column b). Again a very good agreement between the molecular constant values shown in Table 3 (column a) and the ones shown in Table 3 (column b) can be noted.
4.3
The second approach: the independent
reduction 0-0 and 0-1 band system data
set
The data sets of the 0-0 and the 0-1 band systems were an-alyzed also separately. At first the 0-0 band was anan-alyzed using the Hamiltonian described in the Section 4.1, in which the vibrational dependence was not taken into account. A set of 11 molecular constants was derived and it reproduced the observed transitions of the 0-0 band system within a stan-dard deviation around 1.5×10⁻²
cm−1.
In the analysis involving the data of the 0-1 band sys-tem only transitions involving the A2Π
1/2-X2Σ+sub-band
could be assigned. The spin orbit parametersA0 andAJ were therefore held fixed in the value obtained from the analysis of the 0-0 band system. Also no lines concerning the 24
Mg37
Cl isotopic species were assigned in this band system. A set of 6 molecular constants was obtained in the data reduction, which reproduced the observed transitions of the 0-1 band system within a standard deviation around 1.5×10⁻²
cm−1
. Tables 4(a) and 5(a) show the molecular constants for the X2
Σ+
and A2
Πstates respectively, issued from the calculations for each band system.
In an analogous analysis procedure described in the Sec-tion 4.2, a new adjust of the 0-0 and the 0-1 band system data was performed, in which the ground state molecular constantsBv,Dv,γv andγDv were held fixed in the values obtained by Ohshima and Endo [15]. In this case, the choice of the molecular constants calculated in [15] instead of those calculated by Bogeyet al. [14], is due to the fact that in the work of Ohshima and Endo each vibrational level (v= 0 and 1) has been fitted separately, allowing a more adequate com-parison between the results presented in this sub-section. All adjustable parameters of the A2Π
state were left free in the adjust involving the 0-0 band system data set while those of the ground state were held fixed to the values reported in [15] for v”=0. From this second procedure a set of 10 parameters was calculated and no significant change in the r.m.s. of the adjust could be observed.
Also the 0-1 band system was analyzed by fixing the molecular constantsBv,Dv,γvandγDv of the ground state in the values obtained by Ohshima and Endo [15] for v” = 1, and leaving the adjustable molecular constants of the A2Π
state as free parameters. A new set of 4 parameters, for the A2Π
state, was calculated from this procedure. No signifi-cant change in the r.m.s. of the adjust was observed.
The molecular constant values for the ground state ob-tained in [15] forv = 0andv = 1are shown in the Table 4(b). A reasonable agreement between the values listed in both Table 4(a) and Table 4(b) is observed. The calculated molecular constants of the A2Π
excited state, obtained in the 0-0 and 0-1 sub band analyses described above, are shown in Table 5(b). Once more a very good agreement between the molecular constant values calculated for the A2Π
constants obtained by M. Singh et al.[10] for both states. The differences between the obtained constants and the ones obtained in [10] are, to some extent, a consequence of dif-ferent Hamiltonians used to represent the energy levels of
the X2Σ+
and A2Πstates. In the analysis of M. Singh et al.[10] no spin-orbit value determination, nor the24Mg37Cl isotopic species transitions were included.
Table 4. Molecular constants in cm−1
for the X2Σ+
electronic state determined in the analysis from a nonlinear least-squares fit of the 0-0 and 0-1 band system data sets. Column (b) shows, for comparison, the values obtained by Ohshima and Endo [15]. Numbers in parentheses represent the standard deviation in units of the last figure quoted.
(v=0) X2Σ+
(a) X2Σ+
(b) X2Σ+
(c)
B 0.2447159(265) 0.2448806155(30) 0.244664(37)
D×10+7
2.6130(505) 2.724584(47) 2.682(79)
γ×10+2
0.19933(795) 0.22197690(80) 0.17†
γD×10+9 - -9.373(80)
-(v=1) X2Σ+
(a) X2Σ+
(b) X2Σ+
(c)
B 0.242522(103) 0.2431928258(37) 0.243051(37)
D×10+7
2.351(309) 2.721816(70) 2.704(80)
γ×10+2
- 0.2189581(23) 0.17†
γD×10+9 - -8.37(10)
-†Approximated values.
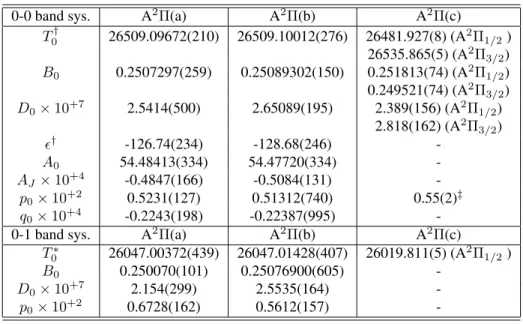
Table 5. Molecular constants in cm−1
for the A2Π
electronic state determined in the analysis from: (a) the nonlinear least-squares fit of the 0-0 and 0-1 band system data sets, (b) values obtained by fixing the molecular constants of the ground state in this ones obtained in [15](see text), (c) values obtained by Singhet al. [10]. Numbers in parentheses represent the standard deviation in units of the last figure quoted.
0-0 band sys. A2Π(a) A2Π(b) A2Π(c)
T0† 26509.09672(210) 26509.10012(276) 26481.927(8) (A 2Π
1/2)
26535.865(5) (A2Π 3/2)
B0 0.2507297(259) 0.25089302(150) 0.251813(74) (A2Π1/2)
0.249521(74) (A2Π 3/2)
D0×10+7 2.5414(500) 2.65089(195) 2.389(156) (A2Π1/2)
2.818(162) (A2Π3/2)
ǫ† -126.74(234) -128.68(246)
-A0 54.48413(334) 54.47720(334)
-AJ×10+4 -0.4847(166) -0.5084(131)
-p0×10+2 0.5231(127) 0.51312(740) 0.55(2)‡
q0×10+4 -0.2243(198) -0.22387(995)
-0-1 band sys. A2Π(a)
A2Π(b)
A2Π(c)
T∗
0 26047.00372(439) 26047.01428(407) 26019.811(5) (A 2
Π1/2)
B0 0.250070(101) 0.25076900(605)
-D0×10+7 2.154(299) 2.5535(164)
-p0×10+2 0.6728(162) 0.5612(157)
-†Origin of the energies at levelv= 0,N = 0of the ground state (T0= 0).
∗Origin of the energies at levelv= 1,N = 0of the ground state (T1= 0).
‡∆νf e=p0×(J+ 1/2).
5
Conclusion
The A2Π-X2Σ+
band system of the MgCl molecule was studied by means of the Fourier Transform Spectroscopy (FTS). The MgCl molecules were produced by mixing Mg vapor with a gaseous flow of a He/Cl2, and excited in a
heated Sch¨uller type discharge tube. An accurate set of
molecular constants was determined from a complete rovi-brational analysis of the 0-0 and 0-1 bands, including vibra-tional dependence on the ground state and spin-orbit split-ting of the A2Π
were calculated with high accuracy. The high resolution of the FTS technique allows for the first time the observation and assignment of the24
Mg37
Cl isotopic species transitions, which were included in the analysis presented in this work.
Acknowledgements
This work was partially supported by CAPES/COFECUB (Brazil/France cooperation) 182/96. One of the authors (C.E.F.) would like to thank CAPES/Brasil for a post-doctoral grant.
References
[1] T. T¨orring W. E. Ernst, and S. Kindt, J. Chem. Phys.90, 4927 (1989).
[2] T. T¨orring W. E. Ernst, and J. K¨andler,J. Chem. Phys.81, 4614 (1984).
[3] S. F. Rice, H. Martin, and R. W. Field, J. Chem. Phys. 82, 5023 (1985).
[4] K. P. Huber and G. Herzberg,Molecular spectra and molec-ular structure: Constants of diatomic molecules., Vol. 4, Van Nostrand Reinhold Co., New York, NY. 1979.
[5] F. Morgan, Phys. Rev.50, 603 (1936).
[6] V. S. N Rao, and P. T. Rao, Indian J. Phys.37, 640 (1963).
[7] A. B. Darji, N. R. Shah, P. M. Shah, M. B. Sureshkumar, and G. S. Desai, Pramana25, 571 (1985).
[8] E. Morgan, R. F. Barrow, Nature(London)192, 1182 (1961).
[9] M. M. Patel and P. D. Patel, Indian J. Phys.42, 254 (1968).
[10] M. Singh, G. S. Ghodgaokar, and M. D. Saksena, Can. J. Phys.65, 1594 (1987).
[11] M. Singh, M. D. Saksena, and G. S. Ghodgaokar, Can. J. Phys.66, 570 (1988).
[12] B. Bourguignon, Mohammed-Ali Gargoura, J. Rostas, and G. Taieb, J. Phys. Chemistry.91, 2080 (1987).
[13] J. Rostas, N. Shafizadeh, G. Taieb, B. Bourguignon, and M. G. Prisant, Chem. Phys.142, 97 (1990).
[14] M. Bogey, C. Demuynck, and J. L. Destombes, Chem. Phys. Lett.155, 265 (1989).
[15] Y. Ohshima and Y. Endo, Chem. Phys. Lett.213, 95 (1993).
[16] M. A. Anderson, and L. M. Ziurys, Chem. Phys. Lett.224, 381 (1994).
[17] T. Hirao, P. F. Bernath, C. E. Fellows, R. F. Gutterres, M. Vervloet, J. of Molec. Spectrosc.212, 53 (2002).
[18] H. Lefebvre-Brion and R. W. Field,Perturbation in the Spec-tra of Diatomic Molecules, Academic Press, 1986.
[19] J. H. Callomon, Can. J. Phys.34, 1046 (1956).
[20] G. Herzberg,Molecular spectra and molecular structure: I. Spectra of diatomic molecules., Van Nostrand Reinhold Co., New York, NY. 1950.