ABSTRACT:Introduction: Hypertension is a major public health problem due to its high prevalence, low levels of control, and cardiovascular morbidity and mortality. Objective: To analyze the prevalence of hypertension and associated factors in men and women living in the cities of Legal Amazonia. Methods: A population-based, cross-sectional study was carried out with 1,296 adults in the cities of Legal Amazonia. Socio-demographic, lifestyle, and anthropometric data were collected and blood pressure was measured, being considered hypertensive those individuals who had blood pressure ≥ 140/90 mmHg and/or those who reported the use of antihypertensive drugs. Statistical analyzes were performed using the survey module preix in Stata version 11.0.
Results: The prevalence of hypertension was 22.3%. After adjusting, the variables associated with hypertension in men were in the age groups 30 – 39 years (adjusted prevalence ratio [PR] = 2.69; 95%CI 1.49 – 4.86), 40 – 49 years (adjusted PR = 3.28; 95%CI 1.82 – 5.93), and 50 – 59 years (adjusted PR = 4.80; 95%CI 2.63 – 8.76); overweight (adjusted PR = 1.97; 95%CI 1.39 – 2.78); obesity (adjusted PR = 3.32; 95%CI 2.32 – 4.75); and being born in the North or Northeast regions (adjusted PR = 0.31; 95%CI 0.18 – 0.59). Among women, the age groups 40 – 49 years (adjusted PR = 3.41; 95%CI 1.91 – 6.07) and 50 – 59 years (adjusted PR = 7.29; 95%CI 4.07 – 13.07), wine consumption (adjusted PR = 0.31; 95%CI 0.10 – 0.97), and obesity (adjusted PR = 2.39; 95%CI 1.65 – 3.45) were associated with hypertension. Conclusion: In men, hypertension was independently associated with age, nutritional status, and place of birth, whereas in women, the variables associated with hypertension were age, nutritional status, and type of alcoholic beverage.
Keywords: Hypertension. Obesity. Alcohol drinking. Risk factors. Lifestyle. Chronic disease.
Hypertension prevalence and
associated factors in men and women
living in cities of the Legal Amazon
Prevalência de hipertensão arterial sistêmica e fatores associados
em homens e mulheres residentes em municípios da Amazônia Legal
Elcimary Cristina SilvaI, Maria Silvia Amicucci Soares MartinsII, Lenir Vaz GuimarãesII, Neuber José SegriIII, Maria Aparecida Lima LopesIV, Mariano Martinez EspinosaIII
IGraduate Program of the Public Health Institute, Universidade Federal de Mato Grosso – Cuiabá (MT), Brazil. IIInstitute of Public Health, Universidade Federal de Mato Grosso – Cuiabá (MT), Brazil.
IIIInstitute of Exact and Earth Sciences, Universidade Federal de Mato Grosso – Cuiabá (MT), Brazil. IVSchool of Nutrition, Universidade Federal de Mato Grosso – Cuiabá (MT), Brazil.
Corresponding author: Maria Silvia Amicucci Soares Martins. Alameda Paranatinga, 9, Alphaville 2, CEP: 78061-418, Cuiabá, MT, Brazil. E-mail: [email protected]
Conlict of interests: nothing to declare – Financial support: Ministry of Health of Brazil and National Council for Scientiic and Technological Development (CNPq), process 402879 / 2005.8.
INTRODUCTION
Hypertension is considered as a major public health problem due to its high prevalence, low levels of control, and cardiovascular morbidity and mortality1. In Brazil, the disease afects 25% of the adult population and by 2025 this number is projected to be 60% higher, reaching a prevalence of 40%. In addition to being a major cause of deaths from circulatory system diseases, hypertension brings a high socioeconomic burden, due to economically active people being transformed into temporarily or permanently disabled2.
Hypertension is characterized as a multifactorial, chronic, and non-communicable dis-ease associated with functional, structural, and metabolic changes3. The estimates from the World Health Organization (WHO) indicate that chronic, non-communicable diseases account for 58.5% of all deaths worldwide and 45.9% of the global burden of diseases4.
According to the National Heart Lung and Blood Institute, the main risk factors for hypertension are age, race, gender, overweight or obesity, and unhealthy lifestyle habits, such as physical inactivity, abusive consumption of alcohol, smoking, and excessive salt intake. Other risk factors are associated with high blood pressure such as genetic suscepti-bility and stress5.
The literature shows diferent data on the prevalence of hypertension between genders. In women, the following situations may inluence the level of blood pressure: use of con-traception, polycystic ovary syndrome, pregnancy, hormone replacement, and menopause. Some of these situations can lead to signiicant increases in blood pressure and development
RESUMO:Introdução: A hipertensão arterial sistêmica é um importante problema de saúde pública devido à sua alta prevalência, baixas taxas de controle e causa de morbidade e mortalidade cardiovascular. Objetivo:
Analisar a prevalência de hipertensão arterial sistêmica e fatores associados em homens e mulheres residentes em municípios da Amazônia Legal. Métodos: No estudo transversal de base populacional conduzido com 1.296 adultos de ambos os sexos foram coletados dados sociodemográicos, estilo de vida, antropométricos e pressão arterial, sendo considerados hipertensos os que apresentaram pressão arterial ≥ 140/90 mmHg e/ou os que referiram uso de drogas anti-hipertensivas. As análises estatísticas foram feitas no módulo survey do programa Stata versão 11.0. Resultados: A prevalência da hipertensão arterial sistêmica foi de 22,3%. Após ajustes, as variáveis que se associaram à hipertensão nos homens foram a idade de 30 a 39 anos (RP ajustada = 2,69; IC95% 1,49 – 4,86), 40 a 49 anos (RP ajustada = 3,28; IC95% 1,82 – 5,93) e 50 a 59 anos (RP ajustada = 4,80; IC95% 2,63 – 8,76), sobrepeso (RP ajustada = 1,97; IC95% 1,39 – 2,78), obesidade (RP ajustada = 3,32; IC95% 2,32 – 4,75) e ser natural da região Norte ou Nordeste (RP ajustada = 0,31; IC95% 0,18 – 0,59). Entre as mulheres, associaram à hipertensão a idade de 40 a 49 anos (RP ajustada = 3,41; IC95% 1,91 – 6,07) e 50 a 59 anos (RP ajustada = 7,29; IC95% 4,07 – 13,07); o consumo de vinho (RP ajustada = 0,31; IC95% 0,10 – 0,97) e obesidade (RP ajustada = 2,39; IC95% 1,65 – 3,45). Conclusão: A hipertensão arterial associou-se independentemente com a idade, estado nutricional e naturalidade nos homens. E nas mulheres com a idade, estado nutricional e tipo de bebida alcoólica.
of hypertension. The mechanisms responsible for the diferences in the regulation of blood pressure between the genders are not fully understood but may be related to the efects of sex hormones on sodium handling by the renal system6.
Other situations may justify this increase in blood pressure in women such as the inclu-sion in the domestic and profesinclu-sional world. The female stress level has increased because of the increased participation of women in the labor market, leading to overloading of profes-sional requirements combined with domestic duties. This situation would explain the higher levels of stress in women compared to men, being an important factor for the increase of blood pressure7. Another factor that may also be related to the increase of blood pressure in women is the fact that women are more aware of their health problems than men, lead-ing to greater use of health services8-10.
In relation to men, various aspects may be related to health care. A research carried out with a men’s population that seeks the primary health-care services found that the preven-tive practices related to health, whether they be structural and/or cultural, are not routine to the majority of this population, being more prevalent in women. This indicates that the explanation of this phenomenon also involves a gender issue, where men and women, under the inluence of diferent cultural elements, develop diferent patterns of behavior with respect to self-care11.
Considering that hypertension is a major problem of public health and researches indi-cate the diference in prevalence between genders, this is an important study for health monitoring to better understand this reality and, consequently, the magnitude of the health problems in the Legal Amazon region. It is a region of agricultural expansion and popula-tion migrapopula-tion from diferent regions of the country. This process of expansion may cause signiicant environmental impacts, inluencing lifestyle, changing the quality of life, and the morbidity and mortality proile of the population. Previous studies on the health status of the population and their main determinants allow comparisons with future assessments and understanding of the magnitude of the risks of morbidity and mortality in these pop-ulations. In this context, this study aims at analyzing the prevalence of hypertension among men and women and identifying factors associated with the disease in the adult population living in cities of the Legal Amazon.
METHODS
This study is part of the Food Security and Nutrition project of resident population in the urban area of inluence of BR 163. It is a cross-sectional, population-based study, with a probabilistic cluster sampling in two stages, among individuals living in the urban area of the cities of Alta Floresta, Sinop, Sorriso, and Diamantino in 200712.
both from ecological and economic points of view. It is a region of agricultural expansion and population migration from diferent regions of the country13.
The sample was determined based on the population of the cities, by simple random sampling and cluster sampling in two stages. The calculation of the sample size considered conidence level of 95%, proportion of 50%, and estimation error of 3.5%, with estimated 3,075 individuals for the four cities. Considering that individuals in the population surveys are identiied in their homes, the number of households to be drawn in the survey was determined for each municipality. Thus, the total number of households was calculated by dividing the number of individuals in the sample by the average number of residents per household in each city. Foreseeing the loss of households not interviewed, an increase of 20% in the total number of households was stipulated. The inal size of the population of this study is 1,296 adults of both genders, after applying the exclusion criteria and 20.27% sam-ple loss (because of denial or absence) in individuals aged from 20 to 59 years14.
The data were collected using a structured questionnaire and household interview, after participants signed the informed consent form. Pregnant women, mothers of children less than 6 months, and people who presented physical and/or mental limitations that prevented obtaining the data were excluded.
The demographic and socioeconomic variables analyzed in this study were: gender; age (categorized into 20 – 29, 30 – 39, 40 – 49, and 50 – 59 years); race/color (white, black, brown, and yellow/indigenous); marital status (single, married, and separated/divorced/ widowed); place of birth by region (Midwest, South, Southeast, and North/Northeast); schooling in years of study (0 – 4, 5 – 8, and ≥ 9 years); and per capita family income in min-imum wages (< 0.50, 0.50 – 0.99, 1.00 – 1.99, and ≥ 2.00). The information on the demo-graphic and socioeconomic status of adults and householders was obtained by structured questionnaire applied to the householders.
With regard to lifestyle, the following variables were analyzed: physical activity, alco-hol consumption, and smoking. Physical activity was considered in two areas: leisure and commute. Physical activity during leisure time was measured in minutes per week and categorized as inactive (0 minutes/week), low active (10 – 149 minutes/week), or active (≥ 150 minutes/week). Commuting to school and/or work on foot or by bicycle is classiied into three categories: none (when there was no commute or people commuted by motor vehicles), 1 – 29 minutes, and ≥ 30 minutes15. With regard to smoking, the categories were: smokers, ex-smokers, and never smoked.
The consumption of alcoholic beverage referred to the alcohol intake in the last 30 days preceding the interview and the types of drinks were categorized into beer, wine, and dis-tilled beverage.
The techniques recommended by the WHO were used to obtain the anthropometric mea-surements (weight and height) of adults17. Weight was measured using portable digital scale. Participants were weighed once and the amounts were recorded on the card in kilograms. A portable stadiometer was used to measure the participants’ height and the measurement was taken twice, with individuals wearing light clothes, barefoot in the standing position.
Blood pressure was measured three times with an interval of 3 minutes between each measurement, using a semi-automatic apparatus. The average of the last two measurements was used in the analysis. Those individuals who had systolic blood pressure ≥ 140 mmHg and/or diastolic blood pressure ≥ 90 mmHg and/or those who reported use of antihyper-tensive drugs were deined as hyperantihyper-tensive individuals3.
The data were entered by the double-entry method, in the statistical software Epi Info 2000 (Centers for Disease Control and Prevention, Atlanta, USA), which allows the consis-tency of their analysis. Statistical analyzes were performed using Stata version 11.0 (Stata Corp., College Station, USA), using the procedures for complex samples in the survey mod-ule (svy) for population inquiries18. Absolute frequencies were calculated and the proportions were compared by the chi-squared (χ2) Pearson test, with a signiicance level of p < 0.05.
The prevalence ratios (PRs) were estimated with conidence intervals of 95% (95%CI) to determine the association between the dependent variables (hypertension) and indepen-dent variables of the study. The variables that presented p < 0.20 by χ2 test were selected to compose the Poisson regression model, and those which remained in the model were the variables that presented signiicance level of p < 0.0519.
RESULTS
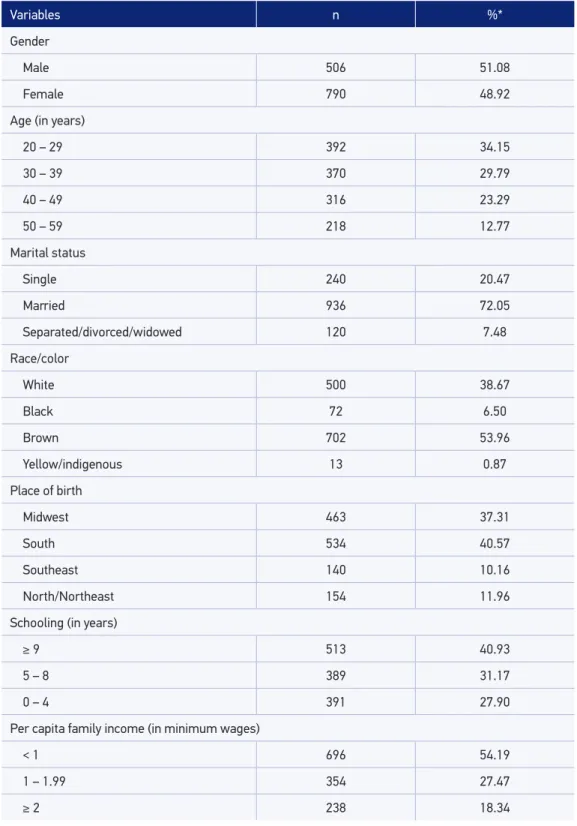
The study was carried out with 1,296 subjects, 51.1% were male. Among the respon-dents, 34.2% belonged to the age group 20 – 29 years and 72.1% were married. Regarding the variable race/color, 54.0% self-reported as brown and 38.7% as white. Among the par-ticipants, 40.6% were born in the South and 30.8% were born in the state of Mato Grosso. With regard to education, 31.2% had 5 – 8 years of schooling and 32.0% had per capita family income lower than the minimum wage. The prevalence of hypertension was 22.0%, being 26.9% (95%CI 23.14 – 30.93) for males and 17.6% (95%CI 15.15 – 20.28) for females (Table 1).
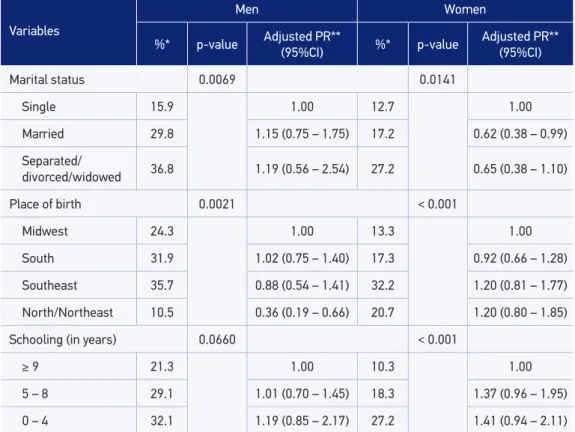
The prevalence of hypertension in men, according to demographic and socioeconomic variables was associated with age, marital status, and place of birth, as shown in the Table 2. However, after adjusting for age, marital status lost its signiicance as seen in the 95%CIs that consider the value 1.0. In relation to the place of birth, those who were born in the North and Northeast regions had a lower prevalence (PR = 0.36, 95%CI 0.19 – 0.66) than those who were born in the Midwest region, regardless of age (Table 2).
Table 1. Demographic and socioeconomic characteristics of adults interviewed, Legal Amazon,
Mato Grosso, 2007.
Variables n %*
Gender
Male 506 51.08
Female 790 48.92
Age (in years)
20 – 29 392 34.15
30 – 39 370 29.79
40 – 49 316 23.29
50 – 59 218 12.77
Marital status
Single 240 20.47
Married 936 72.05
Separated/divorced/widowed 120 7.48
Race/color
White 500 38.67
Black 72 6.50
Brown 702 53.96
Yellow/indigenous 13 0.87
Place of birth
Midwest 463 37.31
South 534 40.57
Southeast 140 10.16
North/Northeast 154 11.96
Schooling (in years)
≥ 9 513 40.93
5 – 8 389 31.17
0 – 4 391 27.90
Per capita family income (in minimum wages)
< 1 696 54.19
1 – 1.99 354 27.47
≥ 2 238 18.34
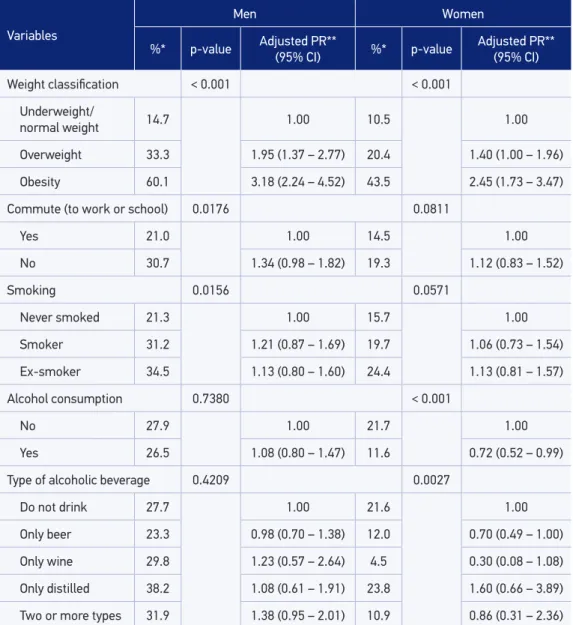
as underweight or normal weight. With regard to smoking, even though it was veriied as a signiicant association with hypertension, when adjusting for age this association disap-pears, as shown in Table 3.
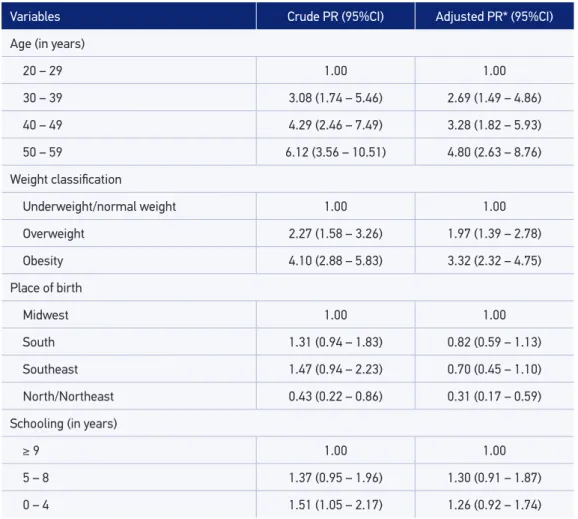
The variables shown in Tables 2 and 3 with p ≤ 0.20 were used in the multiple analyses and the following remained associated with hypertension: age, weight, and place of birth. The prevalence of hypertension increases with increasing age. Regarding the weight clas-siication, the prevalence of hypertension among those who presented overweight was almost 100% higher compared to the underweight and normal weight, for those obese the prevalence was 232% higher, regardless of age, place of birth, and schooling. With regard to the place of birth, those who were born in the North and Northeast presented approx-imately 70% lower prevalence for hypertension when compared to those who were born in the Midwest region, indicating a protective factor for the disease, adjusted by the other variables in the model. The variable schooling was used in the inal model for adjusting for other variables, as shown in Tables 4 and 5.
Table 2. Prevalence and prevalence ratio of hypertension in men and women according to
demographic and socioeconomic variables, Legal Amazon, Mato Grosso, 2007.
PR: prevalence ratio; 95% CI:95% conidence interval; *percentage of the weighted sample; **adjusted only for age.
Variables
Men Women
%* p-value Adjusted PR**
(95%CI) %* p-value
Adjusted PR** (95%CI)
Marital status 0.0069 0.0141
Single 15.9 1.00 12.7 1.00
Married 29.8 1.15 (0.75 – 1.75) 17.2 0.62 (0.38 – 0.99)
Separated/
divorced/widowed 36.8 1.19 (0.56 – 2.54) 27.2 0.65 (0.38 – 1.10)
Place of birth 0.0021 < 0.001
Midwest 24.3 1.00 13.3 1.00
South 31.9 1.02 (0.75 – 1.40) 17.3 0.92 (0.66 – 1.28)
Southeast 35.7 0.88 (0.54 – 1.41) 32.2 1.20 (0.81 – 1.77)
North/Northeast 10.5 0.36 (0.19 – 0.66) 20.7 1.20 (0.80 – 1.85)
Schooling (in years) 0.0660 < 0.001
≥ 9 21.3 1.00 10.3 1.00
5 – 8 29.1 1.01 (0.70 – 1.45) 18.3 1.37 (0.96 – 1.95)
In women, the prevalence of hypertension according to demographic and socioeco-nomic variables is presented in Tables 2 and 3. Hypertension was associated with age (p < 0.001), marital status, place of birth, and schooling. When adjusting for age, both place of birth and schooling lost signiicance, indicating that age is an important con-founding factor for hypertension, as also veriied by reversing the PR in the category of married (Table 2).
Table 3. Prevalence and prevalence ratio of hypertension in men and women according to anthropometric variables and lifestyles, Legal Amazon, Mato Grosso, 2007.
PR: prevalence ratio; 95%CI: 95% conidence interval; *percentage of the weighted sample; **adjusted only for age.
Variables
Men Women
%* p-value Adjusted PR**
(95% CI) %* p-value
Adjusted PR** (95% CI)
Weight classiication < 0.001 < 0.001
Underweight/
normal weight 14.7 1.00 10.5 1.00
Overweight 33.3 1.95 (1.37 – 2.77) 20.4 1.40 (1.00 – 1.96)
Obesity 60.1 3.18 (2.24 – 4.52) 43.5 2.45 (1.73 – 3.47)
Commute (to work or school) 0.0176 0.0811
Yes 21.0 1.00 14.5 1.00
No 30.7 1.34 (0.98 – 1.82) 19.3 1.12 (0.83 – 1.52)
Smoking 0.0156 0.0571
Never smoked 21.3 1.00 15.7 1.00
Smoker 31.2 1.21 (0.87 – 1.69) 19.7 1.06 (0.73 – 1.54)
Ex-smoker 34.5 1.13 (0.80 – 1.60) 24.4 1.13 (0.81 – 1.57)
Alcohol consumption 0.7380 < 0.001
No 27.9 1.00 21.7 1.00
Yes 26.5 1.08 (0.80 – 1.47) 11.6 0.72 (0.52 – 0.99)
Type of alcoholic beverage 0.4209 0.0027
Do not drink 27.7 1.00 21.6 1.00
Only beer 23.3 0.98 (0.70 – 1.38) 12.0 0.70 (0.49 – 1.00)
Only wine 29.8 1.23 (0.57 – 2.64) 4.5 0.30 (0.08 – 1.08)
Only distilled 38.2 1.08 (0.61 – 1.91) 23.8 1.60 (0.66 – 3.89)
As observed in males, among women hypertension associated with weight, regardless of age. The prevalence of hypertension was 40% higher in the category overweight and 145% higher among those obese compared to those with normal weight or underweight (Table 3). Another association that remained signiicant after adjusting for age was the con-sumption of alcohol. The prevalence of hypertension is approximately 28% lower among women who consume alcohol. In relation to commute, smoking, and the type of alcoholic beverage, the association disappears when adjusting for age.
Table 5 shows the variables included in the inal model for women. After adjustment, the classiication of the weight and type of alcoholic beverage remain associated with hyper-tension, regardless of age and education. The prevalence of hypertension is approximately 140% higher in obese women compared to normal weight or underweight and approxi-mately 70% lower in those who consume wine, even when considering the confounders and modifying efect variables.
Table 4. Crude and adjusted prevalence ratios of the association between hypertension and study
variables in men, Legal Amazon, Mato Grosso, 2007.
PR: prevalence ratio; 95% CI: 95% conidence interval; *adjusted for schooling.
Variables Crude PR (95%CI) Adjusted PR* (95%CI)
Age (in years)
20 – 29 1.00 1.00
30 – 39 3.08 (1.74 – 5.46) 2.69 (1.49 – 4.86)
40 – 49 4.29 (2.46 – 7.49) 3.28 (1.82 – 5.93)
50 – 59 6.12 (3.56 – 10.51) 4.80 (2.63 – 8.76)
Weight classiication
Underweight/normal weight 1.00 1.00
Overweight 2.27 (1.58 – 3.26) 1.97 (1.39 – 2.78)
Obesity 4.10 (2.88 – 5.83) 3.32 (2.32 – 4.75)
Place of birth
Midwest 1.00 1.00
South 1.31 (0.94 – 1.83) 0.82 (0.59 – 1.13)
Southeast 1.47 (0.94 – 2.23) 0.70 (0.45 – 1.10)
North/Northeast 0.43 (0.22 – 0.86) 0.31 (0.17 – 0.59)
Schooling (in years)
≥ 9 1.00 1.00
5 – 8 1.37 (0.95 – 1.96) 1.30 (0.91 – 1.87)
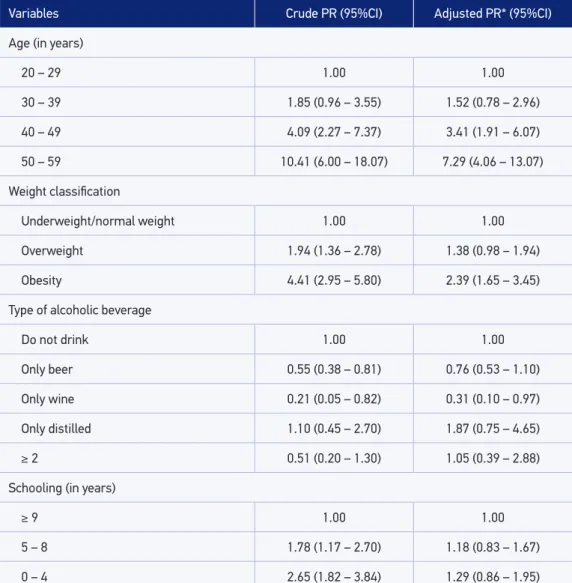
Table 5. Crude and adjusted prevalence ratios of the association between hypertension and study variables in women, Legal Amazon, Mato Grosso, 2007.
PR: prevalence ratio; 95% CI:95% conidence interval; *adjusted for schooling.
Variables Crude PR (95%CI) Adjusted PR* (95%CI)
Age (in years)
20 – 29 1.00 1.00
30 – 39 1.85 (0.96 – 3.55) 1.52 (0.78 – 2.96)
40 – 49 4.09 (2.27 – 7.37) 3.41 (1.91 – 6.07)
50 – 59 10.41 (6.00 – 18.07) 7.29 (4.06 – 13.07)
Weight classiication
Underweight/normal weight 1.00 1.00
Overweight 1.94 (1.36 – 2.78) 1.38 (0.98 – 1.94)
Obesity 4.41 (2.95 – 5.80) 2.39 (1.65 – 3.45)
Type of alcoholic beverage
Do not drink 1.00 1.00
Only beer 0.55 (0.38 – 0.81) 0.76 (0.53 – 1.10)
Only wine 0.21 (0.05 – 0.82) 0.31 (0.10 – 0.97)
Only distilled 1.10 (0.45 – 2.70) 1.87 (0.75 – 4.65)
≥ 2 0.51 (0.20 – 1.30) 1.05 (0.39 – 2.88)
Schooling (in years)
≥ 9 1.00 1.00
5 – 8 1.78 (1.17 – 2.70) 1.18 (0.83 – 1.67)
0 – 4 2.65 (1.82 – 3.84) 1.29 (0.86 – 1.95)
DISCUSSION
The prevalence of hypertension found in the cities that were part of this study was simi-lar to that obtained in other studies carried out in Mato Grosso with adults of both genders, in the same age group, as noted in the cities of Sinop20, Cuiabá,21 and Nobres22.
In the United States, hypertension afects 33.6% of adults and the estimates reveal that more than 74 million North Americans are hypertensive, accounting for 50% of total mor-tality by cardiovascular diseases24.
In the present study, the prevalence of hypertension was higher in males compared to females. Similar results were found in a study carried out in Cuiabá, Mato Grosso, where the prevalence of hypertension was 33.5% in males and 23.5% in females21.
The variable age was signiicantly associated with hypertension in both genders. The prev-alence of hypertension both in males and in females was higher among individuals aged 50–59 years. Similar results were observed in studies carried out in Brazil with association between age and hypertension for individuals aged ≥ 40 years22,23,25-28. This factor may be related to the hemodynamic changes of hypertension such as the increased cardiac output or peripheral vascular resistance starting between 20 and 30 years of age; however, high lev-els occur between 30 and 50 years of age3. The age variable was maintained in the models for confounding adjustment, showing what is the independent relationship of other vari-ables with high blood pressure.
Although the prevalence of hypertension was lower in males who were born in the North and Northeast of Brazil compared to those males who were born in the Midwest region, a study of association between hypertension and behavioral aspects such as stress and migra-tion indicates that the migramigra-tion presented itself as a risk factor for hypertension. This is due to changes in eating habits and lifestyle of individuals, characterizing as a stressor and resulting in an increase in blood pressure mediated by the central nervous system and neu-rohormonal processes29.
Another signiicant variable in this study was the classiication of weight categorized by BMI. Considered a non-communicable chronic disease, obesity is also a major public health problem in developed as well as in developing countries, causing a great impact on the pop-ulation’s morbidity pattern besides being considered an important risk factor for several morbidities30. In this study, the prevalence ratio of hypertension observed in both obese men and women was about three times compared to non-obese individuals. This inding is similar to those obtained in other studies in Mato Grosso20,21. Other studies also indicate the importance of BMI in association with hypertension25-27,31,32.
Obesity mechanisms associated with hypertension are complex and not yet completely understood. The main mechanisms involved are as follows: sympathetic overactivity, insulin resistance, hyperactivity of renin–angiotensin–aldosterone system, changes in the secretion of adipokines and fatty acids by the adipose tissue, endothelial dysfunction, in addition to losses caused by structural and functional changes of renal medulla33. Furthermore, weight gain results in an increase in sympathetic activity, insulin resistance, and hyperinsulinemia. As per the kidney function, hyperinsulinemia promotes tubular reabsorption of sodium and water and, consequently, vasoconstriction hypertension. Visceral adiposity accumulation is directly involved in the genesis of an inlammatory and atherogenic process34.
association only for females, reducing the prevalence of hypertension in approximately 70% when the women reported consumption of wine compared to those who do not drink.
A Women’s Health study performed in the United States found a J-shaped association between alcohol consumption and hypertension, adjusted for age and lifestyle, and concluded that low-to-moderate alcohol consumption decreases the risk of hypertension in females35.
Combined analysis of eight prospective studies in North America and Europe found an inverse association between alcohol and risk of coronary heart disease in all age groups36. Another meta-analysis with articles analyzed until October 2009 by a research in PubMed and Embase found that the overall relationship between cardiovascular mortality and alcohol intake was inter-preted as a J-shaped curve, revealing a protective efect in intake amounts from 5 to 10 g/day37. The consumption of alcohol raises blood pressure and its efects vary according to gen-der, ethnicity, and consumption characteristics. The magnitude of the risk of alcohol con-sumption on hypertension is determined by the amount and frequency of ethanol intake38. The Ministry of Health established as moderate alcohol consumption the intake of up to one drink/day for women (15 g ethanol) and up to two drinks/day for men (30 g ethanol). The con-sumption of daily doses above this standard is considered harmful and a risk to individuals’ health39. The mechanisms involved in the increase of blood pressure associated with the increase of alcohol intake can be determined by direct inluence on the heart or the vascular smooth muscle, or by stimulation of the sympathetic nervous system or renin–angiotensin–aldo-sterone system and may increase the plasma cortisol levels by magnesium loss in the urine. Alcohol consumption has been associated not only to increased blood pressure levels but also to the various elements of the metabolic syndrome, such as increased levels of tri-glycerides, abdominal adiposity, and high level of uric acid40.
Worldwide, it is estimated that the alcohol-related mortality is equal to 5.9% of the total mortality and alcohol is a risk factor that contributes most to the global burden of disease, accounting for 5.1% of them. In Brazil, the mortality rate, standardized by age by cirrhosis of the liver was 28.8 and 5.8 per 100,000 inhabitants aged ≥ 15 years41.
This study is a population-based survey with data collection carried out in the home of those interviewed by a team of trained interviewers, with suicient sample size to evaluate the associations performed; however, the cross-sectional design is a limitation that makes it impossible to establish causal relationships between exposure and the disease development42.
The indings related to hypertension in major cities as well as in the small places rein-force the concern with this public health problem and the knowledge of its determinants is essential to apply measures and preventive actions. Therefore, it is important to intensify the hypertension control programs, as well as other cardiovascular risk factors to control or reduce this prevalence through prevention and a better quality of life of the population.
ACKNOWLEDGMENTS
1. Moraes AAL, Avezum Junior A. O Impacto da Hipertensão Arterial no Mundo. In: Brandão AA, Amodeo C, Nobre F. Hipertensão. Rio de Janeiro: Elsevier; 2012. p. 11-19. 2. Moreira JPL, Moraes JR, Luiz RR. A prevalência
de hipertensão arterial sistêmica autorreferida nos ambientes urbano e rural do Brasil: um estudo de base populacional. Cad Saúde Pública 2013; 29(1): 62-72. 3. Sociedade Brasileira de Hipertensão (SBH), Sociedade
Brasileira de Cardiologia (SBC) e Sociedade Brasileira de Nefrologia (SBN). VI Diretrizes brasileiras de hipertensão arterial. Arq Bras Cardiol 2010; 95(1 Suppl 1):1-51. 4. Ministério da Saúde. Secretaria de Atenção à Saúde.
Departamento de atenção básica. Coordenação Nacional de Hipertensão e Diabetes. Hipertensão arterial e diabetes mellitus. Morbidade auto referida segundo o VIGTEL, 2009. Cadastro de Portadores do SIS-HIPERDIA, 2010. Brasília: Ministério da Saúde; 2011. Disponível em: http://www.sbn.org.br/pdf/ vigitel.pdf (Acessado em 28 de janeiro de 2014). 5. National Heart, Lung, and Blood Institute. Risk factors
for high blood pressure. Disponível em: http://www. nhlbi.nih.gov/health/health-topics/topics/hbp/atrisk (Acessado em 4 de fevereiro de 2014).
6. Colombo FC. Hipertensão arterial na mulher. In: Paola AAV, Barbosa MM, Guimarães JI. Cardiologia: livro texto da Sociedade Brasileira de Cardiologia. São Paulo: Manole; 2011. p. 628-30.
7. Wottrich SH, Ávila CM, Machado CC, Goldmeier S, Dillenburg D, Kuhl CP, et al. Gênero e manifestação de stress em hipertensos. Estud Psicol (Campinas) 2011; 28(1): 27-34.
8. Alves M, Godoy SCB. Procura pelo serviço e atenção à saúde do trabalhador e absenteísmo-doença em um hospital universitário. REME Rev Min Enferm 2001; 15(1/2): 73-81. 9. Noblat ACB, Lopes MB, Lopes GB, Lopes AA. Complicações da hipertensão arterial em homens e mulheres atendidos em um ambulatório de referência. Arq Bras Cardiol 2004; 83(4): 308-13.
10. Hajjar I, Kotchen JM, Kotchen TA. Hypertension: trends in prevalence, incidence, and control. Annu Rev Public Health 2006; 27: 465-90.
11. Alves RF, Silva RP, Ernesto MV, Lima AGB, Souza FM. Gênero e saúde: o cuidar do homem em debate. Psicol Teor Prat 2011; 13(3): 152-66.
12. Guimarães LV, Lima-Lopes MA. Segurança alimentar e nutricional da população residente na área de abrangência da BR-163. Cuiabá: Instituto de Saúde Coletiva; 2005. 13. Espinosa MM, Guimarães LV, Lima-Lopes MP,
Martins MSAS, Guerra, LDS, Menegaz, A, et al.
Análises utilizadas na precisão da amostragem por conglomerados em dois estágios de inquéritos de base populacional. In: Guimarães LV, Pignatti MG, Souza DPO. Saúde Coletiva: múltiplos olhares em pesquisa. Cuiabá: Editora Universitária; 2012. p. 295-306. 14. Brasil. Presidência da República. Plano Amazônia
Sustentável: diretrizes para o desenvolvimento sustentável da Amazônia Brasileira. Brasília: Ministério do Meio Ambiente; 2008.
15. Hu G, Jousilahti P, Antikainen R, Tuomilehto J. Occupational, commuting, and leisure-time physical activity in relation to cardiovascular mortality among Finnish subjects with hypertension. Am J Hypertens 2007; 20(12): 1242-50. 16. World Health Organization. Obesity and overweight.
Geneva: WHO; 2014. Disponível em: http://www. who.int/mediacentre/factsheets/fs311/en/ (Acessado em 28 de janeiro de 2014).
17. World Health Organization. Child growth standards. Physical status: the use and interpretation of anthropometry. Geneva: WHO; 1995.
18. Szwarcwald CL, Damacena GN. Amostras complexas em inquéritos populacionais: planejamento e implicações na análise estatística dos dados. Rev Bras Epidemiol 2008; 11(Suppl 1): 38-45.
19. Zou G. A modiied Poisson regression approach to prospective studies with binary data. Am J Epidemiol 2004; 159(7): 702-6.
20. Martins MSAS, Ferreira MG, Guimarães LV, Vianna LAC. Hipertensão arterial e estilo de vida em Sinop, município da Amazônia Legal. Arq Bras Cardiol 2009; 94(5): 639-44.
21. Barbosa LS, Scala LCN, Ferreira MG. Associação entre marcadores antropométricos de adiposidade corporal e hipertensão arterial na população adulta de Cuiabá, Mato Grosso. Rev Bras Epidemiol 2009; 12(2): 237-47. 22. Rosário TM, Scala LCN, França GVA, Pereira MR, Jardim PCBV. Fatores associados à hipertensão arterial sistêmica em Nobres-MT. Rev Bras Epidemiol 2009; 12(2): 248-57. 23. Instituto Brasileiro de Geograia e Estatística. Pesquisa Nacional de Saúde 2013: percepção do estado de saúde, estilos de vida e doenças crônicas. Rio de Janeiro: IBGE; 2014.
24. Lloyd-Jones D, Adams RJ, Brown TM, Carnethon M, Dai S, De Simone G, et al. Executive summary: heart disease and stroke statistics 2010 update: a report from the American Heart Association. Circulation 2010; 121(7): 948-54. 25. Silva DAS, Petroski EL, Peres MA. Pré-hipertensão e
26. Ulbrich AZ, Bertin RL, Stabelini Neto A, Bozza R, Piola TS, Campos W. Associação do estado nutricional com a hipertensão arterial de adultos. Motriz Rev Educ Fís (Online) 2011; 17(3): 424-30.
27. Ulbrich AZ, Bertin RL, Bozza R, Stabelini Neto A, Lima GZS, Carvalho T, et al. Probabilidade de hipertensão arterial a partir de indicadores antropométricos em adultos. Arq Bras Endocrinol Metab 2012; 56(6): 351-7. 28. Piccini RX, Facchini LA, Tomasi E, Siqueira FV, Silveira DS, Thumé E, et al. Promoção, prevenção e cuidado da hipertensão arterial no Brasil. Rev Saúde Pública 2012; 46(3): 543-50.
29. Lima Junior E, Lima Neto E. Hipertensão arterial: aspectos comportamentais – estresse e migração. Rev Bras Hipertens 2010; 17(4): 210-25.
30. Pinho CPS, Diniz AS, Arruda IKG, Batista Filho M, Coelho PC, Sequeira LAS, et al. Prevalência e fatores associados à obesidade abdominal em indivíduos na faixa etária de 25 a 59 anos do Estado de Pernambuco, Brasil. Cad Saúde Pública 2013; 29(2): 313-24. 31. Scala LCN. A importância e o controle do sobrepeso
e da obesidade. Revista Fact Risco 2014; 32: 19-32. 32. Correia MLG, Haynes WG, Mark AL. Merchanism of
obesity- related hypertension: from insulin to leptin. Rev Bras Hipertens 2001; 8: 374-81.
33. Amer NM, Marcon SS, Santana RG. Índice de massa corporal e hipertensão arterial em indivíduos adultos no Centro-Oeste do Brasil. Arq Bras Cardiol 2011; 96(1): 47-53.
34. Lino MZR, Muniz PT, Siqueira KS. Prevalência e fatores associados ao excesso de peso em adultos: inquérito populacional em Rio Branco, Acre, Brasil, 2007-2008. Cad Saúde Pública 2011; 27(4): 797-810.
35. Sesso HD, Cook NR, Buring JE, Manson JE, Gaziano JM. Alcohol consumption and the risk of hypertension in women and men. Hypertension 2008; 51(4): 1080-7. 36. Hvidtfeldt UA, Tolstrup JS, Jakobsen MU, Heitmann
BL, Grønbæk M, O’Reilly E, et al. Alcohol intake and risk of coronary heart disease in younger, middle-aged, and older adults. Circulation 2010; 121(14): 1589-97. 37. Costanzo S, Di Castelnuovo A, Donati MB, Iacoviello
L, Gaetano G. Alcohol consumption and mortality in patients with cardiovascular disease. a meta-analysis. J Am Coll Cardiol 2010; 55(13): 1339-47.
38. Fuchs SC. Fatores de risco para hipertensão arterial. In: Brandão AA, Amodeo C, Nobre F, Fuchs FD. Hipertensão. 2. ed. Rio de Janeiro: Elsevier; 2012. p. 3-10.
39. Brasil. Ministério da Saúde. A política do Ministério da Saúde para a atenção integral a usuários de álcool e outras drogas. Brasília: Ministério da Saúde; 2003. 40. Bombig MTN, Póvoa R. A importância do álcool. In:
Passarelli Júnior O, Fonseca FAH, Colombo FMC, Scala LCN, Póvoa R. Hipertensão arterial de difícil controle: da teoria à prática clínica. São Paulo: Segmento Farma; 2008. p. 344-351.
41. World Health Organization. Global status report on alcohol and health 2014. Geneva: WHO; 2014. 42. Rothman KJ. Epidemiologia moderna. In: Rothman
KJ, Greenland S, Lash TL. Tipos de estudos epidemiológicos. Porto Alegre: Artmed; 2011. p. 107-122.
Received on: 06/18/2015