Investigation of the Relationship between the Spatial Visualization Success
and Visual/Spatial Intelligence Capabilities of Sixth Grade Students
Kursat Yenilmez
Assoc. Prof. Dr., Eskisehir Osmangazi University, Eskisehir, Turkey, [email protected]
Ozlem Kakmaci
Mathematics Teacher, Istanbul, Turkey, [email protected]
The main aim of this research was to examine the relationship between the spatial visualization success and visual/spatial intelligence capabilities of sixth grade students. The sample of the research consists of 1011 sixth grade students who were randomly selected from the primary schools in Eskisehir. In this correlational study, data were collected by the Visual/Spatial Intelligence and Spatial Ability Tests. Data were analyzed by, descriptive statistics techniques, ANOVA and t-test. In addition, correlation analysis was used to search correlations between the spatial visualization success and visual/spatial intelligence capabilities of sixth grade students. According to the results of the study, there were significant differences
among students’ spatial visualization success with respect to students’ gender,
mathematics achievement, interest in geometry and visual/spatial intelligence levels. In addition, there was positive, significant but low correlation between the spatial visualization success and visual/spatial intelligence capabilities of sixth grade students.
Keywords: Spatial ability, visual/spatial intelligence, visualization, spatial visualization, intelligence capabilities
INTRODUCTION
expressions of thoughts by the way of shapes, signs and symbols and the accuracy of which is proven by the way of intuitive and logical inference. Those ideas are expressed in mathematics helps the ideas to be understood better, and this identity of mathematics improves thought system of individuals. Another branch of mathematics which is included in mathematics and which is effective in the visualization of mathematical processes is geometry. The purpose of geometry is generally expressed as the
‘recognition of the properties of geometrical shapes and objects’ (Tekin et. al., 2008).
By moving from the objectives of the primary school grades regarding Geometry subfield, it is possible to provide a comprehensive understanding for the mathematical concepts and to visualize them by using geometrical figures besides to enrich the thinking world of the children. It is hard to explain and comprehend the abstract concepts. Concrete words are used to make abstract concepts comprehensible. It is called concretization. The subject of mathematics is abstract, so mathematics must be concretized by symbolizing the concrete objects (Altunay, 2004). During teaching of
mathematics, the concrete materials will help the increase of the students’ success. That
the learning environments include activities supported with concrete materials will increase the student attention and as a result this affects increasing of the success
(Şişman, 2007). While teaching mathematical concepts, if concretization and the
activities which students can understand are preferred, if mathematics is made attractive and motivating and then the student can learn as if s/he is playing a game in less time
and experiences love and achievement instead of fear. Doğanay (2002), who claims that
concretization and exemplification of the concepts which are hard to understand make it easy to learn, proposes to support them with questions (as cited in Girgin & Ertürk, 2006). Also, graphical materials have been developed to use in concept teaching. The most important of them are meaning analysis tables and concept maps.
Mathematics apart from having abstract discussions in itself has relations with many
other sciences. It will be effective on students’ mathematical achievements and their
interest towards mathematics to introduce these relations while presenting different faces of mathematics to students who have different intelligence domains (Köroğlu &
Yeşildere, 2004).
A satisfactory success can be achieved by thinking mathematics as ‘a journey from abstract to concrete’ at schools, planning the content of the lessons in accordance with
the constructive learning theory and multiple intelligence theory, enriching the content of the lessons by using materials and activities which help to concretize abstract concepts that students have difficulties to understand, emphasizing the fact that mathematics exists in everyday life rather than being just a lesson and supporting the curiosity of students and their efforts to discover by correlating the examples with everyday life. It is possible to encounter studies about the fact that carrying out an education by creating materials which will provide you to correlate mathematics with everyday life and also which will allow you to touch mathematics with your hands by
concretizing it contributes positively to students’ conceptual improvements and
comment according to their images and decide accordingly. A great majority of the mathematical concepts are abstract things. Many researchers emphasize the importance of visual thinking and visualization for teaching mathematics (Horgan, 1993; Dreyfus, 1991; Bishop, 1989; Davis & Anderson, 1979).
Strong and Smith (2002) have identified spatial visual as the imagining of the shapes movements in different positions or the manipulation of the objects in the mind talentedly. Clements (1998) defined spatial sight as to be able to move two or three-dimensional objects in one’s mind and to be able to understand them. Spatial sight is the ability to think that we are in another place, to imagine how this place looks like and also it is the skill that we use for understanding how the situation is when we slightly change the pose of the objects.
Battista (1990) has explained that one of the most important factors in geometrical success and geometrical problem solving is spatial ability. Known as the talent of spatial images, spatial ability is a necessary quality in the learning of many subjects in mathematics and geometry. The beginning of the modern studies about spatial ability dates back to the search published by Galton in 1918 (as cited in Friedman, 1992). Spatial ability has been seen to have at least two different sub-dimensions since the studies in 1930 (Clements, 1998). These sub-dimensions are the abilities of spatial visualization and mental rotation. The spatial visualization ability is described as the ability to change and use pictured object or a piece of this object in mind. Mental rotation ability has been described as the relation of the elements in a spatial configuration and the ability of understanding the new arrangement composed by the changing of the rotation of these elements or people. The concept of spatial ability shortly contains the skills about using the form of space and geometry (Olkun, 2003). It has been mentioned about the two sub-dimensions of spatial ability as spatial relationships and spatial visualization (McGee, 1979; Burnett & Lane, 1980; Elliot & Smith, 1983; Pellegrino et. al., 1984; Clements and Battista, 1992). When it is said visualization, mental rotations and spatial skills, even though the geometry comes to mind, these skills are also used in algebraic, applied and verbal mathematical problems in which situations such as drawing, producing models and making changes in the model take part. The purpose of the geometry in which the mental activities made on the figures are highlighted can be explained as identifying the features of geometrical objects in three-dimensional space and plane, finding the relations between them, defining geometric place and explaining and expressing rotations (Tekin et. al., 2008). Visualization enables better understanding of complex and abstract mathematical subjects. Pictures and shapes prompt the mental processes like the representations of the examples, the understanding of the complex operation intuitively or the concretization of the abstract relations and processes. The most useful thing about visualization in mathematics is that it enables a very abstract thing to a less abstract or a concrete thing. It is very important especially for the students having difficulty in understanding abstract mathematical subjects. Another use of visualization is that it develops the ability of thinking dimensionally in individuals. The capture of concepts of shapes and dimensions
2005). The forming of a geometrical shape in space in two or three dimensions mentally and look from different points of view, spatial visualization is the most important part of geometrical thinking. Geometry is a natural field in which the students develop the ability of reasoning and conjecturing by proving the geometrical theorems. Geometrical modelling and spatial reasoning are useful in the interpretation and depiction the physical environments, also they are useful tools in problem solving process (Böke, 2000). In spatial visualization, the ability to visualize new situations in our minds that will be created as a result of moving two or three-dimensional objects consisting of one or more pieces and the images of these pieces in three dimensional space is discussed (Burnet and Lane, 1980; Olkun, 2003). This mental visualization process may contain activities such as folding, re-folding (McGee, 1979) and re-arranging of the pieces, and covering the surface (Battista et. al., 1989; Smith et. al., 1999). When standard tests which are used for assessing these skills are analyzed, in questions about spatial relations, it is necessary for a student to decide which object among a group of objects given on a paper is the rotated or reversed form of the original figure provided at first (Pellegrino et. al., 1984). In other words, the student is to be able to turn two or three-dimensional geometric forms over and over in his/her mind as a whole and to recognize them in various positioning/from different viewpoints. In these tests, the emphasis is put on the correctness rather than speed in items which are getting increasingly complex as opposed to spatial relations (Olkun & Altun, 2003). The spatial visualization skills are needed to be successful in various disciplines such as mathematics and geometry at first, then physics and chemistry and in many working fields such as engineering. The teachers who will teach mathematics and geometry should have at least basic spatial skills. (Olkun et. al., 2007). So, teachers should be informed about the new mathematics curriculums and they should choose the methods and the instruments or equipment carefully. Teachers should be caring about the multiple intelligence theory and they should teach according to the types of intelligence of their students. As Gardner (1985)
has pointed out that “spatial intelligence” is one of intelligence types that people have.
There is a concurrence among mathematics educators and researchers that this ability helps an individual to understand the surrounding and the various field of mathematics (Usiskin, 1987).The people who has powerful visual/spatial intelligence learn at best by visualizing entities, events or facts or by studying with images, drawings and colors (Saban, 2002). It has been seen in the studies that using mathematical modelling, teaching materials and computer applications throughout the teaching process have a positive effect on improving spatial skills (Keskin, 2008; Toptaş, 2008; Yolcu, 2008; Guzman, 2002, Sinoplu & Olkun, 2004).
prospective primary school mathematics teachers were mainly occurred at Multiple
Structure thinking level of SOLO model (Göktepe & Özdemir, 2013). Also in the studies carried out before, a strong correlation was found between mathematical achievement and spatial ability (Kayhan, 2005; Tai et. al., 2003; Seng & Chan, 2000; Turgut & Yılmaz, 2012). Besides, it was determined in some studies that the spatial abilities of prospective mathematics teachers were quite low and it did not differ in terms of gender, pre-school education, academic achievement and the type of the faculty that the students are studying (Turgut & Yenilmez, 2012). Wheatley (1991), paid attention to create models which would improve visualization senses of students while teaching geometry and rotations. In conclusion, when students were encouraged to use description, their mathematical achievements would also increase. When visualization skills were increased, it was seen that their mathematical abilities and skills were also increased.
The purpose of the research is to determine the relation between the 6th grade students’
spatial visualization success and the spatial intelligence by determining the students’
spatial intelligence level and spatial visualization success. This research is considered as important in identifying the 6thgrade students’ spatial visualization success and gender, mathematical success, the interest in geometry and whether their spatial visualization change. This research is also important in generating a solution and after, also, the other important things about this research are that it gives idea about how students’ perceive the rotation of the shapes in different angles which is in the new curriculum of the primary education, and as a result how this subject should be taught and what should be remarkable and it helps the studies to be done in this field in the future. As a result of the findings obtained in this study, it is predicted that there can be an opportunity to have an evaluation of realistic data about the spatial visualization achievements of the sixth grade students. This study is limited with the data regarding 2008-2009 education year and it was accepted that students participated in this study were realistic while they were responding to the scale which was conducted to determine their spatial visualization skills.
METHOD
The sample of the research includes 1011 students chosen randomly among all the 6th grade students in Eskisehir in 2008-2009 education year. The percentage and frequency
(f) distribution regarding the sample group sixth grade students’ gender, mathematics
marks from the latest reports and interests in geometry were given in Table 1. Table 1: The demographic features of the sample group students
f % f % f %
Gender Interest in Geometry Mathematical Achievement
Female 500 49,5 Low 45 4,4 Poor 48 4,7
Male 511 50,5 Middle 597 59,1 Fair 48 4,7
High 369 36,5 Average 215 21,3
Good 300 29,7
When Table 1 is analyzed, it is seen that the distribution of female and male students participated in this study indicated a homogenous distribution, the number of students who have poor and fair achievement levels is less than the number of students who have average, good and excellent achievement levels, the number of students who have middle level interest in geometry is more than the other levels.
In this study, in order to be able to evaluate the correlation between the spatial visualization achievements of sixth grade students and their visual/spatial intelligences, visual/spatial intelligence test and spatial skills tests were carried out to collect the necessary data from students. The tests were conducted by the researcher in the study through visiting the research schools.
In this study, it was tried to analyze the correlation between spatial visualization skills of sixth grade students and their visual/spatial intelligences. Since this study used a research model which is trying to determine the existence and level of covariance between two or more variables (Karasar, 2005).
The data collection instruments were analyzed through reviewing the previous studies and thesis regarding visual/spatial intelligence test and thereafter the items of the data collection instrument were prepared as a draft by the researchers. In order to provide the content validity of the data collection instrument which is visual/spatial intelligence test, it was paid attention for each of the test items to illustrate the features of people who have visual/spatial intelligence and to assess the situations which was aimed to be tested at the desired level and the opinions of experts were taken. At the time same time, a group of mathematics educators analyzed the items in accordance with middle school curriculum and a group of middle school mathematics teachers analyzed the items for suitability in view point of students. Correspondence percentages of the comments were calculated and they were acceptable level. By this way, validity of the measure was obtained. To determine the reliability of the instrument, 85 students have been applied to this scale as a pilot study. The Cronbach Alpha value calculated as 0,83. The obtained values were accepted as a high level reliable value for the reliability of the data collection instrument. The data collection instrument prepared as a draft at first was made ready to apply after re-editing through the opinions of the expert.
The information form is for determining the characteristics of the 6th grade students. The
items of the information form are gender, the latest Mathematics mark and the students’
interest in geometry. The spatial intelligence test is consisted of 20 items in five point Likert scale prepared by the researchers to determine the spatial intelligence of the 6th grade students.
Wheatley Spatial Ability Test (1996), which the reliability and validity studies were conducted and Cronbach alpha was calculated as 0,97, was used in this study. Spatial
ability test measures the students’ ability to rotate the shapes so; there are 5 choices that
show the rotated or unrotated form for twenty different shapes. The students are asked to
thick “yes” for the rotated form of the main form or “no” for the unrotated form of the
In order to analyze the obtained data, first of all, the condition of the sample was evaluated according to the features of the students participating in the study. Frequency and percentages regarding variable levels were used for this. Later on, whether spatial visualization achievements of the students differ according to variables was evaluated by using one-way ANOVA and t-test. There are 5 degrees in spatial intelligence test. Their
meanings are “0” for “Never”, “1” for “Barely”, “2” for “Partially”, “3” for “Fairly”, “4” for “Completely”. The arithmetical average of the results has been calculated. The level of developments has been grouped in three degrees. 0-1,13 is the 1st level, 1,34-2,67 is the 2nd level, 2,68-4,00 is the 3rd level.
In the evaluation of the spatial ability test, the number of the questions that each students answers or not has been determined. Without caring the unanswered questions, the half of the wrong answers have been subtracted from the true answers. Besides, whether
there was a correlation between students’ visual/spatial intelligence levels and their spatial visualization achievements were examined with the help of a Pearson correlation analysis.
FINDINGS
In this part, the findings obtained from data analysis and comments are given.
The Difference in Spatial Visualization Achievements by Gender
Whether the spatial visualization achievements of the sixth grade students forming the sample group of the study differ by gender variable was searched with t-test and the results are displayed in Table 2.
Table 2: t- Test Results regarding whether Spatial Visualization Achievements Differ by Gender
Gender N Mean Standard
Deviation t p
Female 500 28,9290 18,59354
-2,178 0,03
Male 511 31,6184 20,63566
When Table 2 is analyzed, it is seen that there is a significant difference about the 6th grade students in gender. The male students are more successful than the female students in spatial visualization success.
The Difference in Spatial Visualization Achievements by their Mathematical Achievements
Whether the spatial visualization achievements of the sixth grade students forming the sample group of the study differ by mathematical achievements variable was searched with variance analysis and the results are presented in Table 3.
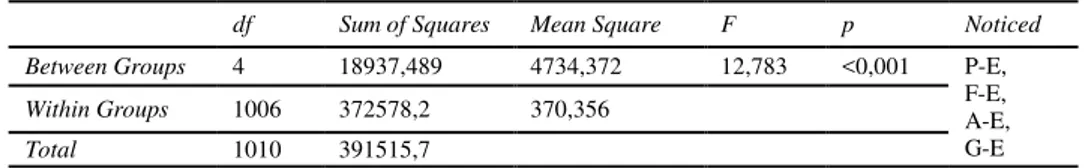
Table 3: The Results of the Variance Analysis Regarding the Difference in Spatial Visualization Achievements by Mathematical Achievements)
df Sum of Squares Mean Square F p Noticed
Between Groups 4 18937,489 4734,372 12,783 <0,001 P-E, F-E, A-E, G-E
Within Groups 1006 372578,2 370,356
When Table 3 is analyzed, it is seen that there are significant differences in terms of spatial visualization achievements between mathematical achievement groups. As a result of the Tukey multiple-comparison test carried out for determining the source of the differences; it was determined that there are significant differences between the students who are at Excellent level and the students at Poor, Fair, Average and Good levels. It is seen that the achievements of the students at Excellent level are higher than the students at Poor, Fair, Average and Good levels. According to this, it can be said that spatial visualization achievements of students whose mathematical achievements are Excellent are higher than others.
The Difference in Spatial Visualization Achievements by the Interest in Geometry Whether the spatial visualization achievements of the sixth grade students forming the sample group of the study differ by the interest in geometry variable was searched with variance analysis and the results are displayed in Table 4.
Table 4: The Results of the Variance Analysis Regarding the Difference in Spatial Visualization Achievement by the Interest in Geometry
When Table 4 is analyzed, it is seen that there are significant differences in spatial visualization success for the students who are interested in geometry. Tukey statistics has been applied to determine the reasons of the differences and it has been determined that, there are differences between mid-level students and high level students. The high level students interested in geometry are more successful in spatial visualization success than mid-level students.
The levels of visual/spatial intelligences of the students forming the sample
The percentage and frequency distribution stating the intelligence levels which are based on visual/spatial intelligence test carried out with sixth grade students forming the sample of the study, is given in Table 5.
Table 5: The levels of visual/spatial of students forming the sample The level of visual/spatial
intelligences
f %
1st Level 13 1,3
2nd Level 296 29,3
3rd Level 702 69,4
When Table 5 is analyzed, it is seen that most of the students’ spatial intelligence level has been determined as 3rd level.
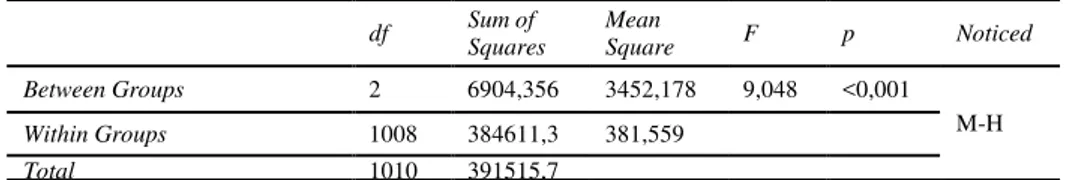
df Sum of Squares
Mean
Square F p Noticed
Between Groups 2 6904,356 3452,178 9,048 <0,001 M-H
Within Groups 1008 384611,3 381,559
The Difference in Spatial Visualization Achievements by Visual/Spatial Intelligence Level
Whether the spatial visualization achievements of the sixth grade students forming the sample group of the study differ by visual/spatial intelligence level variable was searched with variance analysis and the results are shown in Table 6.
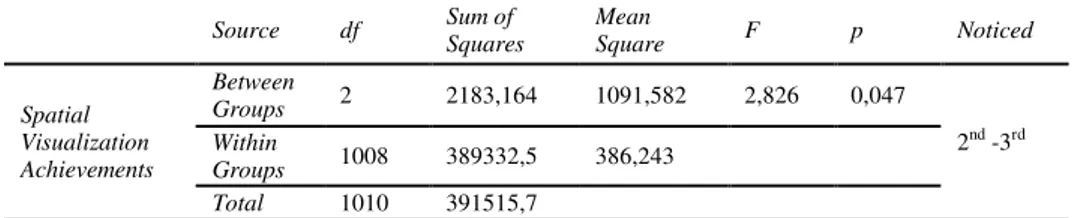
Table 6: The Results of the Variance Analysis Regarding the Difference in Spatial Visualization Achievement by Visual/Spatial Intelligence Levels
Source df Sum of Squares
Mean
Square F p Noticed
Spatial Visualization Achievements
Between
Groups 2 2183,164 1091,582 2,826 0,047
2nd -3rd
Within
Groups 1008 389332,5 386,243 Total 1010 391515,7
When Table 6 is analyzed, it is seen that there are significant differences in spatial intelligence level groups in spatial visualization success. Tukey has been applied to determine which groups cause the differences; it has been determined that there are differences between the 2nd level students and 3rd level students. The 3rd level students are more successful than the 2nd level students in spatial visualization success. So, the students with high spatial intelligence are also successful in spatial visualization.
The Overall Analysis of the Spatial Ability Test
The results of the overall analysis of the spatial ability test carried out with sixth grade students forming the sample of the study are shown in Table 7.
Table 7: The Overall Analysis of the Spatial Ability Test
When Table 7 is analyzed, it is seen that the students have been seen to have low success in spatial ability test. Also, the question intervals have formed by considering the lowest mark, -35.
The Response Ratios of the Spatial Ability Test
The results of the response ratios of the spatial ability test carried out with sixth grade students forming the sample of the study are displayed in Table 8.
Table 8: The response ratios of the spatial ability test
The question intervals of the Spatial Ability Test True (%) False (%) Empty (%)
1-25 59,308 36,772 3,936
26-50 49,416 37,468 13,092
51-75 44,152 34,2 21,644
76-100 37,032 29,104 33,848
Spatial Visualization Achievements
N Minimum Maximum Mean Std deviation
While the response ratios of the spatial ability test are analyzed, it is accepted as useful to determine 4 question intervals. It is seen that the response ratios of the questions are decreasing as proceeding from 1-25 interval to the end. While proceeding from the beginning to the end of the test, it is seen that the ratios of empty questions are increasing but the ratio for the false answers is decreasing. The increase in the empty questions through the end of the test can be interpreted as the students forming sample did not use the allocated time properly. The decrease in the ratios of the false answers is giving us the impression that the ratios of the true answers could increase, if additional time was given to students.
The correlation between the students’ spatial visualization achievements and their
visual/spatial intelligences
The results of the correlation between the spatial visualization achievements of the sixth grade students forming the sample of the study and their visual/spatial intelligences are shown in Table 9.
Table 9: The correlation between the students’ spatial visualization achievements and their visual/spatial intelligences
When Table 9 is analyzed, it is seen that there was positive, significant (.05 level) but low relation between the spatial visualization success and visual/spatial intelligence capabilities of sixth grade students.
DISCUSSION AND CONCLUSION
The purpose of this research is to determine the 6thgrade students’ spatial intelligence level and spatial visualization success and the relation between these two factors. According to the gender factor, there is a significant difference in the 6thgrade students’
spatial visualization success. Accordingly, the male students’ spatial visualization
success is higher than that of female students. It was found out in the study which was carried out by Ben-Haim et. al. (1988) that there were significant differences in spatial visualization skills by gender (more in males) before teaching. After teaching, female and male students achieved equal benefits rather than the gender difference occurred before teaching as a result of the implemented teaching. In opposition to this, Seng and Chan (2000) searched the correlation between spatial skills and mathematical achievements by gender differences in primary schools and as a result of the conducted tests, male students did not significantly perform better than female students so it was seen as a conclusion that the correlation between spatial skills and mathematical achievements did not create any significant difference in terms of genders. In another study, Werthessen (1999) found out that the students in the study group displayed positive improvements in the conducted tests but it was seen that there were not any differences between genders. When the previous studies are viewed, the difference in spatial visualization skills by gender varies according to the sample.
N Pearson correlation p
According to the mathematics success factor, there is a significant difference in the 6th
grade students’ spatial visualization success. Accordingly, the students who have high
mathematical success have more success in spatial visualization success than the others. As a result of the study carried out by Seng and Chan (2000), it was seen that there was a positive and significant correlation between mathematical achievements and spatial skills. Kayhan (2005) in his study in which he analyzed the spatial skills of the high school students found out a significant and positive correlation between mathematical achievements and spatial skills and between logical thinking skills and spatial skills.
According to the geometry interest factor, there is a significant difference in the 6th
grade students’ spatial visualization success. Accordingly, the students with high
geometrical interest have high success level in spatial visualization success.
According to the spatial intelligence level factor, there is a significant difference in the 6th grade students’ spatial visualization success. Accordingly, the students with high spatial intelligence have higher success in spatial visualization success. It was seen in the study carried out by Tai et. al. (2003) that students who have high visual skills have significantly higher logical thinking skills than students who have low visual skills.
When the answering proportion of the spatial ability test has been examined, it has been seen that as we go ahead from the interval 1-25, the true answering proportion decreases and as we go from the beginning to the end the proportion of the unanswered questions increases but the proportion of the wrong answers decrease. It has been seen that there was positive, meaningful but low relation between the spatial visualization success and visual/spatial intelligence capabilities of sixth grade students.
REFERENCES
Altunay, D. (2004). Oyunla desteklenmiş matematik öğretiminin öğrenci erişine ve
kalıcılığa etkisi, Gazi Üniversitesi, Eğitim Bilimleri Enstitüsü, Yayımlanmış Yüksek
Lisans Tezi.
Battista, M. T. (1990). Spatial visualization and gender differences in high school geometry. Journal for Research in Mathematics Education, 21, 47–60.
Battista, M. T., Wheatley G. H. & Talsma G. (1989). Spatial visualization, formal reasoning, and geometric problem solving strategies of pre-service elementary teachers. Focus on Learning Problems in Mathematics, 11(4), 17-30.
Bishop, A. (1989). Review of research on visualization in mathematics education, Focus on Learning Problems in Mathematics, 11(1), 7–16.
Böke, C. H. (2000). Okul matematiğinin prensip ve standartları, anaokulu öncesinden 12. sınıfa kadar okul matematiği için standartlar.
Bulut, S. and Köroğlu, S. (2000). Onbirinci sınıf öğrencilerinin ve matematik öğretmen
adaylarının uzaysal yeteneklerinin incelenmesi. Hacettepe Üniversitesi, Eğitim Fakültesi Dergisi, 18, 56-61.
Burnet, S. A. and Lane, D. M. (1980). Effects of academic instruction on spatial visualization. Intelligence, 4, 233-242.
Castro, C. S. (1998). Teaching probability for conceptual change. Educational Studies in Mathematic, 35, 233-254.
Clements, D. H. (1998). Geometric and spatial thinking in young children, State University of New York at Buffalo. Mathematics for the Young Children, 3-29.
Clements, D. H. and Battista, M. T. (1992). Geometry and spatial reasoning, Handbook of Research on Mathematics Teaching and Learning. VA: National Council of Teachers of Mathematics, Reston, 420-464.
Davis, P. and Anderson, J. (1979). Nonanalytic aspects of mathematics and their implication for research and education, SIAM Review, 21(1), 112–127.
Demirel, Ö. (2004). Öğretimde planlama ve değerlendirme öğretme sanatı. Ankara: Pegem.
Dreyfus, T. (1991). On the status of visual reasoning in mathematics and mathematics education. Proceedings of the 15th Annual Meeting of the International Group for the Psychology of Mathematics Education 1, 33–48.
Elliot, J. and Smith, I.M. (1983). An international dictionary of spatial tests. Windsor, United Kingdom: The NFER-Nelson Publishing Company Ltd.
Friedman, L. (1992). A Meta-Analysis of correlations of spatial and Mathematical tasks. ERIC Document, 353-270.
Gardner, H. (1985). Farnes of mind: The theory of multiple intelligences. In M.M. Hatfield, N.T. Edwards, G.G. Bitter. Mathematics methods for elementary and middle school teachers. Needham Heights, MA: Allyn and Bacon.
Girgin, M. and Ertürk, M. (2006). Yürürlükteki program ve ders kitaplarına göre
ortaöğretimCoğrafya perspektifimiz. Sosyal Bilimler Araştırmaları Dergisi 1, 1-13.
Göktepe, S. and Özdemir, A. Ş. (2013). İlköğretim matematik öğretmen adaylarının
uzamsal görselleştirme becerilerinin SOLO modeli ile incelenmesi. Kalem Eğitim ve İnsan Bilimleri Dergisi, 3(2), 91- 146.
Guzman, De. M. (2002). The role of visualization in the teaching and learning of mathematical analysis, Educational Resources Information Center(ERIC).
Horgan, J. (1993). The death of proof. Scientific American October Issue, 92–103.
Karasar, N. (2005). Bilimsel araştırma yöntemi. Ankara: Nobel.
Kayhan, E. B. (2005). Lise öğrencilerinin uzaysal yeteneklerinin incelenmesi, Ortadoğu
Teknik Üniversitesi, Orta Öğretim Fen ve Matematik Alanları Eğitimi, Yayınlanmış Yüksek Lisans Tezi.
Keskin, Ö. Ö. (2008). Ortaöğretim Matematik öğretmen adaylarının matematiksel
modelleme yapabilme becerilerinin geliştirilmesi üzerine bir araştırma, Gazi
Üniversitesi Eğitim Bilimleri Enstitüsü, Doktora Tezi, Ankara.
Köroğlu, H. and Yeşildere, S. (2004). İlköğretim yedinci sınıf matematik dersi
tamsayılar ünitesinde çoklu zekâ teorisi tabanlı öğretimin öğrenci başarısına etkisi. Gazi
Üniversitesi, Eğitim Fakültesi Dergisi, 24, 24-41.
McGee, M. G. (1979). Human spatial abilities: Psychometric studies and environmental, genetic, hormonal, and neurological influences. Psychological Bulletin, 86(5), 889-918.
Moyer, P. S. (2001). Are we having fun yet? How teachers use manipulatives to teach mathematics. Educational Studies in Mathematic, 47, 175-197.
Olkun, S. & Altun, A. (2003). İlköğretim öğrencilerinin bilgisayar deneyimleri ile uzamsal düşünme ve geometri başarıları arasındaki ilişki, The Turkish Online Journal of Educational Technology – TOJET, 2(4).
Olkun, S., Smith, G. G., Gerretson, H. P., Zembat, İ. Ö., Erdem, A. and Johnson, G. (2007). Sınıf öğretmeni adaylarının iki ve üç boyutlu uzamsal akıl yürütme becerilerinin
uluslararası düzeyde karşılaştırılması. XVI. Ulusal Eğitim Bilimleri Kongresi,
Gaziosmanpaşa Üniversitesi Eğitim Fakültesi, Tokat.
Özdemir, M. E., Duru, A. and Akgün, L. (2005). İki ve üç boyutlu düşünme: İki ve üç
boyutlu geometriksel şekillerle bazı özdeşliklerin görselleştirilmesi, Kastamonu Eğitim Fakültesi Dergisi, 13(2), 527-540.
Pellegrino, J. W., Alderton, D. L. and Shute, V. J. (1984). Understanding spatial ability, Educational Psychologist, 19(3), 239-253.
Saban, A. (2002). Öğrenme ve öğretme süreci yeni teori ve yaklaşımlar. Ankara: Nobel.
Seng, S. & Chan, B. (2000). Spatial ability and mathematical performance: gender differences in an elementary school. National Institute of Education, Nanyang Technological University, Singapore.
Sinoplu, B. & Olkun, S. (2004). Öğrencilerde 3 boyutluluk ve uzamsal yapılandırmanın gelişiminde erken-mühendislik uygulamalarının etkisi, VI. Ulusal Fen Bilimleri ve
Matematik Eğitimi Kongresi, Marmara Üniversitesi Atatürk Eğitim Fakültesi.
Smith, G.G., Olkun, S. & Middleton, J. A. (1999). Interactive versus observational learning of spatial visualization of geometric transformations. Paper presented at the annual meeting of the American Educational Research Association, Montreal, Canada.
Sowell, E. J. (1989). Effects of manipulative materials in mathematics instruction, Journal for Research in Mathematics Education, 20(5), 498-505.
Strong, S. & Smith, R. (2002). Spatial visualization: fundamentals and trends in engineering graphics. Journal of Industrial Technology, 18(1).
Şişman, M. (2007). İlköğretim 8. sınıf Matematik dersi çarpanlara ayırma ve özdeşlikler konusunun yapılandırmacı öğrenme yaklaşımına uygun olarak öğretiminin öğrencibaşarısına etkisi, Gazi Üniversitesi Eğitim Bilimleri Enstitüsü.
Tai, D. W. S., Yu, C. H., Lai, L. C. and Lin, S. J. (2003). World transactions on engineering and technology education, UICEE, 2(2), 251-268.
Tekin, A. T., Şahin, Z. & Delice, A. (2008). Zihinde döndürme ve uzamsal görselleştirme yeteneklerinin geometri sorularını çözme sürecine etkisi, VIII. Ulusal
Fen Bilimleri ve Matematik Eğitimi Kongresi, Abant İzzet Baysal Üniversitesi, Bolu.
Thompson, P. W. (1992). Notations, conventions and constraints: contributions to effective uses of concrete materials in elementary mathematics. Journal for Research in Mathematics Education, 23(2), 123-147.
Turgut, M. & Yenilmez, K. (2012). Matematik öğretmeni adaylarının uzamsal
görselleştirme becerileri. Eğitim ve Öğretim Araştırmaları Dergisi, 1(2), 243-252.
Turgut, M. & Yılmaz, S. (2012). İlköğretim 7. ve 8. sınıf öğrencilerinin uzamsal
Toptaş, V. (2008). Geometri alt öğrenme alanlarının öğretiminde kullanılan öğretim
materyalleri ile öğretme-öğrenme sürecinin bir birinci sınıfta incelenmesi. Ankara
Üniversitesi Eğitim Bilimleri Fakültesi Dergisi, 41(1), 299-323.
Usiskin, Z. (1987). Resolving the continuing dilemmas in school geometry, In R. Hershkowitz, "Visualization in Geometry-Two Sides of the Coin". Focus in Learning Problems in Mathernatics, 11, 61-76.
Werthessen, H. (1999). Instruction in spatial skills and its effect on self-efficacy and achievement in mental rotation and spatial visualization, Ph.D Thesis, Columbia University. http://wwwlib.umi.com/dissertations/fullcit/9634439.
Wheatley, G.H. (1991). Enhancing mathematics learning through imagery. Arithmetic Teacher, 39, 34-36.
Wheatley, G. H. (1996). Wheatley spatial ability test, Tallahassee, FL: Mathematics Learning.
Yolcu, B. (2008). Altıncı sınıf öğrencilerinin uzamsal yeteneklerini somut modeller ve
bilgisayar uygulamaları ile geliştirme çalışmaları. Yüksek Lisans Tezi. Eskişehir
Osmangazi Üniversitesi, Eskişehir.
Turkish Abstract
Altıncı Sınıf Öğrencilerinin Uzamsal Görselleştirme Başarıları ile Görsel/Uzamsal Zekaları Arasındaki İlişkinin İncelenmesi
Bu çalışmanın amacı 6. sınıf öğrencilerinin uzamsal görselleştirme başarılarının bazı değişkenler açısından incelenmesini amaçlamaktadır. Araştırmanın örneklemini Eskişehir’deki ilkokullardan rassal olarak seçilen 1011 6. sınıf öğrencisi oluşturmaktadır. Çalışmada tarama modeli kullanılmıştır. Veriler Görsel/Uzamsal Zeka Ölçeği ve Uzamsal Beceri Testi kullanılarak toplanmıştır. Frekans ve yüzdelikler toplanan verileri belirlemede kullanılmıştır. Veriler ANOVA
ve t-testi kullanılarak analiz edilmiştir. Ayrıca, öğrencilerin uzamsal görselleştirme başarısı ve
görsel/uzamsal zekaları arasındaki ilişkiyi araştırmak için korelasyon analizi kullanılmıştır.
Çalışmanın sonuçlarına göre öğrencilerin uzamsal görselleştirme başarı puanları arasında cinsiyet, matematik başarısı, geometriye ilgi ve görsel/uzamsal zeka seviyelerine göre anlamlı farklılıklar
bulunmuştur. Ayrıca, öğrencilerin uzamsal görselleştirme başarılarıyla görsel/uzamsal zekaları
arasında olumlu, düşük fakat anlamlı bir ilişki saptanmıştır.
Anahtar Kelimeler: Uzamsal beceri, Görsel/uzamsal zeka, Görselleştirme, Uzamsal
French Abstract
Enquête des Étudiants de Sixième année Succès de Visualisation Spatial en Termes de quelques Variables
Le but principal de cette recherche était d'examiner les étudiants de sixième année le succès de visualisation spatial en termes de quelques variables. L'échantillon de la recherche consiste en 1011 étudiants de sixième année qui ont été aléatoirement choisis des écoles primaires dans Eskisehir. La méthode d'enquête a été utilisée dans l'étude. Les données ont été rassemblées par l'Échelle d'Intelligence Visuelle/Spatiale et le Test de Capacité Spatial. La fréquence et des pourcentages ont été utilisés pour déterminer des données rassemblées. Les données ont été
analysées par ANOVA et le t-test. De plus, l'analyse de corrélation a été utilisée pour rechercher
dans la relation entre le succès de visualisation spatial et les capacités d'intelligence visuelles/spatiales d'étudiants de sixième année. Selon les résultats de l'étude, il y avait des différences significatives parmi le genre des étudiants de points de vue de succès de visualisation
spatial des étudiants, l'accomplissement de mathématiques, l'intérêt dans la géométrie et des niveaux d'intelligence visuels/spatiaux. De plus, il y avait la relation positive, significative mais
basse entre le succès de visualisation spatial et les capacités d'intelligence visuelles/spatiales
d'étudiants de sixième année.
Mots-clés:Capacité Spatiale, Intelligence Visuelle/Spatiale, Visualisation, Visualisation Spatiale, les Termes de Quelques Variables
Arabic Abstract
اريغت لا ضعب يح ن نم سد سلا فصلا اطل ين ك لا روصتلا ن يف قيقحتلا : : اونعلا .
. ا يغت لا ضعب يح ن نم س سلا فسلا اطل ين لا وصتلا ن يف قي حتلا وه ثح لا ا ه نم يسيئ لا ف لا ك ثح لا يع ن تت 1111
ل شب مه يتخإ مت ني لا س سلا فصلا يف بل يف يئا تبإا س ا لا نم يئاوشع
. يشي سإ
لا تخإ س ي م ين لا/ ص لا ء ك لا س ي م قي نع ن ي لا ع ج مت . سا لا ه يف حس لا و سا تسأ ت غ )( ا تسإب ن ي لا لي حت مت . ع ج مت يتلا ن ي لا ي حت يف بس لا ا تلا ا تسإ مت. ين لا ف ضإ ب . ا
س ل ب ين لا/ ص لا ء ك لا ا ق ين لا وصتلا ن نيب قاعلا نع ثح ل طبا ت لا لي حتلا ا تسإ مت كل لإ ه فاتخإ ه تن ك, سا لا نم جئ ت لا بسح .س سلا فصلا اطل ج , اطلا ع ين لا وصتلا ن نيب م
, يض ي لا يف نإا,س لا, اطلا ظن ك,كل لإ ف ضإ ب .ين لا/ ص لا ء ك لا يوتسم , س لا م عب تهإا
ين لا/ ص لا ء ك لا ا ق ين لا وصتلا ن نيب ي ق ن ل ,حضا عم ا , يب يإ قاع ه فصلا اطل
.س سلا
لك هم ك لا , ين لا لا : ء
م ,ين لا وصتلا, وصتلا, ص لا/ين لا ن