_
PAN AMERICAN
HEALTH
ORGANIZATION
WORLD
HEALTH
ORGANIZATION
_._
XX
I PANAM
E
RI
C
AN
S
ANITARY
C
O
NFEREN
C
E
XXX
IV
R
E
G
I
ONA
COMM
L
I
TTE
E
ME
E
T
I
N
G
W
AS
HIN
G
TO
N
,
D.
C
.
SEPTEMBER 1982
Provisional Agenda Item 13.B CSP21/21 (Eng.)
6 August 1982
ORIGINAL: ENGLISH
PLAN OF ACTION FOR THE IMPLEMENTATION OF THE REGIONAL STRATEGIES FOR
HEALTH FOR ALL BY THE YEAR 2000. FINANCIAL AND BUDGETARY IMPLICATIONS
This background document was prepared by the Secretariat and
reviewed and presented by the Subcommittee on Long-Term Planning and
Programming to the 88th Meeting of the Executive Committee in June
1982. The document, which includes Executive Committee revisions,
examines the financial and budgetary implications of the Regional
Strategies and the Plan of Action for Attaining the Goal of Health
for All by the Year 2000. The Subcommittee made a number of
observa-tions which are summarized in Annex I. Resolution XX approved by
the Executive Committee is attached at Annex II, for the
r
CSP21/21 (Eng.)
BACKGROUND DOCUMENT ON THE NATIONAL AND INTERNATIONAL
FINANCIAL AND BUDGETARY IMPLICATIONS OF THE REGIONAL
TABLE OF CONTENTS
Page
EXECUTIVE SUMMARY ... i
I. INTRODUCTION ... I
II. TRENDS IN NATIONAL HEALTH EXPENDITURES IN LATIN
AMERICA AND THE CARIBBEAN BY SOURCE OF FINANCE ... 3
III. TRENDS IN THE ALLOCATION OF EXTERNAL RESOURCES FOR HEALTH
AND OTHER SECTORS IN LATIN AMERICA AND THE CARIBBEAN ... 34
IV. COST ESTIMATES OF HEALTH FOR ALL IN THE DEVELOPING
COUNTRIES OF THE AMERICAS ... 45
Vo ESTIMATE OF THE INVESTMENT IN HEALTH FACILITIES
FOR THE PERIOD 1981-2000 NECESSARY FOR ATTAINING
THE GOAL OF HEALTH FOR ALL BY THE YEAR 2000
(HFA/2000) THROUGH THE PRIMARY CARE STRATEGY ... 47
VI. CHANGES IN PAHO'S ORGANIZATION, RESPONSIBILITIES AND
EXECUTIVE SUMMARY
Purpose
This background document responds to the request of the Executive
Committee at its 86th Meeting in June 1981 that, together with the
Director, the Subcommittee on Long-Term Planning and Programming study
the financial and budgetary implications of the Regional Strategies and
Plan of Action.
The document was prepared with assistance, advice and data
provided by the Inter-American Development Bank, the Economic Commission
on Latin America, the United Nations' Statistical Office and the
International Monetary Fund's Statistical Division. It provides a
general perspective on the future costs of achieving the goals of health
for all and analyzes the national and external financial and technical
resources necessary to meet those costs. It also assesses the
implications of the nature and character of existing resource allocations
of the health sector for the achievement of the goals of HFA/2000.
Finally, it examines the implications for PAHO of the recent pattern of
budgetary decisions by its Governing Bodies.
COST ESTIMATES OF HEALTH FOR ALL BY THE YEAR 2000
Cost Factors
I. Goals: The cost estimates relate directly to the regional
goals adopted in the Plan of Action. Those goals are more ambitious than
the WHO goals, given the significant differences between the Region of
the Americas and other developing regions of the world.
2. Health Infrastructure: In the Americas, the infrastructure of
the health sector is more modern, complex, and specialized than in other
regions. Extension of its coverage is therefore likely to be more
expensive than in other regions.
3. Urbanization: Rapid urbanization within the Region will
result in more than three-q_arters of the population residing in urban
areas by the year 2000.
4. Changing Disease Patterns: Countries increasingly are being
required to cope with a far broader spectrum of diseases, ranging from
parasitic and communicable diseases endemic to earlier stages of
development to the chronic and degenerative diseases of later life, which
Cost Estimates
Current costs for health within the Region are estimated at
approximately _32 billion annually from all sources_ and encompass both
capital investment and operating costs of health care, or 5 per cent of
the Region's GDP.
Between 1981-2000, capital investments for health services,
immunization, and malaria control and eradication are estimated at _61
billion and for water and sanitation, 5117 billion, with a combined total
estimated cost of 5178 billion.
By the year 2000, those investments will generate an additional
annual recurrent operating cost of _18.75 billion for health care and
517.6 billion for water and sanitation, of which 511.6 billion will be
covered by user fees.
The combination of additional costs, existing annual costs and the
estimated continuing capital investment requirement of approximately
_3 billion will yield a total cost of HFA/2000 of some 560 billion a year.
MEETING THE COSTS OF HEALTH FOR ALL BY THE YEAR 2000
Economic Perspective
Despite the significant amounts estimated to be necessary to fund
the costs of health for all by the year 2000, macroeconomic projections
offer reasonable expectations that the majority of the countries of the
Region will possess sufficient resources to match those costs.
The annual economic growth rate for the Americas in the 1970's
averaged more than 6 per cent. In fact, since 1960, the gross domestic
product (GDP) in the Americas has been close to 6 per cent.
During the past decade, nations (including private and public
sectors) have devoted an average of more than 5 per cent of their GDP to
health. A series of projections combining estimates of growth and
allocations of GDP to health between 1981 and 2000 present a somewhat
reassuring panorama. Even with an estimate of only a 4 per cent rate of
economic growth between 1981 and 2000, and only 4 per cent of the GDP
assigned to health, the total estimated costs of 560 billion to achieve
health for all by the year 2000 would be available.
A middle range estimate of 5 per cent average GDP growth and 5 per
cent assigned to health would produce some _90 billion available to the
health sector--significantly more than the estimated costs.
However, if the regional economy continues its current sluggishness
--GDP growth was only 1.7 per cent last year--then major reallocations to
health would be needed. Fortunately, even the most pessimistic economists
-anticipate the present downturn to be a short-term exception rather than the rule. International Monetary Fund (IMF) staff projections see a return to positive growth rates likely within 2-3 years.
It should be noted that these estimates do not take account of
cost savings resulting from the restructuring of the health sector, greater efficiency in the management of services, increased attention to
preventive care, and the positive potential impact on health of developments in other sectors during the next two decades.
TRENDS, SOURCES AND IMPLICATIONS OF NATIONAL HEALTH EXPENDITURES
Public Revenues
Governmental spending for health depends on two factors: the total revenues available for government spending and the proportion of government expenditures assigned to health.
Over the past two decades, Latin America and the Caribbean averaged only 13 per cent of GDP devoted to the public sector, a level substantially below the 22 per cent average of a sample number of industrialized countries.
Latin America and the Caribbean show a steady growth in public expenditures over the past two decades: 5.7 per cent annual increase in public spending during the 1960's and 6.2 per cent annual increase in public spending in the 1970's. Both are approximately equal to the rates
of GDP growth during the same periods. It is anticipated that faster growth may be needed to finance the basic human needs programs that most countries are planning to implement.
Explanations for the relatively small share of GDP dedicated to public expenditures in most of the Region include the limited nature of
overall tax revenues, dependence on indirect rather than direct taxes on individual and corporate incomes, dependence on foreign trade taxes for a significant portion of those indirect taxes, and weak systems of tax collection. One example is that only 25 per cent of central government revenues with the Region are generated by income taxes, compared to more than twice that average in a selected group of industrial countries. In Latin America and the Caribbean interest payments in 1979 represented ii.I per cent of total central government expenditures, as compared to 5.5 per cent in 1973. Interest payments are likely to account for an even larger share of central government expenditures in the foreseeable
future.
Central Government Health Expenditures
Latin America and the Caribbean show a relatively high share of central government expenditures devoted to health (6.1% and 10% respec-tively) compared with other developing regions of the world. Also, since
-the countries of Latin America with social security systems finance a
substantial portion through the central government and devote a large
percentage of those resources to health care, the overall allocation of
central government expenditures devoted to health in Latin America is
closer to the Caribbean level.
The percentage of central government expenditures assigned to
health by industrialized countries, excluding social security, is 11%.
However, in recent years, only I0 of 26 countries showed any real per
capita increase in the portion of central government spending for
health. The majority either remained unchanged or dropped--some by
significant amounts.
Standing in some contrast to the primary health care strategy and
the goal of health for all, the percentage of central government health
expenditures destined for hospitals and clinics has increased in recent
years in the Region.
Social Security and Health
Social security expenditures for medical care for most Latin
American and some Caribbean countries are not considered part of
government-financed health services despite generally high levels of
governmental financing in many countries. Social security accounts for
an ever-increasing portion of GDP, and a significant portion of the
social security benefits involves health care. Also, the general
orientation of most social security health care systems is curative
rather than preventive.
These factors combine to make evident the need for far closer
collaboration between ministries of health and social security
institutions in order to engender greater equality in access to health
care, decrease duplication of efforts, and promote more effective
utilization of available resources.
To accomplish closer coordination between those institutions will
require clearly defined policy decisions by the national government,
particularly in those countries where the independence of the social
security institution is provided by law.
Social Security, Financing, Coverase and Equality
The study notes the limited portion of population covered by
social security systems and the partial subsidization by the national
population of the employer share of the cost through higher prices paid
for many goods and services. The result is that some groups of the
population, particularly in rural areas and among the urban poor, do not
receive benefits but help to finance the costs of those services. To
promote greater equality, social security systems would have to expand
their coverage rapidly or restructure their financing schemes.
-Private Health Expenditures
Most of the Region appears to show a tendency for private health
expenditures to decline as a percentage both of total private consumption
expenditures and of GDPo The study notes that people are spending less
for health while at the same time they are spending more for alcohol and
tobacco. In some countries expenditures for alcohol alone are greater
than expenditures for health°
Study Implications
The study points out the fragmentation of authority and
responsibility, both legal and de facto, within the health sector, both
among competing levels and agencies of government and in the private
sector. Serving different groups and with different philosophies, the
study finds duplication of effort and less than optimum use of
resources. At the same time, the study finds evidence of countries
attempting to promote coherence through granting of new authority to the
Ministry of Health or to national coordinating councils, or through a
combination of the two. Similarly, coordination between sectors can be a
potential mechanism for achieving more coherence in overall socioeconomic
development, avoid unnecessary additional costs--for instance, by
avoiding environmental pollution--and offer possible new resources to the
health sector itself.
Study Recommendations
- Greater equity in income distribution.
- Generation of additional public revenues.
- Greater intrasectoral coordination and collaboration.
- Expansion in the coverage of the organized sector.
- Improved control and management.
- Increased efficiency in the utilization of existing resources.
- Improvements in the organization and delivery of care.
- Improvements in cost accounting.
--EXTERNAL RESOURCES FOR HEALTH
Past Pattern and Future Perspective of Official External Resource Flows
to Developing Countries
Between 1970 and 1978, development assistance (in constant
dollars) increased from 548 billion to 588 billion. In 1979 and 1980,
external resources declined to 580 billion, of which some 530 billion was
on concessional terms.
Future trends, given the general economic climate, are likely to
see the pattern of slight declines in overall resources flows continue,
with the greatest reduction in the levels of concessional lending.
Pattern and Perspective of External Financial Aid to Latin America and
the Caribbean
Latin America and the Caribbean receive some 92% of development
assistance on non-concessionary terms. Terms are likely to harden even
further.
The Region has maintained its relative share of concessionary
lending. However, the apparently substantial increases in the flow over
recent years has been virtually, if not entirely, negated by the impact
of inflation. In addition, there are serious grounds for concern that
the future may bring marked shifts in concessionary resources. Many
multilateral lending institutions and bilateral donor agencies have
adopted policies calling for concessionary lending to go more and more to
the poorest nations. Most of the Region would not meet the national per
capita income standard. The standard itself deserves sharp scrutiny
since it fails to account for the nearly 150 million individuals living
in absolute poverty within the Region and because it does not accurately
reflect "poverty" by failing to account for the far higher cost of
meeting basic needs within the Region.
External Aid to Health Sector within the Region
Currently only about i per cent of the Region's total expenditure
on health care and rural water and sanitation systems is externally
financed. External resources, nevertheless, continue to be available.
The potential for increasing the flow to health is unclear.
- The World Bank funded five health care components of other
sector projects for 542 million in 1981.
- The IDB approved a 520 million loan for health alone, and one
component loan. Its total in the area of health care, water and
sanltatlon, reached 5208 million.
- OECD bilateral commitments to health have averaged some 7 per
cent of overall development assistance.
-Reasons for the Limited Flow of External Resources for Health
- Emphasis of donor agencies, particularly lending institutions, on projects with higher economic rates of return.
- Overall heavy indebtedness of Member Governments, growing from 525 billion in 1971 to 5165 billion in 1980 (some 38% of the
total external debt of the developing world), which results in a general reluctance to add to external debts.
- Hardening terms of assistance.
- Relatively high ratio of recurrent costs associated with many investments in health services.
- Inability of countries to expand health services without creating increasing inflationary pressures within the health sector.
- Long-term benefit return in health investments is unattractive to governments, which must show an almost immediate return on investments.
- Limited capacity of Ministries of Health to identify needs for and potential sources of external resources, inexperience in drafting project proposals which meet requirements of external donors, and comparative disadvantage in competition with other sectors for central government approval to seek external financing of projects.
Alternative Options to Generate More External Resources for Health
- Countries including requests for health component loans in a larger number of agricultural, industrial and other proposals.
- Countries to request funds to help cover recurrent costs.
- Restructuring health care delivery systems to make them more cost-effective.
- Expansion of social security system coverage.
- Reorganization of the health sector.
- Increased integration of unorganized private sector.
- Countries to pursue clearer political commitment to health
objectives, strengthen financial planning capabilities of the health sector, use available technical cooperation for
identify-ing external sources of resources and develop increased project preparation expertise.
-ROLE OF PAHO
PAHO undertook reorganization efforts to enhance its capacity to
meet rising demands for cooperation. Over the past six years, its Members
have risen from 30 to 35, costs have increased because of inflation
throughout the Region, and budgets in real terms have declined. Relative
to other UN agencies, PAHO budget increases have been the smallest and,
therefore, the least responsive to those inflation-boosted costs of
providing services. Population growth rates in Latin America and the
Caribbean also have reduced the per capita benefit of the PAHO budget
from 8 cents in 1976 to 6 cents in 1981.
PAHO reorganization and internal management improvement have
sought to reduce costs without reducing services. Creation of the Office
of External Cooperation has also been a direct response to the need to
maximize the flow of external resources to Member Governments and help
them identify, mobilize and more effectively utilize national resources.
PAHO is also intent on insuring that the outcome of the monitoring
and evaluation system will provide information that will enable PAHO to
respond more quickly and directly to Member Governments as they adjust
their systems in accordance with the Plan of Action. This process,
linked to AMPES, will be aimed at assuring that the Organization is
responding to priorities identified by the countries, thereby using
available resources in the most effective manner. Nevertheless, if the
budgetary trend of recent years continues, the failure to match the
rising levels of inflation will inevitably affect the capacity of the
Organization to meet the changing demands of the Member Governments for
technical cooperation.
-d
I. INTRODUCTION
Over the past few years, concerns have been raised regarding
trends in the financial resources devoted to health in the developing
countries of the Americas, and their implications for the attainment of
HFA/2000. Concerns range from the severe financial constraints which
confront the Pan American Health Organization in the light of its role in
the attainment of HFA/2000, to the downward trends in the amounts of real
resources being allocated to the health sector.
These concerns were voiced at the 86th Meeting of the Executive
Committee and, as a result the Executive Committee requested:
a) That the Subcommittee on Long-Term Planning and Programming
study the financial and budgetary implications of the regional
strategies and Plan of Action together with the Director;
b) That the Director enlist the cooperation and participation of
specialized personnel from other international agencies;
c) That a report on the above be submitted to the 88th Meeting of
th_ Executive Committee.
In response to this specific request the Secretariat has prepared
this background document which presents in summary fashion the general
economic conditions faced by the countries in the coming years and their
implications for HFA/2000. Section VI outlines some of the steps
under-taken by PAHO in response to the challenge.
Achievement of HFA/2000 will most likely require a substantial
in-crease in resources for the health sector. However, as was pointed out
in the Regional Strategies of HFA/2000 adopted in 1981, the national
accounts and other financial data for a number of countries show that
during the 1970's there were declines in the real per capita resources
being allocated to finance publicly organized health services. These
declines are also apparent in PAHO's real financial resources, as
re-flected in both its regular and extrabudgetary receipts. ,If this decline
continues, PAHO will face very significant difficulties before HFA/2000
is attained.
Other international organizations have been experiencing,
some-times relatively low, but nevertheless real rates of growth in their
re-gular and other budgetary resources over the past few years. However,
PAHO has seen its resources, in real terms, decreasing at an alarming
rate and, if this trend continues, it inevitably will affect PAHO's role
in cooperating in the attainment of HFA/2000.
At the international level, we do not foresee any improvements in
the near future in the flow of resources, in real terms, being channeled
to the developing countries of the Americas. In fact, recent policy
changes by donors and the overall constriction in the international
eco-nomic arena clearly imply reductions in the flow of real concessionary
- 2
-This shrinking of international resources for health seems
some-what paradoxical if one considers that very often the major beneficiaries
are the industrialized countries themselves. Taking smallpox, for
exam-ple, which this Region was the first to eradicate, calculations indicate
that in 1981 one country alone saved an estimated _500 million in avoided
direct health costs, and almost a similar amount in related costs, such
as lost working time, border health inspections and other associated
costs. Similar savings also accrue to the countries resulting from the
control of other diseases in humans and in animals. The savings which
result from increasing control and even eradication of foot-and-mouth
disease is another example. The US Department of Agriculture estimated
in 1980 that if "foot-and-mouth disease were to enter the United States
of America today it would mean reduced livestock productivity; over one
thousand million US dollars in eradication costs and losses; and reduced,
or lost, foreign markets for US livestock products." Improvements in
animal health are shared by the populations in the meat-producing
devel-oping countries as well as by importing countries, through lower prices.
In fact, better health and increased productivity lead to lower prices
for many of the goods imported by industrialized nations and favorable
changes in their terms of trade. Many other examples could be given of
how the well-being of both developing and developed countries are linked
through improvements in health and the lessening of social inequities.
In many respects, however, most of the developing countries of
this Region are less reliant on foreign financial cooperation for health
purposes than are developing countries of other Regions. In 1980, for
example, external cooperation, excluding aid for large scale urban water
and sanitation projects, provided only about 1% of the total financial
resources devoted to health in the developing countries of the Americas.
Overall development assistance in Latin America and the Caribbean
in-creasingly has shifted to harder terms. While the Region's current share
of global concessionary resources has remained relatively steady, as a
percentage of total development assistance, the concessionary portion has
diminished.
In the framework of the guidelines established by the 86th Meeting
of the Executive Committee, this document has been prepared with the
assistance, advice and data provided by IDB and ECLA. This is a first
step in the close cooperation that PAHO is seeking with the economic
sec-tor. The Organization anticipates that it will be possible to work even
more closely with those institutions in the future. We have, in this
document, refrained from making any recommendations or drawing any
con-clusions except those which are virtually self-evident. We believe these
should more appropriately emanate from the deliberations of the Governing
Bodies.
Fragmentary data available from a number of disparate sources
con-cerning national health expenditures in this Region have not been used,
as such data can be very misleading. Instead, only comparable trend data
from official international sources which cover a spread of several years
--ranging from a minimum of three years to a maximum of twenty--have been
3
-II. TRENDS IN NATIONAL HEALTH EXPENDITURES IN LATIN AMERICA AND THE
CARIBBEAN BY SOURCE OF FINANCE
One of the problems faced by many Latin American and Caribbean
countries in their efforts to expand the coverage and scope of their
health and other programs in the area of basic human needs is the
rela-tively restricted nature of overall government revenues and thus their
capacity to finance such programs.
Over the past two decades public consumption expenditures have,
for the Region as a whole, been increasing at almost the same rate as the
gross domestic product (GDP). The average annual rate of growth in
pub-lic consumption expenditure in the 1960's was 5.7% and between 1970 and
1979 the average annual growth was 6.2%. It is anticipated that the rate
of growth in public consumption over the next two decades will have to be
considerably higher to adequately finance the basic human needs programs
that most countries are planning to implement.
As Table I indicates, although over the past two decades the
pro-portion of GDP which is consumed by the public, as opposed to the
pri-vate, sector has tended to increase in most Latin American countries, it
is still relatively small as compared to other more industrialized
coun-tries. In 1979, on the average only 13 per cent of each country's gross
domestic product (GDP) was allocated to meeting public consumption needs.
This 13 per cent of GDP, besides having to cover the salaries of all
pub-lic employees, also had to defray the costs of a host of other activities
ranging from health, education and welfare programs to defense, justice
and foreign affairs. By way of contrast, the United States of America,
Canada, Sweden and the United Kingdom were, on the average, able to
de-vote 22 per cent of their much larger GDP's to public consumption.
Pri-vate consumption expenditures in these latter four countries accounted
for an average of only 58 per cent of their GDP in 1977, as compared to
an average of 66 per cent in Latin America. Given the relatively small
proportion of GDP allocated to meeting all public consumption needs in
Latin America, it is not difficult to understand the severe financial
constraints under which most publicly financed social development
pro-grams operate, including those for health purposes.
One of the reasons for the relatively small share of public as
op-posed to private consumption expenditures in most Latin American
coun-tries is the limited nature of overall government tax revenues. In
con-trast to the majority of highly industrialized countries, most Latin
American countries generate the bulk of their revenues from indirect
taxes rather than direct taxes on individual and corporate incomes, and
the buoyancy of their tax systems is sometimes low. One of the reasons
for the relatively low buoyancy of tax revenues in many countries
through-out the Region is the substantial dependence on foreign trade taxes,
which tend to make these countries' revenues very vulnerable to changes
-4-TABLE I
PUBLIC AND PRIVATE CONSUMPTION, AND INCOME TAX
IN LATIN AMERICA
Public Consump- Private Consump- Income Tax as a
tion as a Per- tion as a Per- Percentage of
Country centage of GDP centage of GDP Total Central
Government Tax
1960 1979 1960 1979 Revenue, 1977
Haiti ... 8 ... 81 16
Honduras ii 12 77 64 ...
E1 Salvador I0 12 79 68 13
Bolivia 7 12 86 76 39
Colombia 6 7 73 67 37
Paraguay 8 6 76 74 14 _i/
Ecuador I0 12 74 61 25 i/
Guatemala 8 7 84 79 13 I/
Nicaragua 9 17 79 71 13
DominicanRepublic 13 6 68 80 21 _/
Peru 9 i0 64 66 ...
Mexico 6 12 76 62 ...
Jamaica 7 20 67 63 40
Chile Ii 14 75 71 35 _/
Panama Ii 18 78 63 34 i/
Costa Rica I0 18 77 69 26 !/
Brazil 12 I0 67 69 ...
Uruguay 9 13 79 76 ...
Argentina 9 24 70 41 ...
Trinidadand Tobago 9 16 61 43 57
Venezuela 14 14 53 52 13 _/
Average(unweighted) 9 13 73 66 25
Canada 14 19 65 56 54
United States of America 17 18 64 64 59
Sweden 16 30 60 53 44 _/
United Kingdom 17 20 66 60 60 _/
Average(unweighted) 16 22 64 58 54
Sources: IBRD, World Development Indicators, 1980
United Nations Statistical Yearbook, 1978-1979
i/ Taxes on income and wealth
_/ 1976
_/ Taxes on income and wealth do not include direct taxation of oil and mining
companies, which would increase this figure to 64%
-
5-In the long run, as their economies expand and as many Latin American countries restructure their sources of revenues and as their tax
collection systems become more effective, the resources needed to support a wide range of programs aimed at meeting basic needs should be generated. In the short run, however, administrators will be constantly aware of the need to develop alternative sources of financial support for health programs.
Central Government Health Expenditures
As will be seen from Table 2, in many Latin American and Caribbean countries there are marked fluctuations in central government health ex-penditures, and one can well imagine the frustrations of many of the agencies involved in trying to implement long-term health plans. With
the exception of a few countries, which maintained a fairly steady upward growth throughout the entire decade, in real per capita terms the central governments' health expenditures appear to have peaked out in a number of countries before the end of the decade. Thus, excluding Trinidad and Tobago, in only nine out of the other 25 countries shown did per capita health expenditures, when expressed in constant prices, attain their highest level in the last year shown. Moreover, as pointed out in the footnote, the deflator used for developing the data at constant prices was the overall national inflation rate (CPI), whereas it is well known that throughout virtually the entire Region health costs were rising far more rapidly than the overall national rate of inflation. It is believed that later this year, when data for 1980 become available, very few cen-tral governments will have increased their real per capita health expen-ditures. Moreover, it is believed that in 1981 and 1982 the deepening of the economic recession throughout most of Latin America and the Caribbean
co
• ° • ° • ,°
_-i ¢0
t_ C-I 0
_I_ o o tl_ • o
t'q
O0 l_ _ "-I" 0 _. ¢_• _"
• O0
l l l
•
,
o
,g
_
I I I I I I
ch r'_
u
I..i
0
,--4 ,"=4
,..-4
,--.i C_/ i'_ ,'=I
_P_ _ <_l _ C@ _ 0"I <"I
• CO '-_ _ i'_ Lrl CO
• m
U ¢_ ° °
c',i I I | I I r,_
,.-4
,-4 ,=4
i I I i I i • • I I I
i I I I i I r"-. _ 0 i I i.
r-.,. ,,.-4
,,.-4
0
_M 0 o
_4
!
e
..q
• o
• • o •
,--i
O_. '.0 CO '.O u'_ O0 r-,. 0 oo
,....4
v
• •
I I I I I t I I I I. I I I 1 I I L | I I I L I I [-,.,,
,.,..4
_3
o
_
- 1
0
-• • •
• • •
<:m ,-.-4 ,-i _I" _, _o _ <3_ _
M_ I_. I'_ ._"
QCI co _ I • °
• • i
_-I m CO
•_ C3 _l CO _ _1 0
• • I
• • ° I •
o
_
_
_
,
_
_
'
M
_
_
_
=
=
r._
i_i L ...
I I I I I I
(3O ,--I _iO
I I • I ¢ I I I
,.-I
,M
---I
_ m
_
g
i, I,
11
-P'l cPl
I I I I I _o ,-i
_I_ " I I I I I I •
Crl
C'_ ,--i
• "I" I I I
• •
•-i C_l ,-I
r_
,-I
o _
I
I
I
_
_
_
I
I
I
I
I
I
-M _J
0 U
0 4-1
- 1
2
-0 4J
cJ _U t_
.
_
_
_
°
_oo
_0_J ,,4 _O_._ °_ or.i • _ J,J
•-_ -.11" -.1"
'-_ e,_ c,_ c;,--I
o
c_0
p,H _._ 4.)
_ t_ ,-t ,--I I-.4
-
_
_
_
.
_
-
_
O_, N m
U
N_
_ _ •
ill
•,-I _:_
4.1 O _
- 13
-In 18 out of the 23 countries shown in Table 3, health as a
per-centage of total central government expenditures accounted for a smaller
share in the last year shown than in the first year shown. The
un-weighted average for the first year shown for all 23 countries was 8.4
per cent. The corresponding average for the last year shown was 6.8 per
cent, or an average decrease of 19 per cent over the six years. In the
Bahamas the percentages for the first and last years shown were the same,
but there was a substantial decline between 1978 and 1979.
TABLE 3
CENTRAL GOVERNMENT EXPENDITURE ON HEALTH AS A PERCENTAGE
OF TOTAL CENTRAL GOVERNMENT EXPENDITURES
Country 1973 1974 1975 1976 1977 1978 1979
Argentina 3.8 2.5 2.6 4.I 2.7 2.2 I.7
Bahamas 13.9 14.1 13.5 14.6 15.3 15.6 13.9
Barbados 15o5 12.8 11.8 11.2 10.6 11.5 10.3
Bolivia 7.8 8.9 8.4 8.0 8.0 8.3 8.6
Brazil 6.8 6.9 6.5 7.5 8.1 7.8 8.5
Chile 8.0 7.3 6.9 6.5 6.4 6.4 ...
Costa Rica 3.1 4.0 4.3 4.6 3.2 3.7 2.4
Dominica ... I0.6 12.7 9.6 8.8
Dominican Republic ii.7 I0.9 6.8 8.7 ...
E1 Salvador 10.4 10.3 8.2 9.2 9.8 8.9 8.7
Grenada ... 14.1 14.6 12.7 15.6 ...
Guatemala 9.2 8.4 8.6 8.3 7.6 7.1 7.6
Guyana 6.1 5.7 4.8 4.2 5.8 5.7 ...
Honduras ... 11.7 15.7 12.8 14.7 8.5 8.0
Jamaica ... 9.3 8.2 7.8 ...
Mexico 4.9 3.9 4.2 4.2_ 4.4 4.0 3.9
Netherlands Antilles 8.4 9.2 8.5 8.2 9.7 8.0 7.9
Nicaragua 5.7 6.2 8.4 4.I ...
Panama 15.1 13.8 14.5 13.2 14.5 15.1 12.3
Peru 3.3 3.0 2.8 2.8 2.7 2.6 3.7
Suriname 5.5 5.7 5.i 5.8 5.9 5.6 4.5
Uruguay 4.8 5.7 3.9 3.9 3.8 5.0 4.7
Venezuela I0.8 7.5 7.6 7.2 7.3 8.0 9.I
- 14
-During the 1970's it would appear from data published by the
In-ternational Monetary Fund (IMF) that there has been an increasing
ten-dency by many of the central governments throughout Latin America, but
not necessarily the Caribbean, to allocate a growing proportion of their
health expenditures to hospitals and clinics. The data below tend to
highlight this trend.
TABLE 4
PERCENTAGE FOR HOSPITALS AND CLINICS OF CENTRAL GOVERNMENTS'
TOTAL HEALTH EXPENDITURES
Country 1972 1979
Argentina 33.3 78.6
Barbados 75.6 72.1
Bolivia (1973)23.1 40.1
Brazil 82.0 85.0
Chile 87.5 92.5
Guatemala 71.0 79.3
Dominica (1976)72.1 65.0
Honduras 87.0 49.9
Mexico 59.8 90.7
Panama (1973)92.2 (1978) 93.8
USA 85.1 92.9
Canada (1971)55.1 59.0
Guyana (1973)93.5 (1978)95.4
Netherlands Antilles (1973) 63.1 45.3
Suriname 72.2 (1976)63.3
Tanzania 86.0 72.7
India 83.0 75.6
Source: IMF Government Finance Statistics Yearbook Vol. V,
1981
This trend towards increasing proportions of total central
govern-ment health expenditure to hospitals and clinics has serious implications
for the strategies of primary health care and HFA/2000. Representatives
of Member Governments may wish to check the validity of the data
pertain-ing to their country with the authorities responsible for submitting them
- 15
-TABLE 5
SOCIAL SECURITY AND WELFARE, AND HEALTH AS PERCENTAGE
OF TOTAL CENTRAL GOVERNMENT EXPENDITURES
1973 1979
Social Security and Welfare
World 31.7 34.3
Industrialized Countries 34.9 37.9
USA 31.6 33.6
Oil Exporters 3.5 5.2
Africa 5.4 5.3
Asia 4.5 4.0
MiddleEast 9.1 11.4
LatinAmerica 27.4 28.3
Caribbean(unweighted) 6.0 7.0
Health
World 9.1 I0.0
Industrialized Countries 9.9 II.i
Canada 7.6 7.6
USA 8.3 10.5
Oil Exporters 5.2 4.8
Africa 6.1 5.4
Asia 2.7 2.8
MiddleEast 3.0 3.5
LatinAmericaI 6.0 6.1
Caribbean (unweighted) II.0 i0.0
IFor most countries the total does not include health care
expenditures or social security.
Social Security Systems and the Financing of Medical Care
The social security financial operations presented in ILO's document
entitled "The Cost of Social Security" are necessarily included in the various
flows recorded in the United Nations System of National Accounts (SNA),
although they may not all be classified under the heading "social security" as
defined for the purpose of the SNA. For example, in the new SNA, "social
security arrangements" are defined as follows:
The social security arrangements to be included are those which
are imposed, controlled or financed by the government. Schemes
imposed by the government will involve compulsory contributions
- 16
-particular sections of the community. These arrangements may, in
addition, allow certain sections of the community to join the
scheme voluntarily. Schemes formulated by the government solely
in its role as an employer of personnel, for example schemes
which differ significantly from social security arrangements for
the community or which are the subject of negotiation with
government employees, are not to be included here. Such schemes
are considered to be pension arrangements. Even if a scheme does
not involve compulsory contributions imposed by the government,
it should nevertheless be included as a part of general
government services if, by way of public regulation and
supervision, or by virtue of the existence of a system of
government grants, the scheme clearly forms part of the social
policy of the government in respect of the community as a whole.
This definition covers to some extent the schemes classified under
"social insurance and assimilated schemes" and "family benefits" in the ILO
inquiry. Schemes for public employees (military and civilian) are, as far as
pensions are concerned, included under "pension funds and other financial
institutions" in the SNA; this category" also includes private pension funds
which fall outside the scope of the ILO inquiry. Sick leave and other
short-term benefits to public employees appear under "wages and salaries" in the SNA.
This means that social security expenditures for medical care for most
Latin American and some Caribbean countries are not considered as being part
of government-financed health services, although the government may account
for the largest share of their financing.
As Table 6 indicates, with the exception of a few of this Region's
smaller countries, in the majority of the countries throughout the Western
Hemisphere having social security schemes, they are accounting for an
ever-increasing proportion of their GDP.
In many of the countries shown in Table 7, e.g., Costa Rica, E1
Salvador, Nicaragua, United States of America, Uruguay and Venezuela, social
security expenditures on medical care are larger than those of the central
government health expenditures. In terms of the attainment of HFA/2000, it is
becoming increasingly evident that there is an urgent need for far closer
collaboration between ministries of health and social security. In most
coun-tries this would not only engender greater equality in the access to health
care, but would also lead to decreased duplication of efforts and a more
effective utilization of available resources.
Moreover, in many countries it appears that a major source of
addi-tional funds for supporting health services could stem from expanded social
security contributions. There are, however, a number of potential limitations,
such as legal caveats, which could restrict funds from such sources being
effectively utilized in national programs designed to provide health for all.
For example, in many Latin American countries, besides the fact that the
ministries of health and their counterparts have little control over the use
_ T_LE6 17
-RECEIPTS AND EXPENDITURES OF SOCIAL SECURITY SCHEMES (as percentage of gross domestic product in purchasers' value I)
Financial Financial
Country Year Receipts Expenditure Benefits Country Year Receipts Expenditure Benefits
Argentina 19752 8.0 7°3 7.0 Guatemala 1959-605 2.0 1.9 1.8 19652 2.0 2.0 1.8
Barbados 19714 6.4 3.6 3.5 19702 2.2 2.1 1.9
1975 6.7 4.9 4.8 19752 2.0 2.0 1.8
1976 7.4 5.7 5.6 19762 1.9 1.8 1°6
1977 7.9 6.2 6.1 19772 2.1 1.6 1.5
Bolivia 19612 4.3 3.6 3.0 Guyana 1965 4.3 4.3 4.2
1972 3.3 3.1 2.8 1972 5.2 3.3 2.8
1975 3.4 3.1 2.8 1975 3.6 1.9 1.6
1976 3.5 3.1 2.8 1976 4.0 2.1 1.7
Brazil 19652 405 4.3 3.4 Haiti 1974-75 1.0 0.9 0.8
19702 5.7 5.7 4.7 1975-76 0.9 0.7 0.7
19752 6°i 5.7 4.9 1976-77 0.9 0.8 0.7
19762 6.1 6.2 5.2
19772 6.2 6.2 5.3 Jamaica 1964-652 2.9 2.7 2.5 1969-70 4.0 2.8 2.1
Canada 1959-60 9.8 9.2 9.0 1974-75 4.1 3.1 2.5
1964-65 10.7 9.4 9.1 1975-76 5.2 4.1 3.6 1969-70 14.4 11.8 11.5 1976-77 5.9 4.4 3.9
1974-75 16.7 14.7 14.0
1975-76 17.3 15.2 14.7 Nicaragua 1960-61 2.3 1.9 1.8 1976-77 16.4 14.5 14.2 1965 2.6 2.1 1.9
1970 3.4 2.8 2.5
Colombia 19612 1.5 1.5 1.4 1975 3.4 2.8 2.5
19652 I.i I.i 1.0 1976 3.2 2.7 2.4
1970 3.1 2.6 2.4 1977 2.8 2.3 2.1
1975 3.6 3.0 2.8
1976 4.1 3.4 3.0 Panama 19602 7.7 6.3 6.0
1977 4.5 3.7 3.3 19652 7.3 6.0 5.6
19722 8.5 7.4 6.2
Costa Rica 19612 2.9 1.9 1.6 19752 9.2 7.2 6.1 19652 3.8 2.3 1.9 19762 I0.0 7.7 7.0
19702 4.8 3.4 2.9 19772 9.9 7.9 7.0
1975 6.8 5.1 4.6
1976 7.6 5.9 5.3 Trinidad 19652 3.0 2.8 2.8
1977 76.4 5.8 5.3 and 19702 3.1 3.1 3.1
Tobago 19752 3.2 2.3 2.2 Chile 19652 13.9 12.1 9.8 19762 3.4 2.4 2.3
19712 19.4 17.2 15.6 19772 3.4 2.5 2.4 1975_ 11.7 9.3 8.5
1976 _ 12.0 9.4 8.8 United i959-606 7.5 6.8 6.3
19772 13.2 I0.I 9.4 States 1964-65 8.1 7.1 6.5
1969-70 11.3 9.6 8.9 Dominican 1970 2.9 2.7 1.8 1974-75 14.4 13.2 12.4 Republic 1975 2.5 2.4 2.3 1975-76 14.4 13.9 13.1 1976 2.7 2.6 2.5 1976-77 14.8 13.7 12.9 1977 2.6 2.5 2.4
Uruguay 1975 II.I 10.4 8.2 E1 Salvador 19602 2.2 2.1 2.0 1976 12.0 I0.I 9.0
19652 2.4 2.2 2.1 1977 11.3 10.3 9.1
19702 3.7 2.9 2.3
19752 3.9 3.3 2.4 Venezuela 1959-692_5 2.6 2.5 2.1
19762 3.7 3.2 2.1 19652 3.0 3.1 3.0
19772 3.4 2.9 2.0 1970 3.4 3.1 2.3
1975 4.2 3.7 3.5
1976 4.5 4.0 3.8
1977 4.5 4.1 3.8
Source: ILO, "The Cost of Social Security," Geneva, 1981.
i Gross domestic product computed in accordance with th- new System of National Accounts adopted by the United Nations in 1968 (unless otherwise indicated).
2 As percentages of the gross domestic product computed in accordance with the old System of National Accounts.
3 Excludes public employees, for whom data are not available.
4 As percentages of gross domestic product at factor cost.
5 Financial year i July 1959 to 30 June 1960.
- 18-
_
"
_.Jm 0
r,,_ ,u _,_
_"_
"_ "
2
.
;
j_
...
Q_ Q)
M
_ m
M _
u_
OI
_J r_
J:
ooI4_ _J_I_ =
_
d2
...
_ ...
m r-_
• • , . • • • • • • • • • • • • •
0"---"
_
.
_._ _ _
_
.
o
,,_
_.,-_ 0 "_ v ¢..3
-
20
-
.
_
,
O
"_ 0
m QJ4._ .*QJ
•,-I _'_I * *a0u_O¢_l 1"-,'4 _,d',--I r-- r'-,d--d-¢:o CD .,D,-IO CD¢'4 (-'_r-- _1_1
_®
=
®
: :,
_-_o
,
...
•_ _) U :4 CO00
_
°_
-
-
_
"_'_Z (0 °
Cl.
_o_
1,1 °_4
_.) b$ .,-I
•,-I_ _l _ C_".O,"1 ,--I_,'_00 r-, ,.-_u-_ _ ,-¢ C,,I ,,_,--_r,-._ u_ c,I L,_,.D cO L'_ _"_U_ ,,1" O0 m_
AJ_I_
°
.lo
U * o_o
• • • • • • * * •__
...
C',I_
•
_,
_
_
_
r_ I---I
b= 0 _0_
(._ _._ E_ _ _,'_a'_ ".1"-.1" ,'.'_,--_c'_,-._,-_ ,._ m • ::)
i
_0
o
_.
,
U_
U aJ_
<
,_.._
,_.
I_l_ _ ,-.4 =l "_
•
_
"__
.
_
0_'_ aJl _ _ 0
_
_
'
_ _ _'_._
_._
_
,, o
_
:_
• • o • • , _!
_=_
..o_o_
_.
...
_.
._u,
.
-
-0 u _ Ol 4j_.4 _ _
- 21
-more sophisticated curative services and very few of their resources are
devoted to preventive and basic health care programs. In many countries it
would appear that only by the national government establishing a clearly
defined policy of earmarking a part of total social security health revenue to
help subsidize a number of other national health objectives would some of the
financial problems involved in rapidly expanding coverage to provide health
for all be partially alleviated. In this respect, as can be seen from Table
7, in many countries semi-autonomous social security health programs are
themselves directly and sometimes highly subsidized by governments' public
revenues. Moreover, insofar as they use public facilities and health personnel
who have been educated and trained at public expense, they are also indirectly
subsidized.
There is also the question of who actually pays for social security
health programs. It is believed that in many systems the incidence of the
share of payroll taxes initially paid by employers is to a substantial degree
shifted to consumers through higher prices for many goods and services. As a
result, some groups of the population, mainly those living in rural areas and
the poorest urban groups, help finance social security systems without
re-ceiving any benefits. Generally speaking, as the table shows, the insured
employees pay only a relatively small proportion of the total costs of such
systems.
In general, it is the regressive nature of the real sources of the
funds used to finance social security programs and the resulting perpetuation
of inequities in income distribution, coupled with their restricted coverage,
which is giving rise to growing concern in many of the Region's countries. In
the context of strategies to meet basic human needs it would appear that in
few of the Region's countries are the autonomous or semi-autonomous social
security systems a particularly constructive influence. However, by a
redef-inition of their policies and roles such systems could become a very
con-structive factor.
Another underutilized alternative open to many Latin American countries
is the imposition of a broader range of user charges on the recipients of
publicly financed health care. Very often, even when charges are made for
goods and services, they seldom accrue to the account of the government agency
actually financing the goods and services. It is thought, therefore, that
many governments may wish to undertake a review of the benefits which could be
derived from the imposition of user charges for many of the health goods and
services now provided free of direct charges. It is not believed that charges
should be made for all health goods and services, or that the charges should
defray the majority of the costs involved. In the past, when some countries
have attempted to introduce charge (or fee) schedules in public health
facili-ties, it has often been found that, largely because of the ineffective methods
used, the cost of the administrative and accounting mechanisms required to
garner and regulate such charges (or fees) has cancelled out the additional
income they were intended to generate. On the other hand, the imposition of a
schedule of nominal charges (or fees) for a selected range of health goods and
services should not only be regarded as a supplementary source of finance but
also as an effective way to minimize the waste and excess utilization which
usually accompany the provision of totally free health goods and services.
- 22
-special care must be taken to ensure that the charges do not work against the
system's prime objective of providing services to disenfranchised groups and
to reduce social inequalities.
As Table 8 indicates, in most (13 out of 18) of the Latin American and
Caribbean countries with social security systems, per capita expenditures over
the past 10-15 years have risen considerably faster than the cost of living.
Even in those countries where this has not been the case, the decline has been
relatively modest, averaging (unweighted) 13% lower than the rise in the cost
of living. The data also tend to highlight how those population groups
covered by social security are far more sheltered from the vagaries of
economic cycles.
TABLE 8
INDICES OF ANNUAL AVERAGE BENEFIT EXPENDITURE PER HEAD OF THE TOTAL POPULATION
(Values adjusted according to the cost-of-living indices: 1970=100)
Year
Country 1960 1965 1970 1975 1976 1977
Argentina ... I00 85 85
Barbados ... i00 169 189 213
Bolivia 70 ... i00 113 122 106
Brazil ... 59 I00 233 275 291
Canada 52 65 I00 157 165 169
Colombia ... 38 i00 134 158 173
Costa Rica 41 51 I00 189 253 303
Chile ... 37 I00 72 81 97
Dominican Republic ... i00 162 172 168
E1 Salvador 73 89 I00 105 109 iii
Guatemala 79 86 I00 104 98 94
Guyana ... 124 i00 78 72 68
Haiti ... I00 I01 115
Jamaica ... 96 I00 133 190 189
Nicaragua ... i00 106 95
Panama 34 65 i00 i01 113 109
Trinidad and Tobago ... 84 I00 123 135 154
United States 53 65 I00 152 164 169
Uruguay ... i00 112 109
Venezuela 72 121 i00 238 247 260
Source: ILO "The Cost of Social Security," Geneva, 1981
Public (General Government) Health Expenditures
Compared with many other areas of the world it would appear (see Table
9) that the share of total public consumption expenditure devoted to health is
- 23
-TABLE 9
TRENDS IN PUBLIC (GENERAL GOVERNMENT) CONSUMPTION EXPENDITURE ON HEALTH
AS A PERCENTAGE OF i) TOTAL PUBLIC (GENERAL GOVERNMENT) EXPENDITURE,
AND 2) GROSS DOMESTIC PRODUCT
Country 1960 1965 1970 1975 1976 1977 1978 1979
i ... 19.2 21.2 19.3 19.2 ...
British Virgin
Islands 2 ... 2.6 2.6 2.8 2.8 ...
i 14.9 13.7 16.9 16.6 ...
H on dur as
2 1.6 1.4 1.9 2.1 ...
I ... 15.5 13.0 12.7 ...
Jamaica
2 ... 2.9 2.9 2.8 ...
1 21.1 25.4 24.0 25.7 27.3 26.1 28.6 27.8
Panama
2 2.4 2.8 3.5 3.9 4.3 4.1 4.3 4.3
i ... 13.0 II.4 II.0 9.9 12.7 12.6
Peru
2 ... 1.5 1.5 1.4 1.5 1.5 1.3
i ... 19.I 13°5 12.9 12.6 13.I 12.2
Venezuela
2 ... 2.5 1.8 1.9 1.9 1.9 1.6
i 4.2 4.3 4.9 6.3 6.3 6.3 6.3 ...
United States
of America 2 .73 .72 .94 1.2 1.2 1.2 I.I ...
1 .•. 5.6 5.5 6.9 7.1 7.1 7.3 5.4
Tanzania
2 ... 1.0 1.3 2.2 1.8 1.8 2.0 2.0
i ... 5.2 6.1 6.4 6.8 7.0 ...
India
2 ... 41 .53 .56 .57 .61 ...
- 24
-when compared with such countries as Tanzania and India. The relatively low,
but gradually increasing, figures for the United States of America reflect the
reliance on private health insurance, both profit and non-profit systems.
However, the proportion of total public expenditure devoted to health in
Jamaica and Venezuela has tended to decline over the past decade. In the case
of Jamaica, this is largely a reflection of the overall economic turmoil which
the country experienced in the latter half of the 1970's, and in the case of
Venezuela, it is largely a reflection of the reordering of government
priori-ties and the growing emphasis on social security institutions. As shown,
there are very large variations in the proportion of GDP devoted to public
expenditure on health.
TABLE I0
COMPENSATION OF EMPLOYEES AS A PERCENTAGE OF TOTAL PUBLIC
(GENERAL GOVERNMENT) HEALTH RECURRENT EXPENDITURES
Country 1970 1975 1979
Peru 64.4 73.9 68.4
Venezuela 86.9 79.0 80.7
British Virgin Islands 73.3 74.6 75.3
India 69.9 63.1 64.5
Italy (71) 72.5 64.2 (71) 65.0
UK 49.8 56.1 54.5
Finland ... 76.4 76.6
Norway 72.7 77.8 77.9
Sweden 75.4 77.4 (78) 77.2
Spain 69.4 79.4 (77)88.5
As the data shown above in Table I0 appear to indicate, with the
exception of Venezuela (high) and the UK (low), it would not appear that there
is a significant difference between the proportions of total public health
recurrent expenditures devoted to the compensation of employees in the
Americas and the rest of the world. Health services are very labor intensive
and there is a growing tendency for them to become even more intensive; for
example, according to a recent OECD report, in many countries staff per
hos-pital bed tended to double between 1960 and 1979.
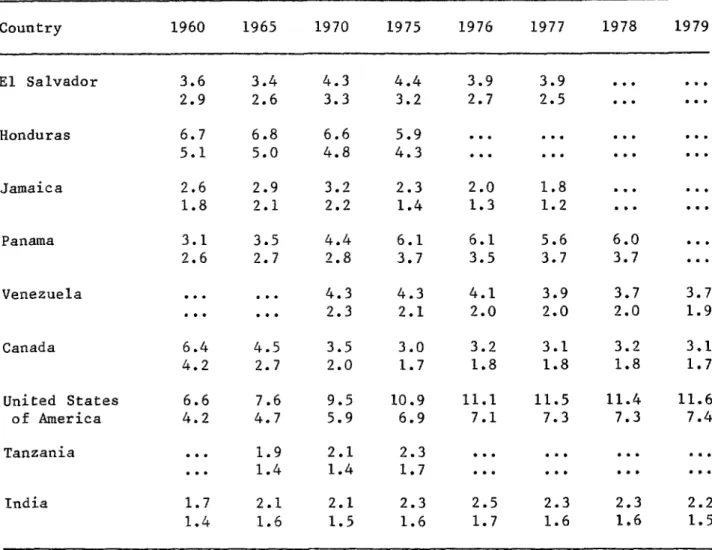
Private Health Expenditure
Of the Region's developing countries shown in Table Ii, only Panama
appears to have experienced a relatively constant and positive growth in its
private health sector expenditures. The data for Canada reflect the growth of
government-sponsored health insurance systems; those for the United States of
America reflect the growth of private health insurance coverage and the
- 25
-TABLE ii
TRENDS IN PRIVATE CONSUMPTION EXPENDITURES ON HEALTH AS A PERCENTAGE OF
I) TOTAL PRIVATE CONSUMPTION EXPENDITURES,
AND 2) GROSS DOMESTIC PRODUCT
Country 1960 1965 1970 1975 1976 1977 1978 1979
E1 Salvador 3.6 3.4 4.3 4.4 3.9 3.9 ...
2.9 2.6 3.3 3.2 2.7 2.5 ...
Honduras 6.7 6.8 6.6 5.9 ...
5.1 5.0 4.8 4.3 ...
Jamaica 2.6 2.9 3.2 2.3 2.0 1.8 ...
1.8 2.1 2.2 1.4 1.3 1.2 ...
Panama 3.1 3.5 4.4 6.1 6.1 5.6 6.0 ...
2.6 2.7 2.8 3.7 3.5 3.7 3.7 ...
Venezuela ... 4.3 4.3 4.1 3.9 3.7 3.7
... 2.3 2.1 2.0 2.0 2.0 1.9
Canada 6.4 4.5 3.5 3.0 3.2 3.1 3.2 3.1
4.2 2.7 2.0 1.7 1.8 1.8 1.8 1.7
United States 6.6 7.6 9.5 10.9 Ii.I 11.5 11.4 11.6
of America 4.2 4.7 5.9 6.9 7.1 7.3 7.3 7.4
Tanzania ... I°9 2.i 2.3 ...
... 1.4 1.4 1.7 ...
India 1.7 2.1 2.1 2.3 2.5 2.3 2.3 2.2
1.4 1.6 1.5 1.6 1.7 1.6 1.6 1.5
26
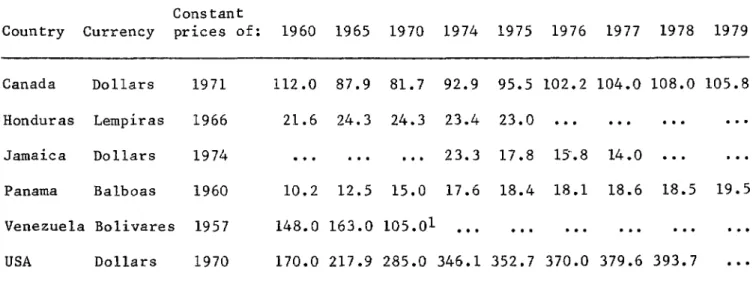
-Unfortunately, data showing trends in per capita private consump-tion expenditures at constant prices on health are not available for most Latin American and Caribbean countries. Those data which are available (see
Table 12) tend to indicate a more rapid rate of growth in the 1960's than in the 1970's. The declining data for Canada largely reflect the introduction of government-sponsored health insurance systems. Once again Panama exhibits a relatively steady positive rate of growth, whereas the data for Jamaica highlight its declining economic situation in the latter part of the 1970'So
TABLE 12
TRENDS IN PER CAPITA PRIVATE FINAL CONSUMPTION EXPENDITURE ON HEALTH AT CONSTANT PRICES IN UNITS OF NATIONAL CURRENCY
Cons tant
Country Currency prices of: 1960 1965 1970 1974 1975 1976 1977 1978 1979
Canada Dollars 1971 112.0 87.9 81.7 92.9 95.5 102.2 104.0 108.0 105.8
Honduras Lempiras 1966 21.6 24.3 24.3 23.4 23.0 ...
Jamaica Dollars 1974 ... 23.3 17.8 i_.8 14.0 ...
Panama Balboas 1960 10.2 12.5 15.0 17.6 18.4 18.1 18.6 18.5 19.5
Venezuela Bolivares 1957 148.0 163.0 105.01 ...
USA Dollars 1970 170.0 217.9 285.0 346.1 352.7 370.0 379.6 393.7 ...
Source: UN National Accounts Data Tapes i/ 1969
Table 13 shows the relatively high proportion of private health
- 27
-TABLE 13
TRENDS IN PRIVATE CONSUMPTION EXPENDITURE ON HEALTH AS A PERCENTAGE
OF TOTAL PUBLIC AND PRIVATE CONSUMPTION EXPENDITURES ON HEALTH
Country 1960 1965 1970 1971 1972 1973 1974 1975 1976 1977 1978
Honduras 76.1 78.5 71.4 74.5 71.6 73.5 68.7 67.4 ...
Jamaica ... 43.4 33.0 32.2 30.0 ...
Panama 52.2 49.0 45.2 48.2 49.6 48.9 48.3 48.8 45.3 47.5 46.0
Venezuela ... 47.7 47.9 48.1 55.5 53.4 52.2 51.3 51.8 53.0
USA 85.3 86.8 86.4 85.8 85.6 85.4 85.2 85.3 85.9 86.4 86.5
Tanzania ... 56.9 53.0 51.0 53.2 48.9 44.7 43.0 ...
India ... 78.7 77.7 77.1 74.9 74.3 70.3 67.7 65.6 63.2
Spain ... 81.6 82.7 81.7 80.4 79.4 75.2 73.3 ...
United
Kingdom 16.4 15.0 15.8 13.6 13.0 12.7 10.7 9.2 8.9 9.0 8.7
Source: UN National Accounts Tapes
A recent study of the costs and utilization of health care services in
the Organization for Economic Cooperation and Development (OECD) countries I
indicates that 5% of the population accounts for some 50% of health care costs
and that 10% of the population accounts for about 75% of total health care
costs; the remaining 90% of the population accounts for only 25% of total
health care expenditures. This is not a reflection of inequality in access to
health care, but rather of the extremely high costs of certain types of health
care. For example, open heart surgery accounts for 7 to 12 years of the
contributions to some form of publically or privately sponsored health
insurance scheme.
I The OECD has 24 members; these include 19 West European countries plus
-
28-As can be seen from Table 14 there are wide variations throughout in
the proportion of GDP devoted to public and private consumption expenditure on health. Generally speaking, most Latin American and Caribbean countries are
much closer to many European countries, e.g. the United Kingdom and Spain, than they are to other developing regions of the world. From the data shown in Table 14 and that available from a number of individual country "case
studies" which have been undertaken by a variety of agencies in many Latin American and Caribbean countries, it is evident that, on the average, this Region devotes some 5% of its combined GDP to the health sector. As is also
apparent from the data that, with the notable exception of Panama, the proportion of GDP being devoted to health tended to peak out around the middle of the 1970's. With the exception of the United States of America, a similar tendency is apparent from the data for a number of the world's industrialized countries, including Canada.
TABLE 14
TRENDS IN PUBLIC (GENERAL GOVERNMENT) AND PRIVATE CONSUMPTION EXPENDITURE ON HEALTH AS A PERCENTAGE OF GROSS DOMESTIC PRODUCT I
Country 1960 1965 1970 1971 1972 1973 1974 1975 1976 1977 1978
Honduras 6.9 6.4 6.8 6.3 6.5 6.1 6.3 6.4 ...
Jamaica ... 4.7 4.3 4.2 4.i ..•
Panama 5.0 5.5 6.3 6.6 7.5 7.3 7.0 7.6 7.8 7.7 8.0
Venezuela ... 4.9 4.6 4.7 3.8 3.1 3.9 4.0 3.9 4.0
USA 4.9 5.5 6.9 7.2 7.3 7.4 7.7 8.1 8.2 8.4 8.5
Tanzania ... 2.4 2.7 3.2 3.0 3.I 3.3 3.9 ...
India ... 1.9 2.2 2.1 1.9 2.0 2.1 2.3 2.2 2.2
Spain ... 3.9 4.4 4.6 4.8 5.0 5.5 ...
United Kingdom 3.8 3.8 4.2 4.3 4.4 4.3 4.9 5.2 5.1 5.0 5.1
Source: UN National Accounts Tapes