OPTIMAL REPRESENTATION OF OUR KNOWLEGDE ABOUT
SEISMIC SOURCES FOR PSHA IN LOW DEFORMATION
AREAS
BORIS LE GOFF, MOURAD BEZZEGHOUD, JOSE FERNANDO BORGES
Department of Physics and CGE, University of Evora, Colégio Luís António Verney, 7000-671 Évora - Portugal
Évora, Portugal, [email protected]
The probabilistic seismic Hazard assessment is composed by 3 main steps: the definition and characterization of the seismic sources, the definition of the attenuation law and the computation of the probabilistic seismic hazard. Our work is focus on the first two steps. Given that most active faults are not characterized well enough, in low deformation areas, seismic sources are generally defined as areal zones, delimited with finite boundary polygons, within which the geological features of active tectonics and the seismicity are deemed homogeneous. Besides the lack of data (e.g., narrow range of recorded magnitudes), the application of this representation generates different problems: 1) a large sensitivity of resulting hazard maps on the location of zone boundaries, while these boundaries are set by expert decision; 2) the zoning can not represent any variation in faulting mechanism; 3) the seismicity rates are distributed throughout the zones and we lose the location of the determinant information used for their calculation. We propose an exploratory study for an alternative procedure in area source modeling. This method allows to obtain a limit, and its uncertainties, between two zones, separated by two different seismic activity rates. Since we obtain this limit, we can recover the seismic activity rates for both zones.The important features for this developed method is the location and magnitude of the largest earthquakes. Given than the largest events are not recorded by instruments,we decide to use the Bakun and Wentworth method (1997) to better characterize the epicentral region and the magnitude of the instrumental earthquakes. Because of the unusual shape of the isoseismal lines of the 1909 Benavente event, we decided to apply this methodology to this event. The result show that the estimated epicenter (Kárnik, 1969) is within all the confidence-level. Because of the low magnitude estimation, we decide to test the sensibility of this method to the attenuation law. A new law is developed using a compilation of macroseismic reports and will be used to re-estimate the epicentral region and the magnitude of the 1909 Benavente event.The logarithmic trends of intensities with the median distance suggests a logarithmic form for the attenuation law. Then, this law will be used to re-evaluate the estimations of both epicentral region and magnitude of the 1909 Benavente event.
1 Seismotectonic zoning
The first part of our work consisted in defining seismic source model to use in Probabilistic Seismic Hazard Analysis (PSHA). Given that most of the faults, in low seismic regions, are not characterized well enough, the source models are defined as areal zones, delimited with finite boundary polygons, within which the seismicity and the geological features are deemed homogeneous, leading to different problems.
We investigated an alternative approach, using Bayesian methods, to model the seismotectonic zoning, with two main objectives: 1) obtain a reproducible method that 2) preserves the information on the sources and extent of the uncertainties.
We developed a first model with two zones, characterized by two different surface activity rates. A seismic catalog is generated in order to control the input parameters (surface activity rates, geographical limit between the two zones) of the model and to have an idea on the expected results. This catalogs was drawn using an uniform spatial
2
model, a Poisson distribution as temporal occurrence model and the Gutenberg-Richter magnitude frequency relationship. Then, a series of synthetic catalogs was generated in order to test the resolving power of the method, in a controlled case, where the input parameters, the temporal occurrence and spatial occurrence models are known.
From this catalog, a Bayesian inference is performed. The Bayesian inference is a probabilistic method which consists in calculating the plausibility of a hypothesis. Its computation is derived from the Bayes’ theorem. In the Bayesian sense, a probability may be interpreted as a numerical translation of a degree of belief. In this case study, the inference allows, from the synthetical catalog, to recover the pdf for parameters of interest (geographical limit between the two zones and their surface activity rates). A first step is the definition of priors, expressing the degree of belief about a random variable before taking into account the data. Then the method consists in evaluating the posterior probability of the model. According to Bayes’ theorem, the posterior probability is proportional to the joint probability and one can determine the optimal value of the parameters and also the covariance matrix. The joint probability expresses the relationship between all the elements of the model.
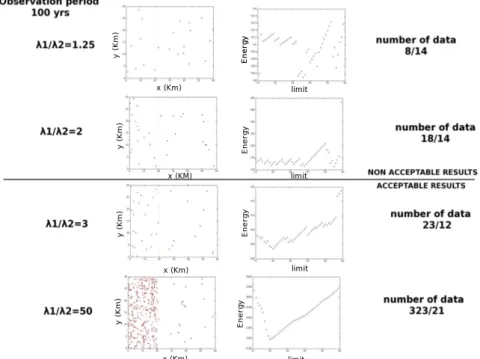
Considering a observation period of 100 years, the limit between the two zones may be find since the ratio between the two surface activity rates is higher than 3 (figure 1). For a observational period of 1000 years this ratio fall down to 1.5, because of the higher number of data (figure 2).
Since we obtain the limit between the two zones, with a certain level of confidence, we can obtain the surface activity rate for each zone.
2 1909 Benavente event and attenuation law 2.1. Seismic context
Portugal can be considered to have a moderate seismicity characterized by small events (M < 5.0) and occasional moderate/large/major (5.0 < M < 7.8) earthquakes [1] Elsewhere, according to the seismic history, the Tavira earthquake of 27 December 1722 (M7.5) located offshore the coast of Algarve generated a tsunami along the coast of Algarve from Faro to Tavira [2]. The northern and central part of Portugal are characterized by a low seismicity (M < 5.0) except for the Lower Tagus Valley region (LTV), which exhibits the relatively high seismic activity [1]. At least three important historical earthquakes have occurred in this zone in 1344 (Ms6.0), 1531 (Ms7.1) [3,4] and 23 April 1909 (Mw6.0, Ms5.9) [5]. ). The southern part of Portugal is the region with
Figure 1. Results of the Bayesian inference to recover the limit between the two zones, for an observational period of 100 years and with different ratio between the surface seismicity rates
Figure 2. Results of the Bayesian inference to recover the limit between the two zones, for an observational period of 1000 years and with different ratio between the surface seismicity rates
4
the most significant seismicity and can be divided into two areas: (1) the Atlantic adjacent zone and (2) the continental zone. The first one is characterized by more intense seismic activity associated with the convergence between Eurasian and African plates [6]. The southwest of cape of São Vicent area, where the earthquakes of 28 February 1969 (Ms8.0, [7]) and 1 November 1755 (Io = X-XI, M~8.5-8.7
,
[8]) occurred, is probably the most seismically active zone (Figure 4). This probable seismogenic zone extends between the Gorringe Bank and the Portugal coast (Figure 4, [6]). According to the Portugal southern main-land neotectonic map (Cabral and Ribeiro, 1988) it is possible to identify several main active structures as the Messejana fault, with an extension of 500 km crossing all of the southern region with NE-SW orientation and which is probably associated with the Azores-Gibraltar fault, close to the city of Évora, the Moura-Vidigueira fault has a WNW-ESE strike, and the Loulé fault, located in Algarve with an approximately W-E orientation, probably responsible for large historical earthquakes. These tectonic faults are partially correlated with the seismic activity in Évora region and Algarve [9].2.2. Epicentral region and magnitude estimation of the 1909 Benavente event
According to the particular shape of the delimited isoseismal lines of the 1909 Benavente earthquake and thanks to the recent macroseismic field revision [10], this event has been revisited with the Bakun and Wentworth method [11]. This method allows to bound the epicentral region and to give an estimation of the magnitude, for different levels of confidence, from intensity observation points. This method may also help to evaluate the fault responsible of the event.
Concerning the results, the estimated epicenter [12] is within all the confidence-level contours. The assumed epicenter of minimum rms[MI] is close to the Kárnik epicenter estimation. The estimated magnitude is 5.8, that is lower than the magnitude estimated by different authors ([5], 10]). This may be explain by the use of an inadequate GMPE (Campbell, 2003 for ENA stable continental regions) or by the concentration of intensity data points in the eastern continental part.
2.3. Attenuation law
In order to estimate the sensibility of the attenuation law into the Bakun and Wentworth method, a new intensity-distance relationship is established. To develop this law, we collected macroseismic data, which provide the list of the reported intensities and the instrumental magnitude for each event. Then, this new attenuation law will be used in the Bakun and Wentworth calculation to compute a new estimation of the epicentral region and the magnitude estimations for the 1909 Benavente event.
Figure 3. Epicentral region and magnitude estimations of the 1909 Benavente event. Red dot represents: epicenter estimated by Kárník (1969). Red triangle: location of the minimum value of rms[MI] over a grid of
assumed epicenters. Dashed lines: contours of M. Xs contours: rms[MI] contours corresponding to the 50%,
80% and 95% confidence levels for location (respectively innermost, middle, and outermost contours)
2.3.1. Data
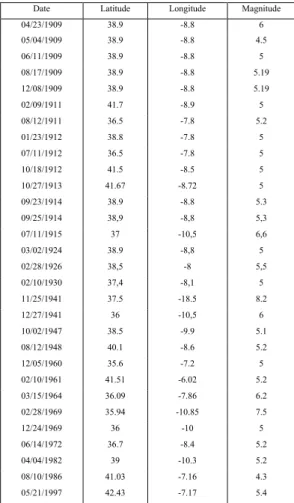
The data required for the computation of the attenuation law, have to provide an instrumental magnitude and a felt intensity report. We obtained, from the Instituto Portuguêse do Mar e da Atmosfera (IPMA, Portugal; ex-IM), 28 events, covering the period since 1909 until 1997. These events are listed in the table 1 and mapped in the figure 4. The largest magnitude is 8.2 for the 25 November 1941 earthquake, closed to the boundary separating the Eurasian plate and the African one.
6
Table 1. Seismic events used to estimate the attenuation law
Date Latitude Longitude Magnitude
04/23/1909 38.9 -8.8 6 05/04/1909 38.9 -8.8 4.5 06/11/1909 38.9 -8.8 5 08/17/1909 38.9 -8.8 5.19 12/08/1909 38.9 -8.8 5.19 02/09/1911 41.7 -8.9 5 08/12/1911 36.5 -7.8 5.2 01/23/1912 38.8 -7.8 5 07/11/1912 36.5 -7.8 5 10/18/1912 41.5 -8.5 5 10/27/1913 41.67 -8.72 5 09/23/1914 38.9 -8.8 5.3 09/25/1914 38,9 -8,8 5,3 07/11/1915 37 -10,5 6,6 03/02/1924 38.9 -8,8 5 02/28/1926 38,5 -8 5,5 02/10/1930 37,4 -8,1 5 11/25/1941 37.5 -18.5 8.2 12/27/1941 36 -10,5 6 10/02/1947 38.5 -9.9 5.1 08/12/1948 40.1 -8.6 5.2 12/05/1960 35.6 -7.2 5 02/10/1961 41.51 -6.02 5.2 03/15/1964 36.09 -7.86 6.2 02/28/1969 35.94 -10.85 7.5 12/24/1969 36 -10 5 06/14/1972 36.7 -8.4 5.2 04/04/1982 39 -10.3 5.2 08/10/1986 41.03 -7.16 4.3 05/21/1997 42.43 -7.17 5.4 2.3.2. Attenuation law
For each event, the intensity data points are plotted versus the distance and different trend lines are achieved (linear, exponential and logarithmic). The better fits are obtained with the logarithmic trend lines and are represented in the figure 5. We evaluate a form of the attenuation equation as follow:
𝐼 = 𝑐
!𝑀 + 𝑐
!𝑀 . 𝑙𝑛 (𝑅) Eq.(1)
where I, M and R are, respectively, the intensity, the magnitude and the epicentral distance.
Figure 4. Map of the seismic events used to estimate the attenuation law. The 1941 earthquake of magnitude 8,2 is out of this map.
To solve this equation, we investigate two methods.
The first one consists in plotting the slope of the different logarithmic trends versus the magnitude, to estimate the parameter c1(M) to evaluate how the intensity behaves in
function of the magnitude and find a relation between them. Another plot, representing the intercepts versus the magnitude, allows to determine the second parameter, c0(M).
The second method consists in using the inverse theory. From the data, we recover the parameters of the model, using a linear inverse matrix. Both parameters, c0(M) and
8
Figure 5. Logarithmic trends of the intensity versus distance, for the different events
3 Conclusion
A new approach of seismotectonic zoning has been developed. This method allows to obtain a limit, and its uncertainties, between two zones, separated by two different seismic activity rates. Since we obtain this limit, we can recover the seismic activity rates for both zones. This method used, so far, the time of occurrence of the events and their spatial repartition. This method needs to be extend to n zone of undefined shape, and incorporating all available geologic and geophysical data (e.g., earthquake magnitude, fault orientation).
To improve the location of historical earthquakes, the Bakun and Wentworth method (1997) may be used. Because of the particular shape of its isoseismal lines, the 1909 Benavente event has been taken as case test. The results are satisfying in terms of epicentral region but the obtained magnitude is lower than the instrumental one. A new attenuation law, computed from the collected macroseismic reports, has been developed to better constrain the results of the Bakun and Wentworth method. The logarithmic trend of the intensities with the median distance suggests a logarithmic form for the attenuation law. To obtain the equation of the attenuation, two methods are investigated: an analytic method, evaluating the behavior of different slopes and intercepts in function of the magnitude, and inverse method. A sensibility test will be achieved, using the macroseismic data, to estimate the resolution power of both methods.
Then, this new attenuation law will be used with the Bakun and Wentworth method (1997) in order to reestimate the epicentral region and the magnitude estimation of the 1909 Benavente event. This attenuation law may also be adapted to be used in Probabilistic Seismic Hazard Analysis.
4 Acknowledgments
This research and BLG are funded by the Fundação para a Ciência e a Tecnologia (PTDC/CTEGIX/101852/2008 and FCOMP-01-0124-FEDER-009326
http://gi.cge.uevora.pt/index.php/Página_principal/projects/SourceMod References
[1] Borges, J.F., Bezzeghoud, M., Fitas, A.J. and Costa, P.T., Seismotectonics of Portugal and its Adjacent Atlantic Area, Tectonophysics 337 (2001), 373-387
[2] J. Mezcua, 1982. Catalogo general de isossistas da la Penímnsula Ibérica, Publ. IGN, Madrid
[3] I. Martins and L.A. Mendes Victor, 1990. Contribuição para o estudo da sismicidade da região oeste da peninsula Ibérica, Publ. IGIL, Lisbon
[4] Sousa 1999
[5] P. Teves-Costa, J.F. Borges, I. Rio, R. Ribeiro, C. Marreiros, 1999. Source parameters of old earthquakes: semi-automatic digitization of analog records and seismic moment assessment. Natural Hazard, 19, 205-220
[6] M. Bezzeghoud M., J.F. Borges and B. Caldeira, 2011. Ground Motion Simulations of the SW Iberia Margin: Rupture Directivity and Earth Structure Effects. Natural Hazard, 2011
[7] E. Buforn, A. Udías, MA Colombás, 1988. Seismicity, source mechanisms ans seismotectonics of the Azores-Gibraltar plate boundary, Tectonophysics 152:89-118 [8] Grandin 1988
[9] V.S. Moreira, 1985. Seismotectonics of Portugal and its adjacent area in the Atlantic, Tectonophysics, 117, 85-96
[10] P. Teves-Costa and J. Batlló, 2010, Journal of Seismology, doi:10.1007/s10950-010-9207-6
[11] W. H. Bakun and C. M. Wentworth, 1997, BSSA, vol. 87, No. 6, pp. 1502-1521 [12] V. Kárník, 1969. Seismicity of the European area, part 1. Reidel, Dordrecht
[13] Borges J.F., B. Caldeira, J. Carvalho, M. Bezzeghoud, 2011. Three-dimensional seismic ground motion modelling in Lower Tagus Valley from Finite difference simulations. Geophysical Research Abstracts Vol. 13, EGU2011-9781, EGU General Assembly 2011.
[14] D.D. Fitzenz et al., 2010, GRL, doi:10.1029/2010GL044071
[15] Grandin, R., Borges, J.F., Bezzeghoud, M., Caldeira, B. and Carrilho, F., 2007. Simulations of strong ground motion in SW Iberia for the 1969 February 28 (MS = 8.0) and the 1755 November 1 (M ~ 8.5) earthquakes – I. Velocity model, Geophys. J. Int., Vol. 171, Issue 3, Pages 1144–1161, December 2007 doi:10.1111/j.1365-246X.2007.03570.x.
[16] B. Le Goff et al., 2009, BRGM report, RP-57659-FR
[17] M.V. Matthews et al., 2002, BSSA, doi: 10.1785/ 0120010267 [18] M. T. Page et al., 2011, in press, JGR
[19] T. Parsons et al., 2009, BSSA, doi: 10.1785/0120080069
[20] S.P. Vilanova et al., 2003, Journal of Seismology, 8: 331–345, 2004 [21] G. Weatherhill et al., 2009, GJI, 176 565-588.v
10
[22] R.J.G Torres, J.A. Furtado, H.G. Silva, J.F. Borges, B. Caldeira, M. Bezzeghoud, C. Cancela Pinto, and J. Carvalho, 2012. Validation of the Lower Tagus Valley velocity and structural model using ambient noise broadband measurements. Geophysical Research Abstracts, Vol. 14, EGU2012-13431, EGU General Assembly 2012