DO EUROPEAN CROSS-BORDER ACQUISITIONS
CREATE OR DESTROY VALUE?
by
Ana Sofia Mendes Santos Moreira Monteiro
Master Dissertation in Finance
Master Dissertation Supervisor:
Miguel Augusto Gomes Sousa, PhD
BIBLIOGRAPHIC NOTE
Ana Sofia Monteiro was born in the 12th July of 1984 in Porto, Portugal.
Currently she is investment analyst at Beta Capital, a venture capital firm focused on investments in innovative start-ups. She joined Beta Capital in 2006 as a trainee and she has being working in venture capital industry ever since. She performs investment analysis and follow-up of portfolio firms as well as drafting of investment and divestment proposals in addition to the provision of information to the unit holders of the Venture Capital Fund. Her academic background includes an Economics BSc degree at Faculdade de Economia da Universidade do Porto, concluded in 2006.
ACKNOWLEDGEMENTS
I would like to appreciate all the time and effort dedicated to this work by my Master dissertation supervisor, Professor Miguel Sousa, PhD.
I would also like to thank my brother for its extremely helpful insights and comments.
Finally, I would like to deeply thank my family for all the support, joy and suggestions to improve this work as well as my friends from the Master program for sharing their knowledge, experiences and availability to discuss ideas.
ABSTRACT
The present study aims at determining the short-term wealth effects of cross-border acquisitions (CBA) launched by European bidders between 2001 and 2010. It contributes to previous research on European CBA by focusing on the wealth gains of not only target shareholders but also bidder and combined firms shareholders. Additionally, it extends existing literature on the wealth effects of acquisitions by providing an insight of the European CBA recently launched. Using a sample of 114 completed European deals, an analysis of the cumulative average abnormal returns of all involving shareholders and the distribution between them is carried out. The number of completed acquisitions of European firms is similar to those acquisitions of non-European firms and the number of all-cash and friendly acquisitions clearly surpasses the number of all-equity or mixed and hostile acquisitions, respectively. Based on event study methodology the results show that target shareholders always gain from the offer. On the other hand, our results suggest that bidder shareholders lose wealth around announcement day. Notwithstanding bidder shares performance, our results evidence a positive combined wealth effect of cross-border deals suggesting that the target gains offset bidder losses. However this positive combined performance does not occur in the following situations: (i) acquisitions of non-European targets; (ii) acquisitions that occurred after the beginning of the financial crisis; (iii) acquisitions between firms in different business sectors, and (iv) acquisitions by relatively large bidders. A cross-sectional analysis has been performed and the results suggest that the relative size and the level of investor protection in the target firm country have an impact on bidder shares performance around announcement date. Concerning to the target shareholders the results suggest that the relative exchange rate and the level of investor protection explain targets CAR.
Keywords: Cross-Border Acquisitions, Abnormal Returns, Industry Relatedness, Relative Size, Exchange Rate, Level of Investor Protection.
TABLE OF CONTENTS
BIBLIOGRAPHIC NOTE I ACKNOWLEDGEMENTS II ABSTRACT III TABLE OF CONTENTS IV FIGURES VI TABLES VI 1. INTRODUCTION 1 2. LITERATURE REVIEW 32.1 Overview of European M&A 3
2.1.1 Abnormal Returns in M&A 4
2.2 Overview of Cross-Border M&A 5
2.2.1 Abnormal Returns in Cross-Border M&A 7
2.2.2 Abnormal Returns in Domestic and Cross-Border M&A 8
2.3 Value Drivers of Abnormal Returns 10
2.3.1 Cross-Border Characteristics 10
2.3.1.1 Exchange Rate 10
2.3.1.2 Country Development Status 11
2.3.1.3 Level of Investor Protection 12
2.3.2 Bid Characteristics 12
2.3.2.1 Means of Payment 12
2.3.2.2 Bid Attitude 14
2.3.2.3 Industry Relatedness 14
2.3.2.4 Relative Size 15
3. DATA SOURCES, SAMPLE AND METHODOLOGY 16
3.1 Sample Selection and Data Sources 16
3.2 Sample Composition 17
3.2.1 Means of Payment, Deal Attitude, Industry Sector and Relative Size 17
3.2.3 Year of Announcement 19
3.2.4 Industry Sector 20
3.2.5 Transaction Value 21
3.3 Methodology 22
3.3.1 Cumulative Abnormal Returns and Test Statistics 22
4. RESULTS 25
4.1 Short-Term Effects of Bid Announcement 25
4.1.1 Abnormal Returns by Target Region 25
4.1.2 Abnormal Returns by Period of Bid Announcement 27
4.1.3 Abnormal Returns by Industry Relatedness 29
4.1.4 Abnormal Returns by Relative Size 31
4.2 Cross-Sectional Analysis 32
4.2.1 The Model 33
4.2.2 Results of Cross-Sectional Analysis 35
4.2.2.1 Bidders 35
4.2.2.2 Targets 37
5. CONCLUSIONS 39
REFERENCES 41
FIGURES
Figure 1- Number of Cross-Border Deals by Region of Target Firm 6 Figure 2 – Value of Cross-Border M&A Acquisitions by Region of Target Firm 7 Figure 3 – Number of Transactions by Bid Announcement Year 20
TABLES
Table 1 – Sample Composition 17
Table 2– Number of Cross-Border M&A by Bidder and Target Country of Origin 19
Table 3 – Number of Transactions by Industry Sector 21
Table 4 – Transaction Value by Target Region 21
Table 5 - Cumulative Abnormal Returns by Target Region 26
Table 6 – Cumulative Abnormal Returns by Bid Announcement Period 28 Table 7 - Cumulative Abnormal Returns by Industry Relatedness 30
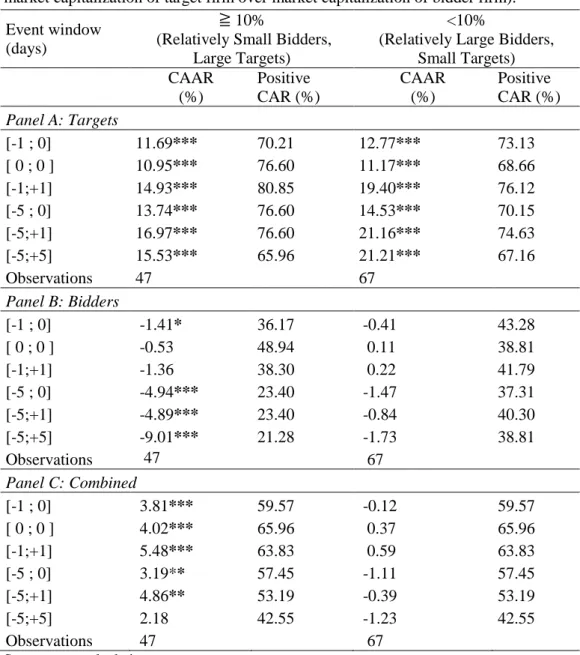
Table 8 – Cumulative Abnormal Returns by Relative Size 31
Table 9 – Variable Definitions 34
Table 10 –Regressions of Bidders CAR 36
1. INTRODUCTION
Research on mergers and acquisitions (hereinafter “M&A”) generically addresses corporate transactions, such as mergers, takeovers (including friendly and tender-offers), assets acquisitions and buyouts. Such corporate deals can be understood as investment plans carried out in order to achieve strategic goals and generate value to the firm. M&A goals are broadly associated to cost savings and revenue enhancement (Sudarsanam, 2004) but it is the assessment of value generation that can state whether those goals have been achieved.
The study of value generation of M&A requires attention to some key points. First of all, it is necessary to define how to measure value creation. Then, one should bare in mind that the conclusions of the acquisitions wealth effects on the bidder shares are much more ambiguous than those on the target shares. Third, the time span of analysis shall be taken into consideration when interpreting the final results. A short-term analysis and a long-short-term analysis around announcement may lead to different conclusions on the effects of the acquisition.
Prior literature suggests that indeed in some cases M&A create value, however this value creation is dependent on a set of variables such as the means of payment (Servaes, 1991; Barbopoulos and Sudarsanam, 2012), bid attitude (Bhagat et al., 2005), industry relatedness between involving firms (Danbolt, 2004), relative size (Jarrel and Poulsen, 1989; Asquith, Bruner and Mullins, 1983; Moeller et al., 2004), geographical scope (Martynova and Renneboog, 2011; Rossi and Volpi, 2004), exchange rates (Froot and Stein, 1991; Harris and Ravenscraft, 1991; Cebenoyan et al., 1992), the level of development of the firms countries (Doukas and Travlos, 1988) and market regulation (Bris et al., 2008; Anderson et al., 2009).
In addition, historical data illustrates that until the 90`s, M&A usually occurred under national boundaries. Globalization and markets regulations contributed to the emergence of a larger number of cross-border deals (Coeurdacier, 2009
)
. The recent transnational pattern of M&A highlights the differences between cross-border acquisitions (“CBA”) and domestic acquisitions, in terms of risk and sources of value. In Europe the number of CBA has improved significantly after 1992, first as result of the implementation of the single market and then from 1999 onwards with theimplementation of a single currency (the Euro). Although CBA have increased over the recent years, either in volume as in number, there are several questions that remain unanswered.
Most of prior investigation is based on US and UK firms, so it turns it would be interesting to improve existing empirical evidence on the European market for corporate control. Also, prior evidence on CBA is mostly focused on transactions over the 90`s, and on the gains of target firms (Danbolt, 2004; Harris and Ravenscraft, 1991; Cebenoyan et al., 1992) whereas evidence of bidders and combined wealth effects is scarce.
The empirical study of foreign transactions presents some constraints, namely in terms of statistical analysis and the set of additional variables that may explain the performance of CBA. The relative lack of research about CBA leads every new research a step ahead in terms of comprehension of these complex operations.
For all the above mentioned, the first goal of this study is to assess whether CBA undertook by European bidders between 2001 and 2010 generated value or not. Our intentions are to provide a better understanding of the effects of the cross-border bids on the abnormal returns of bidders, targets and combined firms shareholders around announcement date.
In order to achieve these goals the analysis has focused on short-term cumulative abnormal returns (CAR) around announcement day. A standard event study of CAR in several day windows around announcement day has been performed. The sample has been split according to a set of variables that might impact shareholders gains such as: i) target origin region, ii) period of bid announcement, iii) industry relatedness and iv) relative size. After a preliminary insight of some factors that may affect the performance of bidder and target shares, a cross-sectional analysis with cross-border variables (exchange rate, country development status and level of investor protection) along with variables related with bid characteristics (means of payment, relative size, industry relatedness and bid attitude) has been carried out in order to determine the relevant variables that have an impact on those shareholders gains.
To our best knowledge, so far none of the existing studies on European CBA has addressed these issues.
2. LITERATURE REVIEW
2.1 Overview of European M&A
Literature focused on European M&A is not as robust as when it comes to transactions in the US market. Prior research on European M&A is mostly focused in the 90`s and includes mainly deals between firms from different European countries (Goergen and Renneboog, 2004; Danbolt, 2004; Martynova and Renneboog, 2011).
The European M&A used to have a smaller dimension than US peer, either in volume as in number of deals. Until the 90`s the European industry profile was dominated by small and medium firms used to do business in domestic markets. The strategy of European firms then changed substantially, in part, due to abolishment of trade barriers and the establishment of the Euro-zone. It started with the single market implementation in 1992 and it was enhanced until 1999 with the European Monetary Union (“EMU”) where the Euro-Zone countries share the same currency and have a common monetary policy. In the European Union, trade agreements towards free flow of goods, economic and monetary policy integration as well as convergence in terms of products regulation and fiscal agreements between member-states have contributed to increase M&A activity (Coeurdacier et al., 2009). The reorganization of the European trade policy has encouraged firms to conquer new markets abroad (Campa and Hernando, 2004).
A firm decision on capital allocation across countries carries important sources of risk, namely political, fiscal, exchange rate, cultural, that were, in part, diluted with the EMU, and thus have stimulated foreign investment by European firms. As a consequence of the European market integration there were a lot of industry privatizations in the 90’s and a part of them were, in fact, CBA within member-states. Furthermore, convergence in terms of consumer tastes and market organization (for instance, in this period we observed the consolidation of the European bank industry) have also contributed to promote CBA.
The increase of European M&A has demanded a new era of European regulation for corporate takeovers (Goergen et al., 2005). After years of working on an attempt to build a harmonized European law applied to the market of corporate control, it was in 2004 that the European Commission established the Takeover Directive. The Takeover
Directive is based on the following general principles that shall be transposed by all Member-States to their national legislation: (i) mandatory bid-rule1; (ii) principle of equal treatment of shareholders2; (iii) squeeze-out right and sell-out right3; (iv) prohibition of market manipulation or abuse and; (v) the shareholders must have sufficient time and information to make a properly informed decision on the bid.
2.1.1 Abnormal Returns in M&A
The analysis of the wealth gains of M&A is usually based on the abnormal returns on shares measured as the difference between effective returns and expected returns (Asquith et al., 1983). This incremental share price measures the M&A effect. Also, the share price changes around bid announcement highlight market reaction to expectations of future cash flows of firms involved in M&A.
Overall, empirical evidence provides support either to positive (albeit in same cases very small) abnormal returns on targets shares (Lang et al., 1989; Campa and Hernando, 2004; Franks et al., 1991; Goergen and Renneboog, 2004; Asquith et al., 1983; Martynova and Renneboog, 2011; Moeller et al., 2004; Moeller et al., 2005) or to negative abnormal returns on bidders shares (Servaes, 1991; Sudarsanam and Mahate, 2003; Sudarsanam and Mahate, 2006) as well as to positive combined abnormal returns (Bradley et al., 1988; Lang et al., 1989; Servaes, 1991; Campa and Hernando, 2004).
Prior evidence shows that bidders do not always benefit from wealth creation of the acquisition. In fact, the bid announcement effect in the shares of bidders is puzzling even today, because in cases that M&A reduce the value of the shares of bidders, shareholders would be better without the transaction. For instance, Sudarsanam (2004) shows that bidders experience negative returns in the short-term period after the offer announcement, suggesting that those firms that entered into acquisitions have
1 Mandatory bid rule establishes that an investors that gains control of a firm, extends the offer to remaining shareholders at a fair price.
2
Principal of equal treatment of shareholders establishes that shareholders rights are proportional to the shares they hold at the firm.
3 Squeeze-out right states that a shareholder that launched a bid that allowed to hold not less than 90% of firm capital and voting rights has the right to buy the remaining capital shares at a fair price.
underperformed. However Jarrel and Poulsen (1989) as well as Dodd and Ruback (1977) report statistically significant positive abnormal returns to bidders shareholders.
The analysis of the performance of the shares of bidders deserves additional attention because bidder firms may be involved in acquisitions program for a long time (Jensen and Ruback, 1983) that not always is understood by the market. In case of multiple bids the analysis of bidder returns should consider the total number of offers launched and not just a single offer, otherwise the interpretation of bidder share price variation may not be complete.
Moreover, the combined wealth effect is also ambiguous among previous research. Roll (1986) suggests that there is a transfer of returns from bidders to targets firms. Servaes (1991) also suggests that targets gains are at cost of bidders losses but Limmack (1991), for instance, does not conclude on a wealth transfer from bidders shareholders to targets.
To sum up, one thing that seems to gather consensus among previous research is that around the announcement date abnormal returns earned by target firm shareholders are positive and much larger than those of bidder shareholders (Jarrel and Poulsen, 1989; Limmack, 1991).
2.2 Overview of Cross-Border M&A
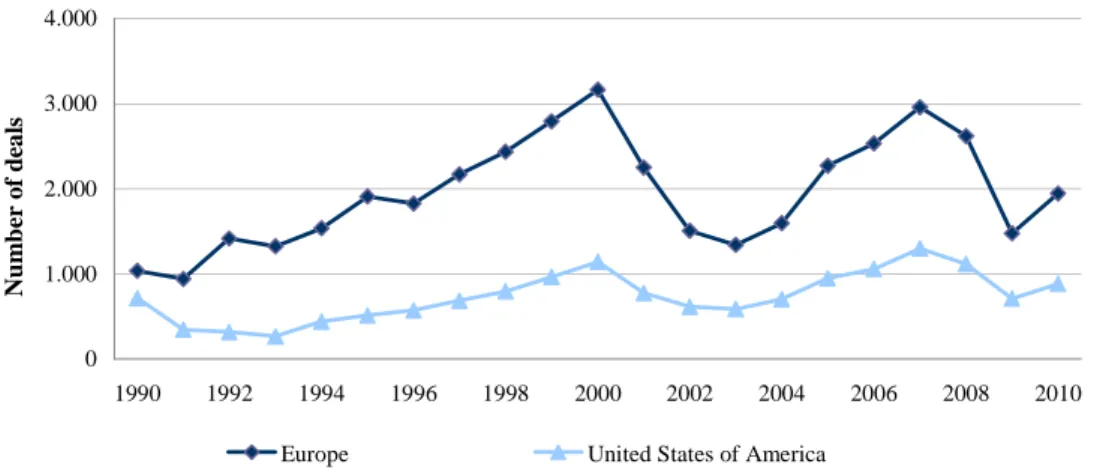
Cross-border acquisitions account for a great part of foreign direct investment (FDI) in developed countries. After the 80’s, research on CBA has increased because of the growing magnitude of international trade and capital flows. According to UNCTAD4 data, the number of CBA deals has increased steadily (see Figure 1) over the last two decades. In the 90’s there were 27,283 CBA. From 1998 to 2000 there were 11,283 CBA deals which represented 41% of total CBA deals launched between 1990 and 2000. In the following decade there were 29,177 CBA deals, 4% more than the previous decade.
UNCTAD data also shows that there was a higher volume and number of CBA deals in Europe than in the US (see Figures 1 and 2). The larger dimension of US domestic market allows firms to grow within national boundaries, whereas in Europe,
each country has its singularities. Only after the monetary policy harmonization in 1992 conditions were created to generate a wave of acquisitions between firms from different European countries.
Figure 1 - Number of Cross-Border Deals by Region of Target Firm
0 1.000 2.000 3.000 4.000 1990 1992 1994 1996 1998 2000 2002 2004 2006 2008 2010 N u m b er o f d ea ls
Europe United States of America
Source: UNCTAD World Investment Report 2012
Moreover, from 1997 to 2001 and then from 2005 to 2009 there is a large gap in terms of transaction volume between CBA undertook by European and US firms (see Figure 2).
Prior literature suggests that factors such as differences in law, stronger investor protection and better accounting standards may contribute to the higher volume of CBA in certain countries. Additionally, the likelihood of acquiring a firm from a nearby country is also higher than a firm from a farther country (Erel et al., 2012). Also, hostile bids are more likely to occur in countries with higher investor protection and firms from countries with weaker investor protection are more likely targets in CBA (Rossi and Volpi, 2004). On the other hand, bidders often choose to cross-list in target firms country first and then place the offer on. Therefore Tolmunen and Tostila (2005) suggest that European cross-listed firms in US stock markets are more likely to go for a CBA than non-cross listed European firms. Cross-listing is also found to be part of internationalization process of a firm as well as play the role of means of exchange. It may work as the M&A currency because in equity bids, target firm shareholders prefer to be paid with domestic shares rather than foreign shares because of taxes, regulatory framework and quality of investor protection, among other reasons.
Figure 2 – Value of Cross-Border M&A Acquisitions by Region of Target Firm 0 50.000 100.000 150.000 200.000 250.000 300.000 350.000 1990 1991 1992 1993 1994 1995 1996 1997 1998 1999 M il li o n s o f $ U S Europe United States of America 0 100.000 200.000 300.000 400.000 500.000 600.000 2000 2001 2002 2003 2004 2005 2006 2007 2008 2009 2010 M il li o n s o f $ U S Europe United States of America
Source: UNCTAD World Investment Report 2012
Volume of border deals in $US million. The graph on the top shows evolution of volume of cross-border deals, per country of target firm in $US millions from 1990 to 1999. The graph on the bottom shows evolution of volume of cross-border deals, per country of target firm in $US millions from 2000 to 2010.
In terms of industry focus, CBA often occur between firms operating in R&D intensive industries and between firms in related industries, hence supporting the hypothesis of imperfections in markets of goods and factors (Harris and Ravenscraft, 1991).
2.2.1 Abnormal Returns in Cross-Border M&A
Empirical evidence on CBA wealth creation is not abundant. Moreover, most studies address the bid effect on bidder shareholders (Moeller and Schlingemann, 2005;
Doukas and Travlos, 1988) or target shareholders (Harris and Ravenscraft, 1991) but not often provide data of combined returns.
Prior research on CBA shows that, on average, target firms experience positive significant abnormal returns on bid announcement day and post-bid period (Danbolt, 2004; Campa and Hernando, 2004), and also suggest that bidders tend to gain from CBA around announcement (Goergen and Renneboog, 2004; Martynova and Renneboog, 2011; Bhagat et al., 2011). For instance, regarding the European market, findings from Martynova and Renneboog (2011) show that in CBA launched by firms from Continental Europe and UK, both bidders and targets shareholders earn positive abnormal returns around the announcement day, though the gains of bidders are lower than those of targets. Consistent with previous results, Bhagat et al. (2011) analyzed a sample of CBA undertook by bidders located in emerging countries and their results confirm positive market reaction on announcement day, materialized in a cumulative average abnormal return of 1.09% on the shares of bidders.
Notwithstanding previous general findings, the analysis of CBA performance is not so clear and depends on a set of other variables. For instances, the work of Doukas and Travlos (1988) reports that acquisition announcement by US multinational firms with no operations in the target firm country has positive effect on bidder shares. Their findings are consistent with the theory of multinational firms that states that internationalization plans are implemented only if they generate value for the firm. However, in cases where US firms already have operations in target firm country, the acquisition has not led to gains to bidder shareholders. Furthermore, the research of Eun
et al. (1996) holds that CBA generate positive gains for target firms but the effect on the
gains of bidders depends on the capacity to internalize activities of target firms.
2.2.2 Abnormal Returns in Domestic and Cross-Border M&A
Most CBA studies focus on comparisons with domestic acquisitions.
Previous empirical evidence shows that targets tend to earn higher abnormal returns in CBA than in domestic bids around announcement (Harris and Ravenscraft, 1991; Goergen and Renneboog, 2004; Campa and Hernando, 2004; Danbolt, 2004). However the recent study of European M&A lead by of Martynova and Renneboog
(2011) shows the opposite, i.e., targets shareholders present higher gains in domestic bids rather than in cross-border bids.
General theory of FDI predicts that bidders launch cross-border offers to take advantage of market imperfections and thus generate more value to the firm. On the other hand, bidders are expected to pay higher premiums in cross-border deals than in domestic deals because they have to launch attractive offer prices in order to acquire target shares and the lack of knowledge and uncertainty about a firm from a foreign country turns it more difficult to be aware of target value.
Prior empirical evidence of Goergen and Renneboog (2004) and Martynova and Renneboog (2011) has not confirmed a negative effect of the cross-border bid over the bidders wealth. These authors have found positive abnormal returns on bidder shares, although Martynova and Renneboog (2011) find them to be lower in cross-border acquisitions than in domestic acquisitions. Their results suggest that market has anticipated some constrains that could arise from integration process during post-acquisition period.
For the reasons above mentioned, the combined wealth effect is also expected to be higher in cross-border than in domestic deals. However, Moeller and Schlingemann (2005) find statistically significant negative combined cross-border effect of -0.866% (measured as the difference between abnormal returns in transnational bids and domestic bids) in European transactions. In addition, evidence from Campa and Hernando (2004) also reports higher combined wealth creation in domestic deals.
Difficulty on valuating foreign firms due to different accounting standards, exchange rate fluctuations, cultural disparities and other factors may contribute to enlarge valuation errors in CBA (Danbolt, 2004).
Literature suggests that the premium paid by bidders depends on specific features of the target country such as corporate governance regimes, ownership concentration, takeover regulation or information transparency. Rossi and Volpi (2004) show that bid premiums are higher in CBA wherein target firms are located in countries with stronger investor protection and that the higher the investor protection of the target firm country, the less likely all-cash bids are. If there is a stronger level of investors protection in the target country, the chance of an unsuccessful bid increases, which makes cash transactions to be avoided and encourages bidders to pay higher premiums.
Managerial goals may, as well, justify the managers decision of overpaying for corporate acquisitions (Eun et al., 1996) and in case of CBA the stimulus to pay a larger premium is higher.
2.3 Value Drivers of Abnormal Returns
Previous studies on the sources of value creation identify a set of factors that affect the profitability of acquisitions. Some of these sources are related to general bid characteristics, others are specific to CBA.
2.3.1 Cross-Border Characteristics
Prior research suggests that the performance of CBA depends on a set of factors, namely the exchange rate movements, the countries development status and the level of investor protection.
CBA characteristics related with law, accounting standards, corporate governance systems, economic environment, cultural differences, fiscal policy, information transparency and investor protection, among others, require a complex analysis of their effects. The decision for a transnational bid shall bare in mind these differences and the way to minimize the negative effects that may arise on the post-acquisition period. Only through an integrated management approach can CBA surpass these obstacles and generate value.
2.3.1.1 Exchange Rate
Previous literature suggests that exchange rates not only pursue the choice for CBA instead of domestic deals, but also have an impact on abnormal returns from CBA. Erel et al. (2012) document that currency movements influences the option to launch a cross-border bid, especially when involved firms are from geographically close countries or when bidders are from wealthier countries than targets. Moreover, bidder firms located in countries with relative stronger currencies tend to purchase firms in countries with weaker currencies in order to pay smaller premiums than bidders from
countries with relatively weaker currencies (Tolmunen and Tostila, 2005). Bidders that acquire a firm from a country with relative weaker currency become more competitive than domestic bidders (Froot and Stein, 1991).
Literature suggests that the strength of the bidder home currency explains part of its gains because the risk associated with information asymmetry may be, in part, surpassed by the relative exchange rate effect, thus contributing to the improvement of the bidder shares performance (Froot and Stein, 1991).
Consistent with this argument, Harris and Ravenscraft (1991) and Cebenoyan et
al. (1992) find statistical significant effect of the exchange rate on the gains of target
firms in acquisitions where the bidders currency is relative stronger than targets currency. Their results show that CBA generate more gains to target shareholders when the bidders currency is stronger than targets` currency. However the work of Eun et al. (1996) and Danbolt (2004) suggest that the exchange rate has no effect over bidder, target and combined abnormal returns around announcement.
2.3.1.2 Country Development Status
Prior research has identified the level of economic development of a country as a factor that may influence the performance of CBA. Literature suggests that the bidders profitability is higher when targets are from less developed countries than bidders.
Doukas and Travlos (1988) find evidence to support this hypothesis. They find a positive relation between US multinational bidders expanding abroad with no operation in target country and bidders gains around announcement. The positive effect on the bidders gains is stimulated by positive market expectations about the set of opportunities that become available in the new market to those US firms.
Erel et al. (2012) suggest that the country development status is related to the quality of accounting standards. Countries with high level of development are associated with better quality accounting standards regimes as well as a sophisticated level of corporate governance regime. Bidders from countries with relative higher development status have greater chance to earn abnormal returns because CBA increase the quality of accounting standards of target firms thus improving the post-acquisition performance.
2.3.1.3 Level of Investor Protection
Investor protection is provided by the commercial code or corporate law valid in the country of origin of the firm. CBA to target firms in countries with strong level of investor protection have more difficulties on passing without prior market notice before the announcement. A set of regulatory demands turns the bid more predictable.
As such, target firms from countries with stronger investor protection are found to earn larger abnormal returns (Bris et al., 2008; La Porta et al., 1998; Anderson et al., 2009) and bidders to pay higher premiums to prevent from competitive bids (Bebchuk, 2005). In addition, CBA wherein bidders are from countries with above-median shareholder protection and targets are from countries with low-median shareholder protection, have positive significant combined abnormal returns at announcement. When the opposite verifies, that is to say, targets are from high-median protection countries and bidders are from low-median protection countries, CBA have significant negative combined abnormal returns (Bris et al., 2008).
Other studies show that countries with stronger shareholder protection present larger M&A activity and firms located in countries with weaker investor protection are generally acquired by firms from countries with stronger one (Rossi and Volpin, 2004).
2.3.2 Bid Characteristics
Prior literature has shed light on the impact of bid characteristics in M&A gains, in particular, those of targets and bidders shareholders. Factors such as means of payment (cash, equity, mixed), bid attitude (friendly, hostile), firms relative size and industry relatedness are hypothesised to influence wealth creation of M&A.
2.3.2.1 Means of Payment
Prior empirical evidence shows that cash offers usually lead to gains not only to targets shareholders (Goergen and Renneboog, 2004) but also to bidders’ (Martynova and Renneboog, 2011) while equity exchange offers have negative effect on the bidders wealth (Franks et al., 1991). Consequently, cash offers are suggested to have positive combined wealth effect (Servaes, 1991).
The explanation is that cash offers deserve more reflection from bidders’ management since it is hard for a firm manager that has cashed in to spend the money in unprofitable businesses. Moreover, the means of exchange of the offer may be a market sign of bidder shares value. The underlying idea is that in periods of high equity market valuations and information asymmetry, bidders managers that think the firms share are overvalued prefer to exchange them in M&A, instead of paying the offer with cash.
The hypothesis of means of payment is confirmed in the works of Servaes (1991) and Martynova and Renneboog (2011) that suggest cash bids to provide positive abnormal returns to targets and moderate abnormal positive returns to bidders.
Goergen and Renneboog (2004) show that target shareholders present larger gains in all-cash offers and their abnormal returns are indeed sensitive to the means of payment, albeit they do not find evidence consistent with this hypothesis when it comes to bidders. The authors find that bidder shareholders report statistically significant larger gains in all-equity bids than in all-cash bids suggesting that means of payment do not act as a market sign of under or overvaluation of bidder shares. Furthermore in case of high uncertainty around the target firm value, bidders may prefer the stock exchange payment, instead of cash, in order to prevent the negative consequences from information asymmetry.
Information asymmetry is hence, one of the causes highlighted to the use of earnouts as part of the payment. The use of earnouts allows reducing the risk from information asymmetry since a part of the price is contingent to some events and so limits the adverse selection problem. As such the means of payment may contribute to risk diversification in M&A, thus improving the bidder shares performance in relation to transactions where there are no earnouts (Barbopoulos and Sudarsanam, 2012). Barbopoulos and Sudarsanam (2012) suggest that the higher the proportion of price paid as earnouts, the better the bidders performance in post-acquisition period.
To the extent that targets valuation is more complex in CBA we would expect bidders to prefer equity bids. However, the means of payment in CBA is dictated by the preference of target shareholders for cash, instead of foreign equity.
Not consistent with previous evidence some studies do not find significant abnormal returns for bidder shares nor for targets attending hypothesis of means of exchange (Leeth and Borg, 2000; Bhagat et al., 2005).
Finally, some authors have studied the relation between the means of payment of M&A and the firms’ size concluding that cash bids are more likely to occur when they involve small targets (Goergen et al., 2004)
2.3.2.2 Bid Attitude
Bid attitude hypothesis suggests that hostile takeovers are more profitable than friendly acquisitions. A possible explanation is the market expectation that the impact of bidder management on target firm is higher in hostile than in friendly bids, thus resulting in larger value creation (Bhagat et al., 2005).
Prior empirical evidence supports larger positive abnormal returns to target shares in hostile rather than in friendly bids around announcement day (Goergen and Renneboog, 2004; Martynova and Renneboog, 2011; Servaes, 1991).
Concerning to bidders performance, prior empirical evidence is not consistent with the theoretical bid attitude framework. Bhagat et al. (2005) show that bidders of friendly M&A outperform bidders of hostile ones. Consistent with their findings, Goergen and Renneboog (2004) also find negative abnormal returns for bidders in hostile European bids whereas positive abnormal returns in friendly bids in short-term windows around announcement day. Sudarsanam and Mahate (2006) confirm that in long event windows post announcement period bidders also experience negative abnormal returns in hostile bids.
Rossi and Volpi (2004) study the likelihood to launch a hostile bid and their results show that hostile bids are more likely to occur in countries with stronger shareholders protection.
2.3.2.3 Industry Relatedness
M&A can be driven by focus or diversification strategies, whether the offer goes for a firm in same or different business sector. The industry hypothesis suggests that diversification strategy tend to be less profitable for bidders than focus oriented ones, due to lack of knowledge of the new business they are entering into.
Prior research has shown that target firms tend to experience larger positive abnormal returns in M&A driven by diversification rather than focus goals suggesting
that bidders overpay for the acquisitions (Martynova and Renneboog, 2011). Consistent with previous evidence, Danbolt (2004) confirms that the industry relatedness between firms explains part of targets abnormal returns.
The research of Martynova and Renneboog (2011) shows that in short event windows around announcement focus oriented M&A tend to be more profitable to bidder shareholders than diversified ones. Evidence from Agrawal et al. (1992) also shows that in the post-acquisition period bidders of acquisitions cross-industry present significant higher losses than those in oriented acquisitions. Not consistent with previous results Eun et al. (1996) provides evidence that in CBA of US target firms operating in different business area, bidders experience higher share price variation around announcement than peers that entered into related industry acquisitions.
Additionally, Doukas and Travlos (1988) suggest that in CBA of bidders expanding into new geographical markets the industry relatedness between firms has a positive impact in the bidders gains. These authors defend that bidders benefit from acquisition when they diversify in terms of industry and geographical market.
2.3.2.4 Relative Size
Prior studies on M&A performance support the relation between bidders returns and target firm relative size, suggesting that the larger the target size, the higher the abnormal returns to bidders around announcement (Asquith et al., 1983; Jarrel and Poulsen, 1989; Moeller et al., 2004; Martynova and Renneboog, 2011). They suggest that relative larger bidders overpay in larger scale and the size of premium paid is positively related with relative size of the bidder firm (Moeller et al., 2004).
Large firms tend to have more regulation constrains than small firms which may explain evidence of higher abnormal returns on shares of small bidders. Nonetheless, the research of Agrawal et al. (1992) does not confirm that the bidders relative size is a statistically significant variable to explain bidders post-acquisition performance (up to 60 months) in completed mergers. Also, prior research of Asquith et al. (1983) has not found evidence of the impact of relative size in target shares performance.
From a different perspective, Tolmunen and Tostila (2005) and Erel et al. (2012) suggest that large firms are more likely to be acquirers in CBA than small firms.
3.
DATA SOURCES, SAMPLE AND METHODOLOGY
3.1 Sample Selection and Data Sources
For the purpose of this study a CBA is a transaction between two firms, each one with primary location in different countries. In order to perform the analysis, a sample of CBA announced between January 2001 and December 2010, by European bidders, has been selected. Our sample was selected using S&P Capital IQ database.
First, all CBA transactions launched by bidders with primary location in Europe over the last decade were collected. The data was then restricted to deals involving public firms (bidder and target) at the announcement date. Deals with at least one firm operating in the financial industry were excluded due to specificities of this industry in terms of accounting information and nature of operations, which has led to 1,641 CBA deals.
Then, 1,186 deals were dropped as they did not involve the acquisition of a majority stake. This was due not only to the fact that, according to Rossi and Volpi (2004), the acquisition of a stake below 50% is affected by severally cross-country differences in disclosure requirements but also to the combined wealth effect that this study is trying to assess makes sense if bidders gain control over targets with the acquisition.
From the remaining 455 deals only successful deals (closed or effective deals on or prior December 2012) were considered. At this stage 87 deals were dropped. Finally, for methodology purposes, from the 368 deals only those that, for both bidder and target firms, share price were available throughout the 60 month-period before the announcement date were kept in our sample.
Given all these constrains the sample comprises 114 CBA occurred between 2001 and 2010 where bidder firms are from 18 European countries and target firms are from 26 European and non-European countries. For each deal in the sample data, the share prices (in domestic currency) and shares outstanding were collected from the Reuters Datastream database. The shares price was then converted ton US dollars using the historical exchange rate, also collected from Thompson Reuters database. Additional information on the offer such as means of payment (cash, equity, mixed),
deal attitude (hostile, friendly, friendly to hostile) and industry relatedness were collected from S&P Capital IQ database.
3.2 Sample Composition
3.2.1 Means of Payment, Deal Attitude, Industry Sector and Relative Size
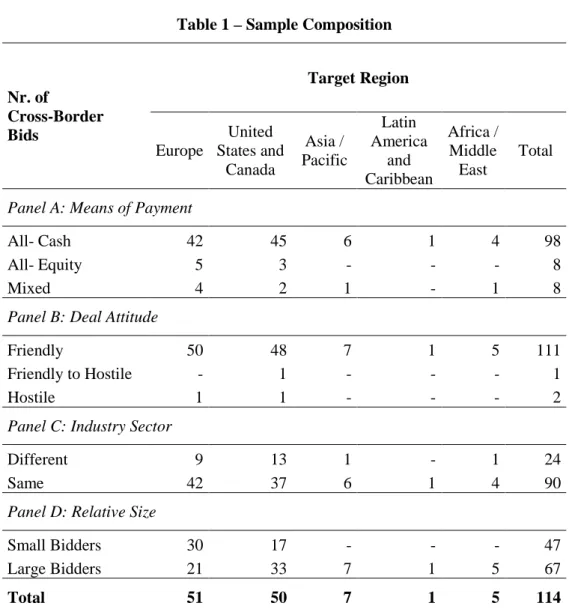
As expected and consistent to prior evidence from Danbolt (2004) and Goergen and Renneboog (2004) Table 1 shows that a large part of the sample is represented by all-cash deals (86%). In CBA the offer is more likely to be accepted if it is an all cash-offers.
Table 1 – Sample Composition
Nr. of Cross-Border Bids Target Region Europe United States and Canada Asia / Pacific Latin America and Caribbean Africa / Middle East Total
Panel A: Means of Payment
All- Cash 42 45 6 1 4 98
All- Equity 5 3 - - - 8
Mixed 4 2 1 - 1 8
Panel B: Deal Attitude
Friendly 50 48 7 1 5 111
Friendly to Hostile - 1 - - - 1
Hostile 1 1 - - - 2
Panel C: Industry Sector
Different 9 13 1 - 1 24
Same 42 37 6 1 4 90
Panel D: Relative Size
Small Bidders 30 17 - - - 47
Large Bidders 21 33 7 1 5 67
Total 51 50 7 1 5 114
The sample is also dominated by friendly acquisitions (97%) and of firms from the same industry (roughly 79%), suggesting that bidders were not looking for business diversification.
In terms of relative size, in 47 deals (about 41% of total sample) the target market capitalization exceeds in more than 10% of bidder market capitalization. The relative size was measured six months before announcement following Asquith et al. (1983). Therefore, most of the sample deals (59%) comprise relative large bidder firms.
3.2.2 Country of Origin
Table 2 shows that 55% of European offers in the sample targeted firms from a country outside Europe, in particular, from US and Canada (44%). In fact, Europeans firms have acquired US and Canadian firms as much as European firms. This bid exposure is different from the studies based on the 90 decade where most of the cross-border acquisitions were intra-European.
Bidder firms are mainly from the UK (23%), France (17%), Germany (11%) and Switzerland (10%) whereas most target firms are located in the US (37%), UK (15%) and Canada (7%). Firms from Anglo-Saxon countries are far more active in the market for corporate control than Continental European firms, either as target or bidder firms. Cultural similarities and historical development of equity markets may justify the relevance of these countries.
Notwithstanding, bidder firms from France and Switzerland are far beyond the most active Continental European firms with predominance to make cross-border acquisitions outside Europe. On the contrary, bidder firms from German and Netherlands are more focused in cross-country acquisitions within the European market.
Table 2– Number of Cross-Border M&A by Bidder and Target Country of Origin Bidders
Targets FIN FRA GER IRE ITA NET SPA SWE SWI UK OEC Total
AUS - - - 4 - 4 CAN - 1 1 - 1 - - 1 1 3 - 8 FRA - - 1 - 1 1 - - - 2 - 5 NET - 1 - - - 1 - 1 2 5 SAF - - - 3 1 4 SWE 2 1 - - - 2 5 UK 1 3 2 3 1 1 2 1 3 - - 17 USA 2 10 3 2 3 3 0 2 6 9 2 42 OEC - 1 5 - - 3 2 1 1 2 3 18 ONEC - 2 - - - - 1 - - 2 1 6 Total 5 19 12 5 6 8 5 6 11 26 11 114
Source: own calculations
AUS – Australia; CAN – Canada; FRA – France; GER – Germany; IRE - Ireland; ITA – Italy; NET – The Netherlands; SAF – South Africa; SPA – Spain; SWE – Sweden; SWI – Switzerland; UK - United Kingdom; USA - United States; OEC – Other European countries including (i) target firms from countries such as Austria, Belgium, Cyprus, Czech Republic, Finland, Hungary, Italy, Norway, Poland, Portugal and Switzerland and (ii) bidder countries such as, Austria, Belgium, Gibraltar, Greece, Lithuania, Luxemburg and Norway; ONEC – Other Non-European Countries such as Chile, China, Israel, Japan and Philippines.
3.2.3 Year of Announcement
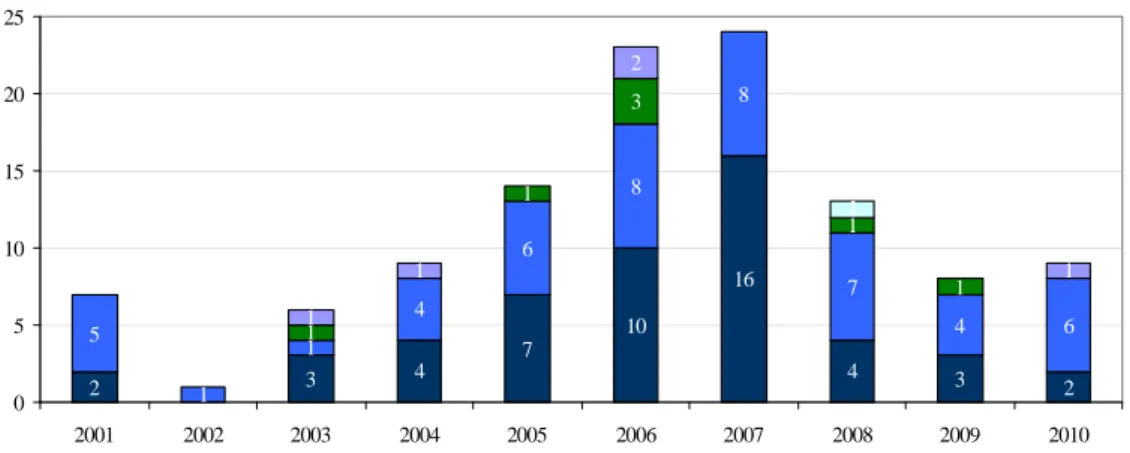
The CBA sample is clearly concentrated over the period between 2005 and 2008 (particularly during 2007). Over this time period the total transaction value of CBA accounts for approximately 330 billion dollars which represents more than 84% of all CBA in this 10-year period (see Figure 3). Additionally, the number of deals during these years (74) represents 65% of total sample and the mean transaction value during the same period was 54% higher than the mean value for the all period.
As expected after 2008 there was a slow-down of CBA activity by European firms, nonetheless the number of CBA exceeds those announced between 2001 and 2003. Cross-border acquisitions of European firms have presented a sharper fall than firms from overseas. The CBA activity behavior is consistent with the findings of Eckbo (2010) that states that waves generally start in the periods of economic growth
and credit expansion, being the peak usually associated with high bid premiums, and then finish at the beginning of recession.
Figure 3 – Number of Transactions by Bid Announcement Year
2 3 4 7 10 16 4 3 2 5 1 1 4 6 8 8 7 4 6 1 1 1 1 1 1 2 1 1 3 0 5 10 15 20 25 2001 2002 2003 2004 2005 2006 2007 2008 2009 2010
Europe United States and Canada Asia / Pacific Africa / Middle East Latin America and Caribbean Source: own calculations.
3.2.4 Industry Sector
Table 3 shows the industry of both the bidders and target firms. Although the sample of CBA is very heterogeneous, most bidder firms come from industries such as industrials (19%), healthcare (18%) and information technology (16%). European targets operate mainly in information technology (29%), industrials (20%), and materials (14%) industries, while non-European targets were from healthcare (24%), IT (19%) and industrials (14%) industries. The sample is consistent with the findings of Harris and Ravenscraft (1991) that most cross-border deals occur in R&D intensive industries. Finally, as shown in Table 3 most CBA involved firms of same industry sector (90 out of 114 CBA) suggesting that most acquisitions were driven by business expansion and growth goals, as opposed to diversification strategies.
Table 3 – Number of Transactions by Industry Sector
Target firms Bidder firms
European Non-European Industry Nr. % Nr. % Nr. % Consumer Discretionary 8 16 7 11 16 14 Consumer Staples 6 12 6 10 10 9 Energy 0 0 6 10 6 5 Healthcare 5 10 15 24 20 18 Industrials 10 20 9 14 22 19 Information Technology 10 20 12 19 18 16 Materials 8 16 6 10 13 11 Telecommunication Services 3 6 1 2 5 4 Utilities 1 2 1 2 2 2 Total 51 63 114
Source: own calculations.
3.2.5 Transaction Value
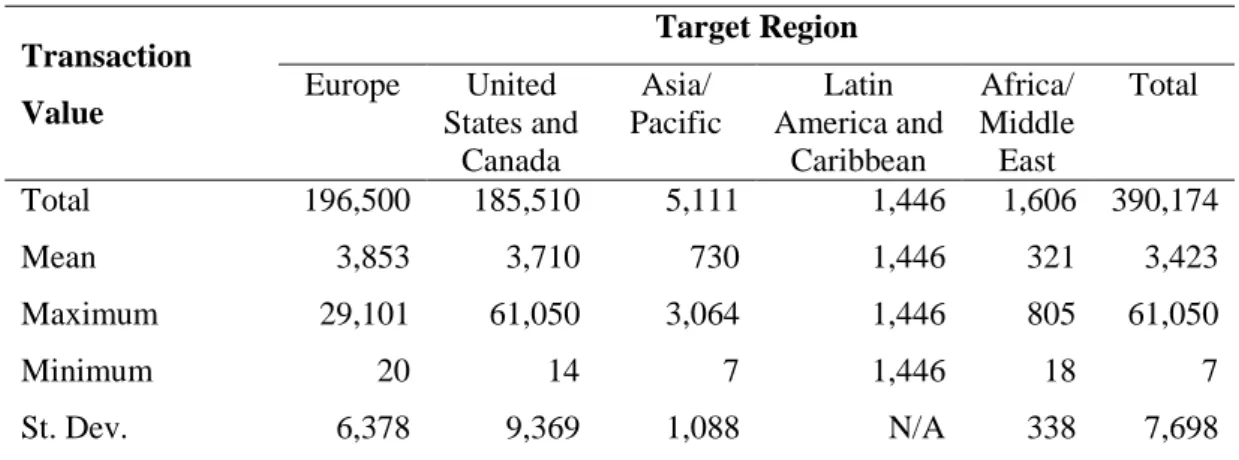
As shown in Table 4 the average transaction value was 3.4 billion dollars. However, the average transaction value is higher cases where the target firm is from United States, Canada or other European country (around 3.7 billion dollar) whereas the transaction value of firms from other regions is lower than 1.5 billion dollars.
Table 4 – Transaction Value by Target Region Transaction Value Target Region Europe United States and Canada Asia/ Pacific Latin America and Caribbean Africa/ Middle East Total Total 196,500 185,510 5,111 1,446 1,606 390,174 Mean 3,853 3,710 730 1,446 321 3,423 Maximum 29,101 61,050 3,064 1,446 805 61,050 Minimum 20 14 7 1,446 18 7 St. Dev. 6,378 9,369 1,088 N/A 338 7,698
Source: own calculations. St. dev stands for standard deviation Transaction values in millions of US dollars.
3.3 Methodology
3.3.1 Cumulative Abnormal Returns and Test Statistics
In order to assess the short-term impact of European cross-border acquisition in shareholders wealth an event study has been performed based on the cumulative abnormal return (CAAR) around the announcement day. For that purpose, the CAAR has been computed within a short event window around the bid announcement day and then tested on its statistical significance.
The event study analysis has been carried through the following steps: (i) determination of event date that, in this case, is the bid announcement day (t = 0); (ii) definition of event window and (iii) computation of CAAR. The event window has a maximum length of 11 days starting five days prior and goes up to five days after the bid announcement day (following Bradley et al., 1988; Lang et al. 1989; Martynova and Renneboog, 2011) to capture short-term effect of CBA announcement.
The CAAR gives the impact of the bid announcement in shareholders wealth and is defined as:
N CAR CAAR N i i
∑
= = 1 (1)N represents the number of firm and the cumulative abnormal return of shares of firm i at a certain event window (CARi) represents the sum of daily abnormal return of shares of for a certain firm i during an event window (ARi) that is computed as:
∑
= = T t t i i AR CAR 1 , (2)The daily abnormal return of shares of firm i at day t (ARi,t) is calculated as:
) ( , , ,t it it i R E R AR = − (3)
Where Ri,t is the realized return of shares of firm i at day t and E(Ri,t) is the expected return of shares of firm i at day t. The expected returns on shares were estimated based on market model and following Brown and Warner (1985) that concluded that although the market model (see equation 4) is a straightforward
procedure leads to results in estimation of abnormal return (AR) as good as, other more complex models. t i t m i i t i R e R, =α +β . + , (4) where:
Ri,t – return of the share of the firm i on day t, t = -5,…,5;;
Rm,t – return of the market index MSCI World at day t, t = -5,…,5;
βi – measure of the sensibility of the volatility of shares of firm i towards the market volatility
(given by MSCI World Index);
α
i – measure of the average return of shares of firm i independent of market return during themoment t;
ei,t – stochastic error,
∑
ei,t = 0.Market model as proposed by Fama (1976) assumes that the expected return on a firm share is linearly related to the market return and to other factors not related with market return. In this dissertation it is assumed that the effect of the event, the announcement bid, is not fully captured by the expected returns obtained through market model, so any difference between the actual return and the expected return is assumed to be the effect of the announcement bid.
The parameters
α
and β were estimated using market returns (MSCI – World Index as proxy) and realized share returns over the pre-event period. The estimation window starts in the month previous the bid announcement month and goes up to 60 months prior bid announcement (from month=-1 to month =-60). It is assumed that the model parameters are constant throughout event window and estimation period.The log difference in MSCI – World Index is used as proxy of the market return:
) ln( ) ln( , , 1 ,s = ms − ms− m P P R (5) where:
Pm,s – MSCI World index value at month s , s=-1, …,-60;
Given that the CAAR gives the impact of the bid announcement in shareholders wealth, if the null hypothesis (H0: CAAR = 0) is rejected we may conclude that bid announcement has an impact in shareholders wealth.
It is assumed that CAAR follows a normal distribution ~ N (0, σ) and since the goal is to test whether CAAR equals zero, the test statistics follows a T-student distribution, as proposed by Brown and Warner (1985):
) (CAR S CAAR tstat = (6)
∑
= − − = N i i CAAR CAR N CAR S 1 2 ) ( 1 1 ) ( (7) where:tstat - t-student test statistic with n-2 degrees of freedom;
CAAR - Cumulative Average Abnormal Returns;
S(CAR) - Sample standard deviation of CAR, which is the best unbiased estimator of standard deviation of population (σ);
CARi – Cumulative Abnormal Return of firm i, i = 1,...,N
N = Total number of firms.
Moreover, the analysis has been performed either for bidders, targets and combined paired match of both firms shares to assess the differences that bid announcement has in all firms involved in the transaction.
The total return for combined pair of bidders and targets shares is computed following Goergen et al. (2004) and Cybo-Ottone and Murgia (2000):
Bidder et T Bidder Bidder et T et T Combined MV MV MV CAAR MV CAAR CAAR + +
= arg * argarg * (8)
where:
CAARCombined – CAAR of combined sample of bidders and targets;
CAARTarget –Targets CAAR;
CAARBidder – Bidders CAAR;
MVTarget – Market capitalization of portfolio of targets 6 months prior the beginning of event window;
4. RESULTS
4.1 Short-Term Effects of Bid Announcement
This section presents the effects of bid announcement in targets, bidders and combined firms shares over the following event windows: [-1;0], [-1;+1], [0;0], [-5;0], [-5;+1] and [-5;+5]. The results of the tests of sample split by means of payment and deal attitude are not presented because the sample is dominated by all-cash (85.96%) and friendly (95.61%) acquisitions so the conclusions would be very similar to the ones presented in following section 4.1.1.
4.1.1 Abnormal Returns by Target Region
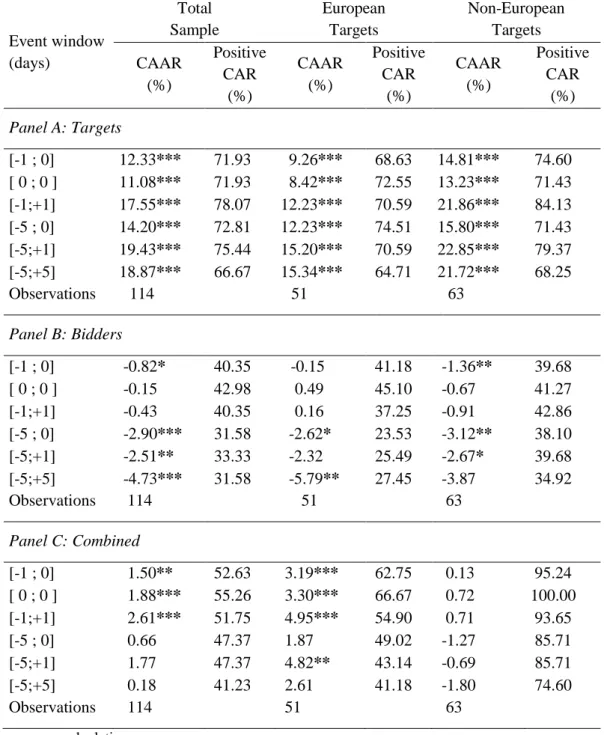
As shown in Table 5, target shareholders experience, on average, positive wealth gains while bidder shareholders, generally, present wealth losses around bid announcement day. These results suggest that the market does not expect the bid to benefit bidder shareholders. The combined effect is positive though statistical significance is not found in the case where the target is a non-European firm.
Panel A of Table 5 shows that the bid announcement has positive effect on target shareholders wealth in all event windows. The target shareholders CAAR[-5;+5] is higher than the one observed by Martynova and Renneboog (2011) for European CBA (12.17%), however it is lower than the one reported by Eun et al. (1996) for CBA of US targets (37.02%). The results also show that the CAAR[-1;+1] of target shareholders equal to 17.55% is higher than the one observed in Campa and Hernando (2004) and Martynova and Renneboog (2011) of, 4.08% and 11.52%, respectively. The CAAR[-1; 0] of 12.33% is also higher than the 11.25% reported by Goergen and Renneboog (2004).
The results also show that CBA of non-European target firms provide a higher abnormal return to target shareholders, which means that bids to overseas firms priced larger premiums. Assuming that the acquisition of European firms by European firms may be similar to domestic M&A due to harmonized framework of corporate law and monetary policy, these results suggest that cross-border acquisitions provide higher
returns than domestic deals, confirming evidence from Goergen and Renneboog (2004) but not from Martynova and Renneboog (2011) nor Moeller et al. (2005).
Table 5 - Cumulative Abnormal Returns by Target Region
This Table shows the cumulative abnormal returns measured over several event windows for targets, bidders as well as combined paired sample by target region.
Event window (days) Total Sample European Targets Non-European Targets CAAR (%) Positive CAR (%) CAAR (%) Positive CAR (%) CAAR (%) Positive CAR (%) Panel A: Targets [-1 ; 0] 12.33*** 71.93 9.26*** 68.63 14.81*** 74.60 [ 0 ; 0 ] 11.08*** 71.93 8.42*** 72.55 13.23*** 71.43 [-1;+1] 17.55*** 78.07 12.23*** 70.59 21.86*** 84.13 [-5 ; 0] 14.20*** 72.81 12.23*** 74.51 15.80*** 71.43 [-5;+1] 19.43*** 75.44 15.20*** 70.59 22.85*** 79.37 [-5;+5] 18.87*** 66.67 15.34*** 64.71 21.72*** 68.25 Observations 114 51 63 Panel B: Bidders [-1 ; 0] -0.82* 40.35 -0.15 41.18 -1.36** 39.68 [ 0 ; 0 ] -0.15 42.98 0.49 45.10 -0.67 41.27 [-1;+1] -0.43 40.35 0.16 37.25 -0.91 42.86 [-5 ; 0] -2.90*** 31.58 -2.62* 23.53 -3.12** 38.10 [-5;+1] -2.51** 33.33 -2.32 25.49 -2.67* 39.68 [-5;+5] -4.73*** 31.58 -5.79** 27.45 -3.87 34.92 Observations 114 51 63 Panel C: Combined [-1 ; 0] 1.50** 52.63 3.19*** 62.75 0.13 95.24 [ 0 ; 0 ] 1.88*** 55.26 3.30*** 66.67 0.72 100.00 [-1;+1] 2.61*** 51.75 4.95*** 54.90 0.71 93.65 [-5 ; 0] 0.66 47.37 1.87 49.02 -1.27 85.71 [-5;+1] 1.77 47.37 4.82** 43.14 -0.69 85.71 [-5;+5] 0.18 41.23 2.61 41.18 -1.80 74.60 Observations 114 51 63
Source: own calculations.
t-statistic follows a t-student distribution. ***, **, * denotes for 1%, 5% and 10% significance level for a two-tailed test.
Contrary to targets scenario, Panel B of Table 5 shows that CBA announcement causes short-term negative effect on the wealth of bidder shareholders. The negative performance of bidder shares is worse in longer windows, which is consistent with Eun
et al. (1996). The losses of bidder shareholders around announcement suggest that
market does not expect CBA to generate value to bidder shareholders.
At announcement day, bidder shares present a negative CAAR of 0.15%, which is opposite to positive CAAR of 0.39% found by Martynova and Renneboog (2011). Our results also document statistically negative CAAR[-1;0] of -0.82% in bidder shares which is also opposite to the results found by Goergen and Renneboog (2004) that report a positive and significant CAAR of 2.38% for European bidders. In the longest event window ([-5;+5]) the CAAR of bidder shareholders remains negative and statistically significant (-4.73%). This result is consistent with Eun et al. (1996) that find that the cross-border acquisition of US targets cause wealth destruction for bidder shareholders. The results also show that CBA of non-European firms motivate higher losses for bidder shareholders than those of European firms. These results suggest that bidder firms pay larger premiums to acquire non-European firms.
While CBA of European firms provide a positive and statistically significant combined (bidder and target firms) effect, the same does not happen in the case of CBA of non-European target firms, where the CAAR is positive (less than 1%) but not statistically significant. The statistical significant positive effect of CBA announcement on combined shareholders wealth suggests that the bidders losses are offset by targets gains. Nevertheless, our evidence is contrary to Moeller and Schlingemann (2005) that report a negative and statistically significant combined CAAR[-1;+1].
4.1.2 Abnormal Returns by Period of Bid Announcement
Table 6 shows the results of bid announcement effect before and after the financial crisis of 2008.
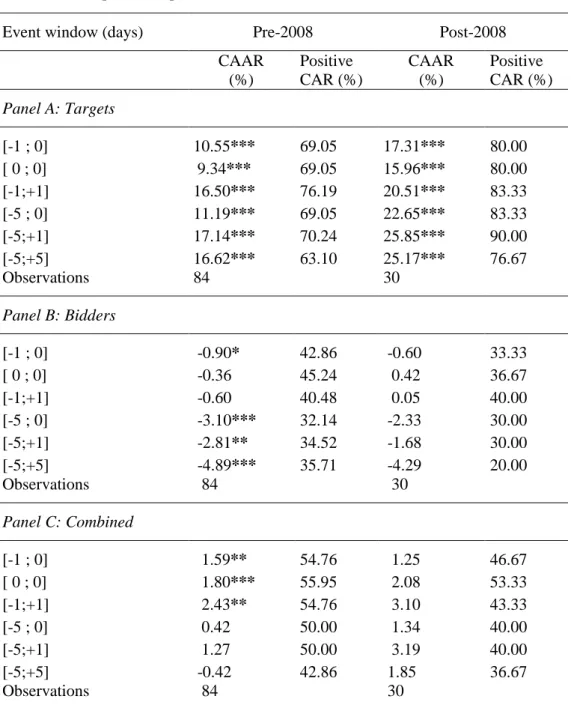
As shown in Table 6, the main conclusions on targets and bidders gains around announcement remain the same. The bid announcement effect on target shares is once more, strongly positive, although higher in post-2008 period. Providing that the sample is composed only by closed or effective CBA, the results show that target shareholders
earn larger abnormal returns in stages of economic and financial constraints transactions suggesting they retain more benefits in period of economic crisis than other periods.
Table 6 – Cumulative Abnormal Returns by Bid Announcement Period
This Table shows the cumulative abnormal returns measured over several event windows for targets, bidders as well as combined paired sample, by period of bid announcement (pre-2008, post-2008).
Event window (days) Pre-2008 Post-2008
CAAR (%) Positive CAR (%) CAAR (%) Positive CAR (%) Panel A: Targets [-1 ; 0] 10.55*** 69.05 17.31*** 80.00 [ 0 ; 0] 9.34*** 69.05 15.96*** 80.00 [-1;+1] 16.50*** 76.19 20.51*** 83.33 [-5 ; 0] 11.19*** 69.05 22.65*** 83.33 [-5;+1] 17.14*** 70.24 25.85*** 90.00 [-5;+5] 16.62*** 63.10 25.17*** 76.67 Observations 84 30 Panel B: Bidders [-1 ; 0] -0.90* 42.86 -0.60 33.33 [ 0 ; 0] -0.36 45.24 0.42 36.67 [-1;+1] -0.60 40.48 0.05 40.00 [-5 ; 0] -3.10*** 32.14 -2.33 30.00 [-5;+1] -2.81** 34.52 -1.68 30.00 [-5;+5] -4.89*** 35.71 -4.29 20.00 Observations 84 30 Panel C: Combined [-1 ; 0] 1.59** 54.76 1.25 46.67 [ 0 ; 0] 1.80*** 55.95 2.08 53.33 [-1;+1] 2.43** 54.76 3.10 43.33 [-5 ; 0] 0.42 50.00 1.34 40.00 [-5;+1] 1.27 50.00 3.19 40.00 [-5;+5] -0.42 42.86 1.85 36.67 Observations 84 30
Source: own calculation.
t-statistic follows a t-student distribution. ***, **, * denotes for 1%, 5% and 10% significance level for a two-tailed test. The Post-2008 period includes the period from 2008 (including) to 2010.
In terms of bidder shareholders our evidence only shows a significant and negative CAAR in longer windows in pre-2008 period where bidder shareholders face greater losses, which may suggest that in pre-crisis period bidders pay large premiums for targets. The CBA undertook before 2008 present positive combined wealth effect, although only statistically significant for shorter windows. For CBA launched on or after 2008, although the combine effect is still positive, it is not statistically significance in any time window.
4.1.3 Abnormal Returns by Industry Relatedness
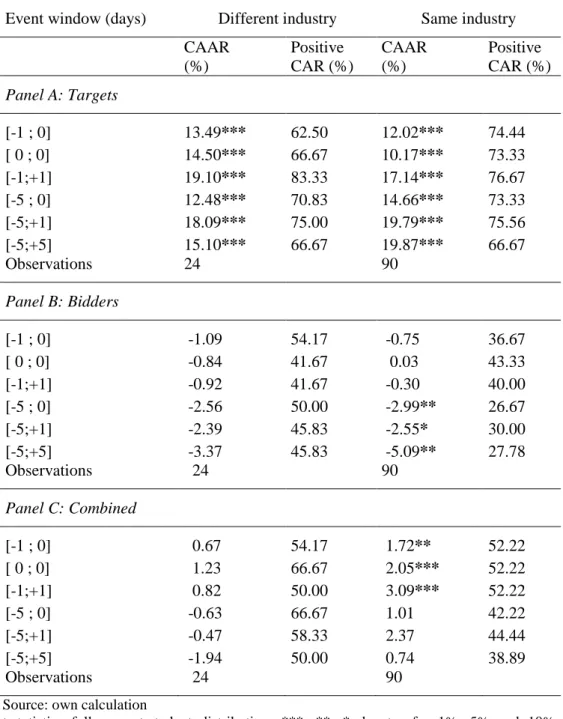
Panel A of Table 7 shows that in shorter event windows target firms shareholders experience higher CAAR in CBA between firms from different industry than in those from same industry which is consistent with previous evidence from by Martynova and Renneboog (2011). However, for lengthen event windows ([-5;0] and [-5;+5]) CBA within same industry are more profitable for shareholders of target firms.
Panel B of Table 7 shows that bidder shareholders tend to lose more in CBA between firms from the same industries than from different industries. For longer event windows CBA involving firms from the same industries have a significant negative impact in the bidder shareholders wealth. The effect on bidder shareholders wealth is negative but not significant in case of CBA between firms operating in different industries.
Panel C of Table 7 shows that CBA between firms from the same industries have higher and positive combined wealth effect, although only statistically significant in shortest windows around announcement day.
Table 7 - Cumulative Abnormal Returns by Industry Relatedness
This Table shows the cumulative abnormal returns over several event windows for targets, bidders as well as combined paired sample by industry code (different industry, same industry).
Event window (days) Different industry Same industry
CAAR (%) Positive CAR (%) CAAR (%) Positive CAR (%) Panel A: Targets [-1 ; 0] 13.49*** 62.50 12.02*** 74.44 [ 0 ; 0] 14.50*** 66.67 10.17*** 73.33 [-1;+1] 19.10*** 83.33 17.14*** 76.67 [-5 ; 0] 12.48*** 70.83 14.66*** 73.33 [-5;+1] 18.09*** 75.00 19.79*** 75.56 [-5;+5] 15.10*** 66.67 19.87*** 66.67 Observations 24 90 Panel B: Bidders [-1 ; 0] -1.09 54.17 -0.75 36.67 [ 0 ; 0] -0.84 41.67 0.03 43.33 [-1;+1] -0.92 41.67 -0.30 40.00 [-5 ; 0] -2.56 50.00 -2.99** 26.67 [-5;+1] -2.39 45.83 -2.55* 30.00 [-5;+5] -3.37 45.83 -5.09** 27.78 Observations 24 90 Panel C: Combined [-1 ; 0] 0.67 54.17 1.72** 52.22 [ 0 ; 0] 1.23 66.67 2.05*** 52.22 [-1;+1] 0.82 50.00 3.09*** 52.22 [-5 ; 0] -0.63 66.67 1.01 42.22 [-5;+1] -0.47 58.33 2.37 44.44 [-5;+5] -1.94 50.00 0.74 38.89 Observations 24 90
Source: own calculation
t-statistics follows a t-student distribution. ***, **, * denotes for 1%, 5% and 10% significance level for a two-tailed test.