The Author(s) 2018. Published by Oxford University Press on behalf of the European Public Health Association. All rights reserved. doi:10.1093/eurpub/cky071
. . . .
Who wants to cross borders in the EU for healthcare?
An analysis of the Eurobarometer data in 2007 and
2014
Andre´ Peralta-Santos1,2, Julian Perelman1,2
1 Department of Health Economics, Escola Nacional de Sau´de Pu´blica, Universidade Nova de Lisboa Av. Padre Cruz,
Lisboa, Portugal
2 Public Health Research Center, Escola Nacional de Sau´de Pu´blica, Universidade Nova de Lisboa Av. Padre Cruz, Lisboa, Portugal
Correspondence:Julian Perelman, Escola Nacional de Sau´de Pu´blica, Universidade Nova de Lisboa Av. Padre Cruz, 1600-560 Lisboa, Portugal, Tel: +351 217 512 100, Fax: +351 217 582 754, e-mail: [email protected]
Background:The European Union (EU) Directive on Patients’ Rights in Cross-border Healthcare clarified the en-titlements to medical care in other EU Member states. However, little is known about whether EU citizens have been travelling or are willing to travel to receive care. This study aimed to measure the determinants of cross-border patient mobility and willingness to travel to receive medical care in the EU, before and after the adoption of the Directive.Methods:We used individual data from theEurobarometer 210 (2007) and 425 (2014). In the 2 years, 53 439 EU citizens were randomly selected. We performed a logistic regression on the cross-border patient mobility and willingness to travel to other EU countries to use healthcare services as a function of the year (2007 or 2014), adjusting for age, gender, education and country size.Results:In 2007, 3.3% of citizens reported cross-border mobility and 4.6% in 2014. The odds of cross-cross-border patients’ mobility were 11% higher in 2014, compared with 2007 [odds ratio (OR) 1.11, 95% confidence interval (CI) 1.02–1.21]. Also, mobility was 19% higher in males (OR 1.19, 95% CI 1.08–1.30) and 20% higher amongst the more educated (OR 1.20, 95% CI 1.09–1.31). However, the odds decreased 11% per decade of age (OR 0.89 per decade, 95% CI 0.85–0.93) and country size. In 2014, the willingness to travel decreased by 20% compared with 2007.Conclusions:Cross-border patient mobility is more likely amongst the younger, the more educated and those from smaller countries. The directive does not seem to have promoted mobility at a large scale among the neediest citizens.
. . . .
Introduction
E
uropean Union (EU) law guarantees that every citizen is entitled to preventive healthcare and medical treatment.1 However, healthcare is an area in which the EU has limited power, i.e. due to the subsidiarity principle, the competencies remain mainly within the Member-States. Nevertheless, EU citizens have demanded the right to freely access other EU health systems since the end of the 90s, which was warranted by decisions of the European Court of Justice.2As a result, the negotiations began for the future Directive 2011/24/EU on patients’ rights in cross-border healthcare.Before 2011 the movement of EU patients to receive healthcare in another EU country (also known as cross-border patient mobility) accounted for more than 9.7 billion Euros in healthcare spending per year.3The cross-border patient mobility at that time was mainly due to unplanned care or referrals to other EU healthcare systems by national providers. Indeed, the cross-border patient mobility can be planned, for instance, if the patient deliberately travel across the border to obtain healthcare, or unplanned,4,5as shown intable 1.
The relevance of cross-border patient mobility is based on the assumption that the redistribution of supply and demand could lead to improved safety, quality and efficiency.6–10 Many authors have sought to describe the barriers and facilitators to cross-border patient mobility, namely, the proximity of cross-border services (geo-graphical and those related to language), perceived quality of care, affordability,4,11range of the basket of care12,13and responsiveness.14 Approved in 2011 and transposed to the national law of member states in 2013, the Directive 2011/24/EU on patients’ rights in cross-border facilitated cross-cross-border healthcare healthcare, although it did not create new entitlements, the Directive clarified the rights of patients to seek reimbursement for healthcare received in another Member-State.15Simply stated, an EU citizen who goes to another
country to purchase healthcare available in his home country should be covered by the home-country health insurance. The clarification of the entitlements made the reimbursement of health expenses in another Member-State more predictable and clarified the basket of care in the EU countries.16–18
However, some restrictions in the Directive were implemented, i.e. prior authorisations for hospitalisations that require an overnight stay and highly specialised, cost-intensive healthcare. On top of that, some countries required slightly different prior au-thorisation procedures.19,20This complex navigation framework can act by itself as a barrier to cross-border patient mobility.
To the best of our knowledge, no study has measured how patients (and which patients) may have changed their willingness to travel for healthcare following the implementation of the Directive. In this study, we measured the cross-patient mobility and its determinants before and after the implementation of the Directive. By doing so, we expect to highlight the extent to which the Directive has been successful in enhancing patient mobility across Europe, while the analysis of determinants will help identify which sub-populations should be targeted to improve the mobility patterns.
Methods
Data sources and study design
We used primary data from the flashEurobarometer 210 (2007)21 and the special Eurobarometer 425 (2014)22 obtained through the Leibniz-Institute for the Social Sciences (GESIS). The Eurobarometer’srepeated cross-section surveys covered participants from the EU Member-States, and each national sample was repre-sentative of the population aged 15 years and over. Participants were sampled using a multistage random sampling design based on country-specific population size. In 2007, the mode of data
collection was mainly through computerised assisted telephone interviews (70% of the sample) and the rest were face-to-face interview. For 2014, the mode of data collection was only face-to-face interview by computer assisted personal interviews. All variables were self-reported. The interviewer indicated the Country of residence; the study team recoded West and East-Germany into Germany and England and Northern Ireland into the UK. Detailed methods of the surveys’ methodology can be found elsewhere.23 The European Commission was responsible for the approval of the study protocols, and informed consent was obtained from all participants. The information was anonymised and de-identified before analysis.
Study outcomes
We studied two main outcomes: (i) if the participants had received medical care outside of their residency country over the 12 months preceding the interview, hereinafter called ‘cross-border patient mobility’ and (ii) if the participants were willing to travel to another EU state to receive medical care, hereinafter called ‘willing-ness to travel’. The questions related to these outcomes were asked in the same way as in bothEurobarometer 210(2007) and 425 (2014) ‘Have you received any medical treatment in another EU country in the last 12 months?’. The ‘cross-border patient mobility’ was coded as a binary variable, ‘yes’ or ‘no’. The question on willingness to travel, ‘Would you be willing to travel to another EU country to receive medical treatment?’, included three responses, ‘yes’, ‘no’ and ‘depends’. We coded the willingness to travel for healthcare as a binary variable, assimilating the ‘depends’ answer to an affirmative answer.
Explanatory variables
Age, gender, education, employment status and country size were included as explanatory variables, following earlier contributions on patient mobility.6,5,24 Age was measured in years and used as a continuous variable; however, to facilitate the interpretation, the odds ratio (OR) was presented in 10-year intervals. Education was a three-category variable, which indicated the age at which the person concluded her/his education: ‘less than 15 years old’, ‘more than 15 years-old’ or ‘still studying’. Employment status was divided into ‘working’, ‘retired’ and ‘not working’ (unemployed and students) categories. The country size was defined as the population size weight of the country based on the resident population, used by the Eurobarometer Survey, and the countries were then aggregated in population weight tertiles (large, medium and small countries). As there is no consensus about the definition of country sizes in the EU we decided to use population weights tertiles as a cut-off measure.
Sensitivity analysis
First, to account for potential misclassification of the ‘willingness to travel’ variable related to the decision to classify respondents who answered ‘depends’ as willing to travel, we replicated the models classifying people answering ‘depends’ as not willing to travel.
Second, to address the possible confounding effect attributable to not having information about health status, we used the bad and very bad self-perceived health (SPH) data from the European Survey on Income and Living Conditions (EU-SILC) for the years 2007 and 2014. We calculated the prevalence of ‘bad’ and ‘very bad’ SPH by country, age group, gender and employment status. This aggregate determinant was attributed to each observation from the Eurobarometer according to its country, age group, gender and employment status. The models were replicated adjusting for this group-specific prevalence of bad and very bad SPH.
Statistical methods
We used Chi-square tests to compare frequency distributions for categorical variables, and t-tests were used to compare the means of continuous variables (age). All proportions and means were weighted according to sampling weights.
We then pooled the data for 2007 and 2014 and performed a logistic regression on the cross-border patient mobility and willing-ness to travel to other EU countries. We modelled these outcomes as a function of the year (2007 or 2014), age, gender, education and country size.
Age was tested in the model in square root, quadratic and cubic function to check for non-linear behaviour. The missing data were not incorporated into the models. The population size weighting factors correct for the fact that most countries have almost identical sample sizes (n= 1000), no matter how large or small their populations are, these weights were applied to determine per-centages in descriptive analysis and in the multivariate analyses.
For the statistical analysis, we used Stata 13.
Results
The sample included 55 096 observations from all EU countries. After elimination of observations with missing data, the sample was reduced to 53 439 observations (3% of the sample was removed), distributed by 48.2% of the respondents in 2007 and 51.8% in 2014.
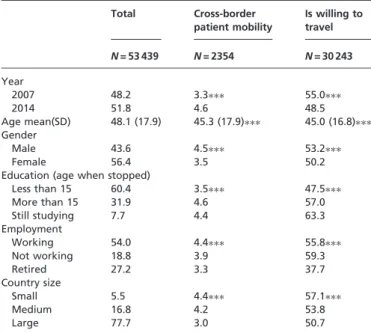
Table 2 shows the baseline characteristics of the population. The mean age is 48 years old and 56% are female. More than half of the interviewed were working, and 77% were from large European countries. Overall, interviewees who received medical care abroad (cross-border patient mobility) were younger (mean age 45.3 years), more likely to be male (4.5 vs. 3.5% in women), more educated (4.6 vs. 3.5% stopped studying after 15 years old). Also, retired individ-uals (3.3 vs. 4.4% working) and those from large countries (3.0 vs. 4.4% in small countries) received less medical care abroad. A very similar pattern was observed for the willingness to travel.
Cross-border patient mobility
Considering the whole sample, 4.0% engaged in cross-border patient mobility, which increased from 3.3% in 2007 to 4.6% in 2014. Nevertheless, the absolute values remained low. In the unadjusted Table 1 Reasons to seek cross-border medical care in the EU
Holidays/work trips
EU citizens who need to use the healthcare services on holidays in another EU/EEA country, or citizens who are on a work trip abroad in another EU/EEA country
Retirement EU citizens who retired to a different country and want to use the healthcare system where they currently live
Border regions EU citizens who live in border regions and share cultural and linguistic characteristics of the region in another EU country, and who want
to use the healthcare service closer to home, which might be on the other side of the border Perceived
advantages
EU citizens who seek cross-border healthcare due to perceived advantages of the system in another EU country, related to the price (out of pocket), comprehension of the basket of care, quality of the services or access (waiting times)
Health system incapacity
EU citizens who are sent abroad by their health systems to overcome capacity or expertise shortage at the national system. It concerns mainly smaller countries or regions with low population density
Adapted from ‘Health Care Provision and Patient Mobility, by Rosenmo¨ller M, McKeee M, Baeten R, Glinos I. Springer. 2006’.
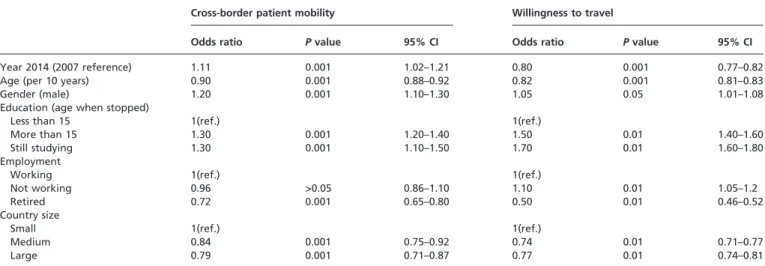
analysis, some factors favoured the cross-border patient mobility, among which gender and education were the most notable (table 3). In the adjusted analysis, males had a 19% increased likelihood of crossing borders when compared with women (OR 1.19 95% confidence interval (CI) 1.08–1.30). The EU citizens who stopped studying at age 15 years old or older had a 20% greater likelihood of cross-border patient mobility (OR 1.20 95% CI 1.09–1.31), when compared with those who stopped at 15 years old or younger. In the year 2014, there was an 11% increase in the likelihood of having received medical care abroad when compared with the year 2007 (OR 1.11 95% CI 1.02–1.21).
However, some determinants seem to hinder the cross-border patient mobility, corresponding to: older age, with an 11% decrease in the odds per decade (OR 0.89, 95% CI 0.85–0.93) and being from a medium (OR 0.84 95% CI 0.76–0.93) or large country (OR 0.78 95% CI 0.65–0.93). The employment and student status lost their significance in the adjusted model.
Willingness to travel to receive medical care
The willingness to travel to receive medical care fell from 2007 to 2014. Contrasting with the cross-border patient mobility low prevalence, the percentage of citizens willing to travel is high, 55.0% in 2007 and 48.5% in 2014. In 2014, 3.2% stated willingness to travel to receive healthcare would depend on the country’s provision of care, and 12.7% said it would depend on the type of treatment(data not shown in tables).
In the unadjusted model, the willingness to travel was significantly and positively associated with being male, more educated, in school and not working, while a significant negative association was observed for age, retired status and living in a non-large country (table 3).
In the adjusted model, the determinants that favoured the will-ingness to travel were being male (OR 1.07, 95% CI 1.01–1.08), being a non-worker (OR 1.07 95% CI 1.05–1.20), having stopped
studying at 15 years or older (OR 1.32 95% CI 1.26–1.37) and being from a large country (OR 1.54 95% CI 1.43–1.66) (table 4).
Some determinants in the adjusted model were barriers to the willingness to travel to receive medical care, such as older age (per 10 years) (OR 0.86 95% IC 0.84–0.87), being a student (OR 0.87 95% CI 0.80–0.96) or retired (OR 0.72 95% CI 0.68–0.76) and being from a medium country (OR 0.83 95% CI 0.80–0.87). The willingness to travel was significantly lower in 2014, as compared with 2007 (OR 0.80 95% CI 0.77–0.82).
Sensitivity analysis
In the model in which we categorised the ‘depends’ response as not willing to travel, the signal and significance of the year estimate were not altered. However, the 2014 reduction in willingness to travel changed from 20 to 59% (Supplementary table S1).
After the adjustment for self-reported health, most point estimates remained stable in significance and magnitude, namely year, age and gender. The significant major change was that people from large countries reported a lower willingness to travel, contrary to the model without self-reported health (Supplementary table S1).
Discussion
Key findings
We conducted a study seeking to identify the determinants of cross-border patient mobility and the willingness to travel to receive medical care in the EU using data from interviews of two Eurobarometer surveys. We found that between 2007 and 2014 there was an increase in cross-border mobility (+15%) and a decrease in willingness to travel to receive medical care ( 20%). This decrease was much more pronounced when people who answered ‘depends’ on the willingness to travel question were classified as not willing to travel ( 59%). Additionally, older people were less likely to seek medical care across the border ( 11% per decade) and less willing to receive medical care in another EU country ( 14% per decade). More educated EU citizens were more likely to seek healthcare abroad (+20%) and more willing to travel to receive care (+32%). The larger the country of residence, the less likely the use of cross-border medical care. Furthermore, men engaged more in cross-border medical care (+20%) and were more likely to be willing to seek medical care in another EU country (+7%).
Interpretation
The literature that compares cross-border mobility or willingness to travel in the EU is scarce. In a small survey in Malta, Busuttil et al.25 found similar determinants of willingness to travel. Also, there are no other regions of the globe with similar cross-border healthcare frameworks. For the USA, estimates of planned cross-border patient mobility vary between 1 and 1.5%,26although it can go up to 37% in the Mexican border region.27
Regarding the determinants of cross-border mobility and willing-ness to travel, one could hypothesise that younger patients are more likely to cross a border to seek medical care due to their greater facility to overcome some barriers such as language, as most younger people can communicate in a common language (English).28,29 The learning-by-doing effect might play a role as well, i.e. younger people who have already travelled to another Member-State for other purposes (e.g. Erasmus and DaVinci programmes) may be more likely to have experienced a foreign health system within the EU,30thereby being keener to engage in cross-border patient mobility.
To the best of our knowledge, the greater likelihood of males to travel for care has never been documented. We know, however, that men are also more likely (22%) to envisage working abroad in the EU, possibly in line with our results.31
Table 2 Baseline characteristics of the sample
Total Cross-border patient mobility
Is willing to travel
N= 53 439 N= 2354 N= 30 243
Year
2007 48.2 3.3 55.0
2014 51.8 4.6 48.5
Age mean(SD) 48.1 (17.9) 45.3 (17.9) 45.0 (16.8)
Gender
Male 43.6 4.5 53.2
Female 56.4 3.5 50.2
Education (age when stopped)
Less than 15 60.4 3.5 47.5
More than 15 31.9 4.6 57.0
Still studying 7.7 4.4 63.3
Employment
Working 54.0 4.4 55.8
Not working 18.8 3.9 59.3
Retired 27.2 3.3 37.7
Country size
Small 5.5 4.4 57.1
Medium 16.8 4.2 53.8
Large 77.7 3.0 50.7
Notes: all the percentages and means presented were weighted to be representative of the EU population. For categorical variables, a Chi-square test was performed in comparisons; for continuous
variables (age), at-test was performed. ThePvalues report to
com-parisons made with each category,
: Pvalues < 0.001.
Small size countries—LU; DK; IE; FI; CY; EE; LV; LT; MT; SI; HR; medium size countries: BE; GR; PT; SE; AT; CZ; HU; SK and large size countries: FR, NL; DE; IT; UK; ES; PL; RO.
Higher levels of education are not a surprising determinant of cross-border patient mobility and willingness to travel. More years of education entail a better understanding of rights and more demanding expectations of the healthcare system.25,32
Interestingly, employment status does not play a role in cross-border patient mobility. Working people with a steady income were expected to be more likely to be able to afford travel for care. However, our employment categories were possibly too broad and heterogeneous to capture differences in socio-economic conditions. The ‘employed’ category, in particular, may encompass very different occupations, social positions and incomes. It is surprising, however, that individuals not working would be more likely to be willing to travel for care. The not working condition may be associated with unmeasured health problems, possibly explaining this finding. Moreover, working individuals might find more difficult to take days off than non-workers to travel abroad.
The greater mobility by people from smaller countries may be explained by the possibly lower provision of highly specialised care, which is more profitable in large countries facing a greater demand.33 People in smaller countries also face lower travel distance to reach a neighbouring country. The most obvious example is Luxembourg, where 18% of people seek care abroad.22
The distance explanation may be the most plausible, as we observe that people from larger countries are more willing to travel but less likely to do so. In other terms, people from larger countries may also face unmet needs creating a willingness to travel, which is not satisfied because of geographical barriers.
The increase in mobility combined with a decrease in the willing-ness to travel could mean that some unmet needs were covered by seeking medical care abroad. Some authors claim that cross-border patient mobility could redistribute supply and demand towards a better provision of care regarding safety, quality and efficiency.2 Also, the decrease in the willingness to travel to seek care abroad could mean that unmet needs within the country were reduced following the Directive. Indeed, some literature reports that the Directive was an opportunity to implement reforms10including le-gislation on patients’ rights,16,17 the definition of health benefits package and compulsory indemnity insurance, however, although with variations across countries,34it seems thus that the Directive had positive spillovers.
Despite the 1.3 percentage point increase in cross-border patient mobility in 2014, the absolute numbers remain low. Even with the implementation of the Directive, we are far from a dynamic EU health market. In the process of engaging in cross-border patient Table 3 Determinants of cross-border patient mobility and willingness to travel in the EU, unadjusted model
Cross-border patient mobility Willingness to travel
Odds ratio Pvalue 95% CI Odds ratio Pvalue 95% CI
Year 2014 (2007 reference) 1.11 0.001 1.02–1.21 0.80 0.001 0.77–0.82
Age (per 10 years) 0.90 0.001 0.88–0.92 0.82 0.001 0.81–0.83
Gender (male) 1.20 0.001 1.10–1.30 1.05 0.05 1.01–1.08
Education (age when stopped)
Less than 15 1(ref.) 1(ref.)
More than 15 1.30 0.001 1.20–1.40 1.50 0.01 1.40–1.60
Still studying 1.30 0.001 1.10–1.50 1.70 0.01 1.60–1.80
Employment
Working 1(ref.) 1(ref.)
Not working 0.96 >0.05 0.86–1.10 1.10 0.01 1.05–1.2
Retired 0.72 0.001 0.65–0.80 0.50 0.01 0.46–0.52
Country size
Small 1(ref.) 1(ref.)
Medium 0.84 0.001 0.75–0.92 0.74 0.01 0.71–0.77
Large 0.79 0.001 0.71–0.87 0.77 0.01 0.74–0.81
Notes: small countries—LU; DK; IE; FI; CY; EE; LV; LT; MT; SI; HR; medium size countries: BE; GR; PT; SE; AT; CZ; HU; SK and large size countries: FR, NL; DE; IT; UK; ES; PL; RO.
Table 4 Determinants of cross-border patient mobility and willingness to travel in the EU, fully adjusted model
Cross-border patient mobility Willingness to travel
Odds ratio Pvalue 95% CI Odds ratio Pvalue 95% CI
Year 2014 (2007 reference) 1.11 0.001 1.02–1.21 0.80 0.001 0.77–0.82
Age (per 10 years) 0.89 0.001 0.85–0.93 0.86 0.001 0.84–0.87
Gender (male) 1.19 0.001 1.08–1.30 1.07 0.01 1.01–1.08
Education (age when stopped)
Less than 15 1(ref.) 1(ref.)
More than 15 1.20 0.001 1.09–1.31 1.32 0.01 1.26–1.37
Still studying 0.86 >0.05 1.10–1.50 0.87 0.01 0.80–0.96
Employment
Working 1(ref.) 1(ref.)
Not working 1.01 >0.05 0.88–1.17 1.07 0.05 1.05–1.2
Retired 1.02 >0.05 0.65–1.16 0.72 0.001 0.68–0.76
Country size
Small 1(ref.) 1(ref.)
Medium 0.84 0.001 0.76–0.93 0.83 0.01 0.80–0.87
Large 0.78 0.01 0.65–0.93 1.50 0.01 1.40–1.60
Notes: small countries—LU; DK; IE; FI; CY; EE; LV; LT; MT; SI; HR; medium size countries: BE; GR; PT; SE; AT; CZ; HU; SK and large size countries: FR, NL; DE; IT; UK; ES; PL; RO.
mobility, the willingness to travel is the first stage. One could consider the willingness to travel as the maximum stock of the population that may travel; therefore, only a 10th of those who are willing to travel actually engage in cross-border patient mobility. The small relative increase in the recent years could be influenced by the financial, economic and social crisis in Europe. Cross-border mobility under the new Directive demands consider-able out-of-pocket expenditures because the reimbursement of expenses is done after the provision of services. Adverse economic circumstances could, thus, have a negative impact on cross-border patient mobility. However, cross-border mobility to countries where the cost of care is significantly lower must always be considered as a potential motivation, despite all the barriers. Time may also play an important role, since the Directive came into force only 1 year before the second survey, giving little time for the information to permeate into health systems and to the general public knowledge.
Strengths and limitations
This study is to the best of our knowledge the first to quantify the determinants of cross-border patient mobility and the willingness to travel to receive medical care, at the EU level. We were able to demonstrate empirically what was earlier theorised,4 that citizens from larger countries, which can concentrate more healthcare resources are less likely to seek medical care abroad.
This study has some limitations. First, the surveys in 2007 and 2014 had some differences in the methodology applied. In 2007, the survey used mainly telephone interviews, which might lead to some selection bias towards participants who spend more time at home (retired, unemployed), with a lower purchasing power, and therefore less likely to seek medical care abroad. In 2014, all interviews were done face-to-face. These different methods might overestimate the difference in cross-border mobility between the 2 years. Although this might affect the estimate of the ‘Year’ determinant, it is unlikely to influence the other determinants.
Also, the causal pathway from socio-demographic determinants to cross-border mobility could not be adequately assessed, which would require information about unmet medical needs, affordability of care and perceived medical quality. However, our study was a first assessment of determinants of cross-border mobility, distinguishing which sub-populations travel or are willing to travel. This is valuable information for decision-making, although more detailed surveys are necessary for a complete understanding of the phenomenon.
Another limitation is related to the inability to stratify patient mobility into planned and unplanned. In the 2014 survey, this strati-fication was possible but in 2007 the stratified data were not available. That could be seen as a limitation because planned and unplanned medical care might have different determinants. Hence, planned or unplanned care might act as an effect modifier. The European Commission reports that 40% of all the cross-border
patient mobility is planned.
Future research
One of the most exciting aspects to study in the future is the rela-tionship between health condition, unmet needs, cross-border patient mobility and the willingness to seek medical care abroad. Whether the current EU legislation effectively protects the EU citizens from constraints in the country health systems generating unmet needs is unknown.
Conclusion
Our study demonstrates that being younger, male, more educated and from a small country increases the likelihood of engaging in cross-border patient mobility and that this mobility, although remaining at very low levels, increased in Europe between 2007 and 2014, following the implementation of the patients’ rights in
cross-border healthcare Directive. The weak and socially patterned rate of cross-border patient mobility indicates that we are far from a European healthcare market, whose potential benefits are within reach. Policy-makers should consider changes to promote the directive among European decision-makers and populations, with a particular focus on the neediest and most vulnerable.
Supplementary data
Supplementary dataare available atEURPUBonline.
Acknowledgements
This study was presented at the 2016 European Public Health Conference and was nominated for the Ferenc Bojan: Young Investigator Award. To the reviewers for the valuable comments and contributions.
Conflicts of interest: None declared.
Key points
Being younger, male, more educated and from a small
country increases the likelihood of engaging in cross-border patient mobility.
Patient mobility, although remaining at very low levels,
increased in Europe between 2007 and 2014.
The 2011 cross-border Directive does not seem to have
promoted patient mobility on a large scale.
References
1 European Parliament.Charter of Fundamental Rights of the European Union Parliament TE, Editor. Brussels: Official Journal of the European Communities, 2000.
2 Brooks E. Crossing borders: a critical review of the role of the European Court of Justice in EU health policy.Health Policy2012;105:33–7.
3 European Commission.The European Parliament and Council on the Application of Patients’ Rights in Cross-Border Healthcare—Impact Assessment. Brussels, 2009. 4 Legido-Quigley H, Glinos I, Baeten R, et al. Analysing arrangements for cross-border mobility of patients in the European Union: a proposal for a framework.
Health Policy2012;108:27–36.
5 Glinos I, Baeten R, Helble M, Maarse H. A typology of cross-border patient mobility.Health Place2010;16:1145–55.
6 Wismar M, Palm W, Figueras J, et al.Cross-Border Health Care in the European Union Mapping and Analysing Practices and Policies European, 1st edn.. Policies OoHSa, editor. Brussels: Observatory on Health Systems and Policies, 2011. 7 Glinos I, Baeten R, Maarse H. Purchasing health services abroad: practices of
cross-border contracting and patient mobility in six European countries.Health Policy
2010;95:103–12.
8 Brand H, Hollederer A, Wolf U, Brand A. Cross-border health activities in the Euregios: good practice for better health.Health Policy2008;86:245–54. 9 Palm W, Baeten R. The quality and safety paradox in the patients’ rights Directive.
Eur J Public Health2011;21:272–4.
10 Vallejo P, Su-Ol R. MARQulS: quality improvement strategies for European cross-border healthcare.Qual Saf Health Care2009;18:i1–2.
11 Glinos I, Doering N, Maarse H. Travelling home for treatment and EU patients’ rights to care abroad: results of a survey among German students at Maastricht University.Health Policy2012;105:38–45.
12 Busse R, Schreyo¨gg J, Smith PC. Variability in healthcare treatment costs amongst nine EU countries–results from the HealthBASKET project.Health Econ
2008;17:S1–8.
13 Schreyogg J, Stargardt T, Velasco-Garrido M, Busse R. Defining the ‘‘Health Benefit Basket’’ in nine European countries. Evidence from the European Union Health BASKET Project.Eur J Health Econ2005;6:2–10.
14 Brouwer W, Exel J, Hermans B, Stoop A. Should I stay or should I go? Waiting lists and cross-border care in the Netherlands.Health Policy2003;63:289–98. 15 Legido-Quigley H, Passarani I, Knai C, et al. Cross-border healthcare in Europe:
clarifying patients’ rights.BMJ2011;342:d296–7.
16 Azzopardi-Muscat N, Aluttis C, Sorensen K, et al. The impact of the EU Directive on patients’ rights and cross border health care in Malta.Health Policy
2015;119:1285–92.
17 Requejo M. Cross-border healthcare in Spain and the implementation of the Directive 2011/24/EU on the Application of Patient’s Rights in Cross-border Healthcare.Eur J Health Law2014;21:79–45.
18 Vidalis T, Kyriakaki I. Cross-border healthcare: directive 2011/24 and the Greek law.
Eur J Health Law2014;21:33–45.
19 Greer SL. Avoiding another directive: the unstable politics of European Union cross-border health care law.Health Econ Policy Law2013;8:415–21.
20 European Commission. Member state data on cross-border healthcare following Directive 2011/24/EU. Annual report. Brussels: European Commission, DG Health, 2015.
21 European Commission. Flash Eurobarometer 210 (Cross-border Health Services in the EU). The GALLUP Organisation, Brussels. GESIS Data Archive, Cologne. ZA4805 Data file Version 1.0.0, 2007.
22 European Commission. Special Eurobarometer 425 (82.2 wave) Patients’ rights in cross-border healthcare in the European Union. TNS Opinion & Social GESIS Data Archive, Cologne. ZA5931 Data file Version 2.0.0, 2015.
23 GESIS. Eurobarometer Data Service GESIS. [Online], 2017 [cited 2017 June 1]. Available at: series/flash-eb/sampling-fieldwork/ or http://www.gesis.org/eurobarometer-data-service/survey-series/flash-eb/sampling-fieldwork/ (1 June 2017, date last accessed).
24 Glinos I, Baeten R. A literature review of cross-border patient mobility in the European Union, 2006. Available at: http://www.ose.be/files/publication/health/ WP12_lit_review_final.pdf (19 April 2018, date last accessed).
25 Busuttil ML, Azzopardi-Muscat N, Calleja N. Patients’ willingness to access cross-border healthcare.Physiotherapy2016;102:e193.
26 Keckley PH.Medical Tourism: Update and Implications. Boston: Deloite, Center for Health Solutions, 2009.
27 Su D, Richardson C, Wen M, Paga´n J. Cross-Border Utilization of Health Care: evidence from a population-based study in South Texas.Health Serv Res
2011;46:859–76.
28 Eurostat. Foreign language learning statistics. [Online]. Brussels: European Commission, 2016 [cited 2017 June 10]. Available at: http://ec.europa.eu/eurostat/ statisticsexplained/index.php/Foreign_language_learning_statistics or http://ec. europa.eu/eurostat/statistics-explained/index.php/Foreign_language_learning_ statistics (10 June 2017, date last accessed).
29 Brekke K, Levaggi R, Siciliani L, Straume O. Patient mobility and health care quality when regions and patients differ in income.J Health Econ2016;50:372–87. 30 Barslund M, Busse M, Vargas-Silva C, et al. Labour mobility in the EU: dynamics,
patterns and policies.Intereconomics2014;49:116–58.
31 European Commission. Geographical and labour market mobility | Special Eurobarometer 337, 2014. Available at: http://ec.europa.eu/commfrontoffice/publi-copinion/archives/ebs/ebs_337_en.pdf (19 April 2018, date last accessed). 32 Busse M, Barslund M. Labour Mobility in the EU: Dynamics, Patterns and Policies.
Intereconomics2014;49:116–58.
33 Panteli D, Wagner C, Verheyen F, Busse R. Know before you go’: information-seeking behaviour of German patients receiving health services abroad in light of the provisions of Directive 2011/24/EU.J Health Serv Res Policy2015;20:154–61. 34 Azzopardi-Muscat N, Baeten R, Clemens T, et al. The role of the 2011 patients’
rights in cross-border health care directive in shaping seven national health systems: looking beyond patient mobility.Health Policy2018;122:279–83.